Vscode: Large portions of the window not repainting on high DPI/resolution displays
Issue Type: Bug
When VS Code sits open for a while, say in the background or after an unmeasured time of just sitting around, large portions of the window appear to not repaint. This also occurs with more "complicated" views, such as the terminal or git diff views, upon scrolling. This causes an insane amount of flickering, and in git diff views it's almost impossible to use as large portions of the screen don't repaint upon scrolling.
This does not occur in other Electron apps, such as Discord or GPMDP, nor does it appear in Chromium or Chrome (not that I suppose that matters).
I know this is a bit of a duplicate of old issues, as I've seen issues like #12473 before, but all of those have been marked as resolved. I don't know if it's my system specifically or what, but none of the fixes in any of these issues seem to work; not even --disable-gpu, --force-gpu-rasterization, window.zoomLevel: 0, or any of the other tricks have had any effect.
I don't see it mentioned in the system info, so I suppose I should also note that I'm running on an AMD RX 480 with mesa and the AMDGPU open source drivers, on KDE X11.
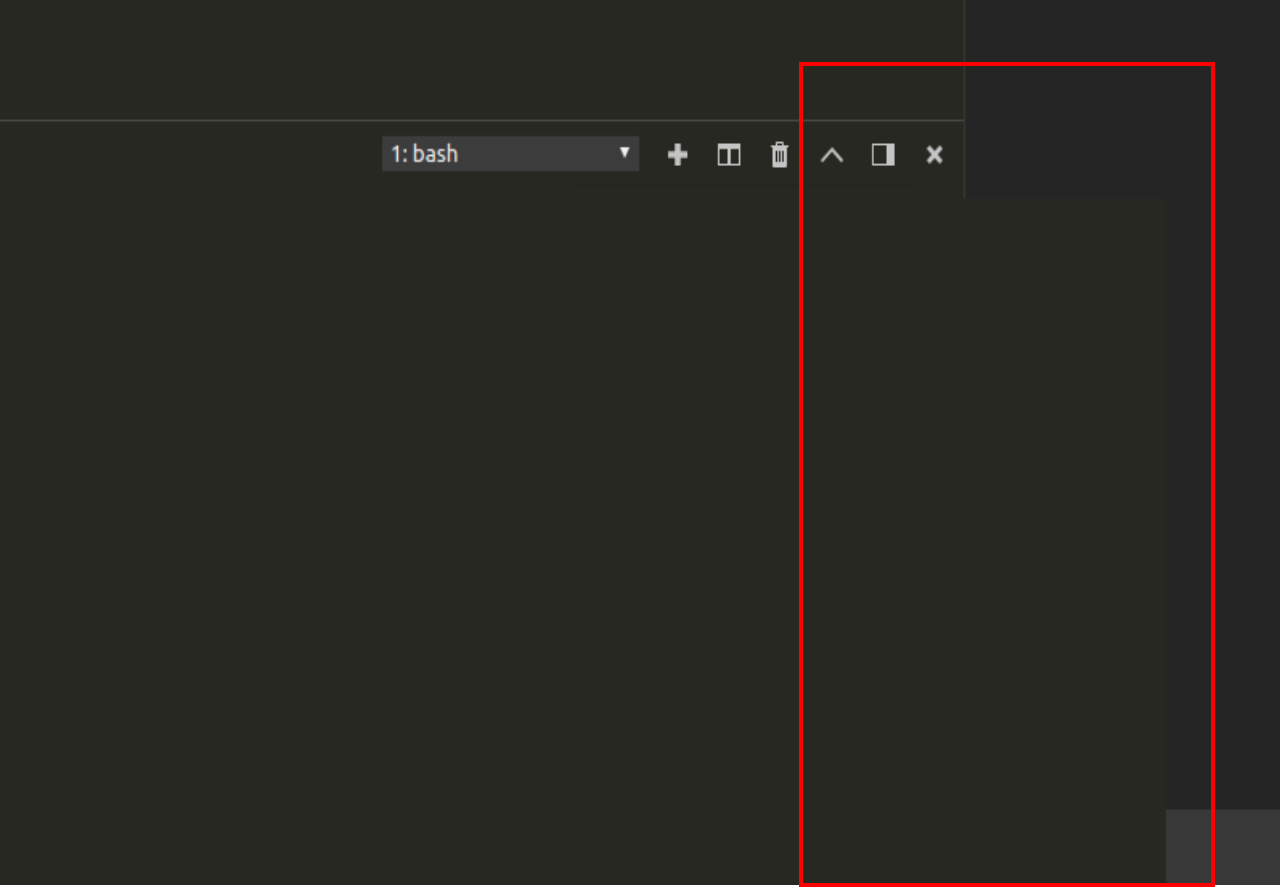
Screenshots
(Both of these are more related to the git diff issue, but I don't have a good way to record nor reproduce the time-based flickering issue yet.)

Launched with
--disable-extensions. Notice how a lot of the code is missing, and the terminal has a very large section of gray.

Yet another screenshot, this one with more pronounced differences. Interestingly, scrolling around in the git diff view seems to partially fix the terminal, and vice versa, even though the panel being scrolled becomes more broken.
Steps to reproduce
- Launch VS Code (even with
--disable-gpuor--force-gpu-rasterization) - Open a git diff view, or let the editor sit for a while
- Observe obnoxious rectangles
VS Code version: Code 1.21.0 (9a199d77c82fcb82f39c68bb33c614af01c111ba, 2018-03-07T11:01:43.521Z)
OS version: Linux x64 4.15.7-1-zen
System Info
|Item|Value|
|---|---|
|CPUs|AMD FX(tm)-8350 Eight-Core Processor (8 x 3734)|
|Load (avg)|1, 2, 1|
|Memory (System)|15.61GB (5.59GB free)|
|Process Argv|/opt/visual-studio-code/code|
|Screen Reader|no|
|VM|0%|
Extensions (51)
Extension|Author (truncated)|Version
---|---|---
language-x86-64-assembly|13x|2.2.11
vscode-markdownlint|Dav|0.13.0
EditorConfig|Edi|0.12.1
vsc-material-theme|Equ|1.5.1
much-assembly-required-language-support|PJB|0.1.5
vscode-docker|Pet|0.0.25
code-settings-sync|Sha|2.9.0
project-manager|ale|0.24.1
vscode-twig-pack|baj|1.0.0
love|bsc|0.3.6
npm-intellisense|chr|1.3.0
path-intellisense|chr|1.4.2
gitignore|cod|0.5.0
vscode-eslint|dba|1.4.7
git-extension-pack|don|0.1.3
githistory|don|0.4.0
gitlens|eam|8.1.0
tslint|eg2|1.0.28
vscode-npm-script|eg2|0.3.3
prettier-vscode|esb|1.2.2
php-debug|fel|1.12.1
php-intellisense|fel|2.2.9
auto-close-tag|for|0.5.6
code-runner|for|0.9.1
discord-vscode|icr|2.2.1
search-node-modules|jas|1.3.0
csharpextensions|jch|1.3.0
docthis|joe|0.6.0
docomment|k--|0.0.17
Go|luk|0.6.77
MagicPython|mag|1.0.12
license-injector|mar|0.0.2
dotenv|mik|1.0.1
prettify-json|moh|0.0.3
vscode-apache|mrm|1.1.1
python|ms-|2018.2.1
cpptools|ms-|0.15.0
csharp|ms-|1.14.0
PowerShell|ms-|1.6.0
debugger-for-chrome|msj|4.2.0
php-docblocker|nei|1.3.3
proto|pet|0.0.2
livescript|pse|0.1.1
sass-indented|rob|1.4.8
code-spell-checker|str|1.6.5
much-assembly-required-upload-on-save|tom|0.0.6
gitblame|wad|2.2.0
nodejs-extension-pack|wad|0.1.9
vscode-import-cost|wix|2.6.2
JavaScriptSnippets|xab|1.5.0
vscode-open-in-github|ziy|1.3.1
Reproduces without extensions
 BytewaveMLP
All 87 comments
@BytewaveMLP does it reproduce when you run with code --disable-gpu?
 bpasero
on 17 Mar 2018
bpasero
on 17 Mar 2018
@bpasero Yes. Both --disable-gpu and --force-gpu-rasterization had no effect. Extensions were disabled while testing.
BytewaveMLP
on 17 Mar 2018
I feel like this has something to do with higher DPI displays. I've noticed that running Code in a smaller window seems to lessen if not eliminate the effect (but it also makes it much less usable).
For reference, this is a 4k display with 1.7 DPI scaling in KDE. But, again, other Electron applications running at the same resolution are unaffected (Discord used to be, but that was months ago; perhaps it's some sort of regression?).
My apologies for not mentioning this earlier. It hadn't really crossed my mind.
BytewaveMLP
on 18 Mar 2018
I have the same issue, running ubuntu 16.04 with a 4k monitor with an AMD graphics card (AMD OLAND (DRM 2.43.0 / 4.4.0-116-generic, LLVM 5.0.0)).
It seems to have worsened since the terminal splitting feature (which is so awesome to use on my windows laptop, but unusable on my ubuntu setup). The git diff spilt view has been causing flickering and blank rectangles for some time but I got by without using it. Now, however, the flickering is happening even when there's no screen splitting enabled.
I've also tried running code with --disable-gpu and --force-gpu-rasterization. This seems to improve the git split screen a little but certainly doesn't fix the problem, and the terminal splitting remains unusable.
Similar to @BytewaveMLP, if I reduce the window size, the problem is alleviated somewhat, but that does defeat the purpose of my shiny 4k monitor!

notice big white, grey and dark grey rectangles over the side panel and terminal windows in the example above. But it happens all over the screen, usually triggered by scrolling. Often there's flickering but it's when they don't go away and the code is obscured, that the app becomes unusable
 danloiterton
on 19 Mar 2018
danloiterton
on 19 Mar 2018
I've experienced the issue on Windows 10, laptop has a native WQHD 1440p screen, set to 150% scaling, but mostly only use a larger monitor at 100% scaling. I also get strange painting issues with terminals, and text sometimes disappears altogether until I type some commands, or the position of the current active line gets moved INTO the existing displayed console output. This was even before the split console feature.
 mix3d
on 20 Mar 2018
mix3d
on 20 Mar 2018
I am running into a similar problem. I saw there are a few tickets open on similar issues, notably I followed #25934 more closely.
In my case, the problem started today, without any update, change of configurations or recent addition of extensions.
I'm running version 1.21.1 on a MacBook with 15in Retina Display (2880 x 1800). It has worked flawlessly for over a year.
What did notice is that people reporting the problem happening with 3-way screen split. Today I started using the terminal (not the editor) in a 3-way split and since then, it's been almost impossible to work around the issue.
 guioconnor
on 22 Mar 2018
guioconnor
on 22 Mar 2018
This might workaround the problem:
code --ignore-gpu-blacklist
 Tyriar
on 23 Mar 2018
Tyriar
on 23 Mar 2018
@tyriar how do you set code to always launch with a command?
mix3d
on 23 Mar 2018
@mix3d did it work? On Windows I think you could create a shortcut and modify it, or launch from a batch script (note it's only the first window that needs to be launched like this).
Tyriar
on 23 Mar 2018
Yup, it seems like --ignore-gpu-blacklist fixes it @Tyriar; however, it's annoying to have to edit all my .desktop files to support this. Fortunately, KDE makes that easy, but it's kinda difficult to set $EDITOR with flags (Code doesn't seem to like the filename being passed after command line arguments, but perhaps that's another bug to report).
I suppose a simple bash script could be used to work around these limitations, though. Something as simple as:
#/bin/bash

code "$@" --ignore-gpu-blacklist
could make a simple enough workaround.
BytewaveMLP
on 24 Mar 2018
Sounds like a good opportunity to open that value as an editor config? Or is that too far into the app loading process?
mix3d
on 24 Mar 2018
It could at least be a prelaunch thing. On Arch, the Google Chrome package "binary" actually Chrome from a shell script that reads a file ~/.config/chrome-flags.conf and uses its contents as command line arguments to pass to the actual Chrome instance. Something like that could be used here.
BytewaveMLP
on 24 Mar 2018
@BytewaveMLP great, we have a root cause! This is happening because Chromium maintains a list of GPUs to disable as they have issues, unfortunately in VS Code this manifests itself as corrupted textures inside the canvas for some reason.
I'm curious if the same thing happens when you run Google Chrome?
Sounds like a good opportunity to open that value as an editor config? Or is that too far into the app loading process?
@mix3d I think it's too far, we don't touch the settings file until the Electron main process is launched.
Tyriar
on 27 Mar 2018
@Tyriar It's hard to say. Chrome doesn't have any flickering issues when the ignore-gpu-blacklist flag is disabled, but it does seem considerably less performant, and changing views (e.g. switching tabs) does seem to cause a sort of "wiping" effect much like VS Code was exhibiting. Discord, another Electron app, used to have a similar problem to the one noted in this issue, but it would only appear at certain startups and could be fixed after a client or system restart; it was never reliable reproducible, and was fixed a while ago )likely ignoring the blacklist themselves). GPMDP, however, does have a slight flickering and poor performance problem, which does seem related.
BytewaveMLP
on 28 Mar 2018
@BytewaveMLP oh it should only show up when you're using a canvas though. To test this out you could run the xterm.js demo inside Chrome (which is what the terminal is built on) as that's a canvas that's doing a lot of painting. Try tweaking the rows/cols in the textbox below and running some commands. https://github.com/xtermjs/xterm.js#linux-or-macos
Tyriar
on 28 Mar 2018
Er... whoops. I guess I missed the canvas part initially. Sorry about that.
However, even with the GPU blacklist enabled and something that should cause a lot of repainting (hd /dev/urandom), I'm unable to get any flickering out of Chrome, and only some poor performance, even with an exceptionally large terminal size (500x100, anyone?).
BytewaveMLP
on 29 Mar 2018
@Tyriar I can also confirm that code --ignore-gpu-blacklist fixes this issue in vscode.
Also, chrome has been doing some similar flickering for me since I upgraded my monitors and graphics card. Not all the time but if I use some graphically intense web apps - eg. today I was building a diagram with gliffy. As the diagram became more complex, the flickering started and gradually intensified
I ran google-chrome --ignore-gpu-blacklist and this also fixed the issue!
danloiterton
on 29 Mar 2018
@danloiterton Don't forget that Chrome has chrome://flags which should let you set the --ignore-gpu-blacklist flag without having to pass it on the command line. Code doesn't have a similar interface, unfortunately, but at least you don't have to make a shell script for everything. :P
BytewaveMLP
on 29 Mar 2018
Same issue here, started to have it after updating vscode last week I think. I have it on a Macbook Pro Retina 15 inches, but it doesn't occur on my secondary screen which is default DPI.
 jeremyfa
on 29 Mar 2018
jeremyfa
on 29 Mar 2018
what's the impact if we turn it on for all builds as part of the regular
release?
On Thu, Mar 29, 2018, 12:12 PM Jérémy Faivre notifications@github.com
wrote:
Same issue here, started to have it after updating vscode last week I
think. I have it on a Macbook Pro Retina 15 inches, but it doesn't occur on
my secondary screen which is default DPI.—
You are receiving this because you were mentioned.
Reply to this email directly, view it on GitHub
https://github.com/Microsoft/vscode/issues/45492#issuecomment-377287170,
or mute the thread
https://github.com/notifications/unsubscribe-auth/ABZ-WU6f3IbxZbH1HpG2Gmex0kANWCHZks5tjQfOgaJpZM4Sle38
.
mix3d
on 29 Mar 2018
I believe the list of disabled/enabled cards is available here. Any systems with these cards disabled with good reason may be affected, but considering the age of most of these... hm.
BytewaveMLP
on 29 Mar 2018
@BytewaveMLP it looks like this file is what's used and goes into detail on what features are disabled for each configuration. accelerated_2d_canvas is the primary feature we need for this, not 100% sure what other ones affect canvas rendering.
Tyriar
on 29 Mar 2018
Not sure if it helps, but my gpu setup is just the Intel HD Graphics 620
from a 1 year old Lenovo laptop. Not something I would expect to cause
issues or be blacklisted.
On Thu, Mar 29, 2018, 1:19 PM Daniel Imms notifications@github.com wrote:
@BytewaveMLP https://github.com/BytewaveMLP it looks like this file
https://cs.chromium.org/chromium/src/gpu/config/software_rendering_list.json?q=software_rendering_list&sq=package:chromium&dr
is what's used and goes into detail on what features are disabled for each
configuration. accelerated_2d_canvas is the primary feature we need for
this, not 100% sure what other ones affect canvas rendering.—
You are receiving this because you were mentioned.
Reply to this email directly, view it on GitHub
https://github.com/Microsoft/vscode/issues/45492#issuecomment-377308258,
or mute the thread
https://github.com/notifications/unsubscribe-auth/ABZ-WUUBNmPERAH_p5_XdVDE1KmN1e4gks5tjRe-gaJpZM4Sle38
.
mix3d
on 29 Mar 2018
@mix3d maybe it's this one? https://cs.chromium.org/chromium/src/gpu/config/software_rendering_list.json?q=software_rendering_list&sq=package:chromium&dr&l=748
You could try updating your drivers. Intel is mentioned a lot in that file, it's tough to tell without knowing. Also we'll be on an older version of that file since Electron isn't on the latest version of Chromium, so the list will be a little different for us.
Tyriar
on 29 Mar 2018
I've got the same issue on a Lenovo P50 (4K display) in an Ubuntu 14.04 VM. The issue to get worse with window size. --ignore-gpu-blacklist does not seem to resolve the issue.
 martinmeinke
on 30 Mar 2018
martinmeinke
on 30 Mar 2018
@martinmeinke GPU support always seems to be broken in VMs, try --disable-gpu and also disabling GPU acceleration in the VM settings if available.
Tyriar
on 30 Mar 2018
This issue has been closed automatically because it needs more information and has not had recent activity. See also our issue reporting guidelines.
Happy Coding!
![vscodebot[bot] picture](https://avatars2.githubusercontent.com/in/2406?v=4&s=40) vscodebot[bot]
on 6 Apr 2018
vscodebot[bot]
on 6 Apr 2018
No, bad bot. We had something going here. 😡
BytewaveMLP
on 6 Apr 2018
I'm also having this issue. Just installed VS Code to try it out on macOS 10.13.4 and have insane flickering using an external monitor. I'm using macOS in "like 2K" mode on a 4K LG 32UD89 running on USB-C video. It's migraine-inducing.
I'm on a 2016 15" rMBP w/Touch Bar.
It isn't just flickering, it randomly seems to stall drawing/re-rendering of the page inside VS Code, but mostly flickering.
None of the recommended fixes like --disable-gpu or "editor.disableTranslate3d": true in Preferences make any difference.
It seems to happen when switching windows (Cmd+Tab) or tabs in VS Code (Ctrl+Tab), saving a file, creating a new file or (ironically) editing Preferences.
As I just installed this I expected it to be a known issue only to find literally hundreds of posts about it and even a work-around mentioned a year ago here: https://code.visualstudio.com/updates/v1_12. It's a little disconcerting that this has been reported many times on GitHub, yet it seems like every time you guys are surprised it's happening.
https://github.com/electron/electron/issues/9413 <- supposedly this fixed it
https://github.com/Microsoft/vscode/issues/25934
https://github.com/Microsoft/vscode/issues/41513
https://github.com/Microsoft/vscode/issues/41238
Even in Ubuntu:
https://github.com/Microsoft/vscode/issues/41513 (there's as many of these since 2017)
Not really a great first taste for someone coming from Atom although I really like the feature set. Maybe I'll try this again when it's ready for production on Mac ;)
 methodbox
on 9 Apr 2018
methodbox
on 9 Apr 2018
I think this was never actually fixed, there was a workaround in Chrome: https://bugs.chromium.org/p/chromium/issues/detail?id=695427
But that did not actually fix the issue.
I got used to just restart VSCode, but it just gets broken sooner and sooner with new releases (the terminal seem to be affecting it badly).
1.22.1 made the problem worse again.
(my machine: MBPro 15inch, mid2015, macOs 10.13.4, 16GB ram, Intel Iris Pro 1536 MB ram)
The only really working "workaround" right now is to run the external display in native resolution without scaling.
 teki
on 9 Apr 2018
teki
on 9 Apr 2018
This was bugging me so I did a little digging. Found a nice list of command line switches for Chromium here: https://peter.sh/experiments/chromium-command-line-switches/.
When I launch VS Code from Terminal with code --disable-gpu-memory-buffer-compositor-resources the issue is resolved.
Note that during my search I also found that there seems to be a known issue relating to the cursor blink - I messed with this as the flicker seemed to happen when I changed the focus - swapping tabs, moving the cursor - which would also change the cursor focus. This didn't seem to have an effect, but I found using "editor.cursorBlinking": "smooth" drops the CPU usage down from about 20% to 8%, and sometimes it's nearly idle with VS Code open.
If you're a perfectionist (like me) and you want to have a standard "app" to open like this (as you may not always be in terminal) you can use this simple AppleScript in Automator:
on run
      do shell script "/usr/local/bin/code --disable-gpu-memory-buffer-compositor-resources"
end run
Save as an application (yourapp.app).
If you want to get even pickier (like me) you can find the VS Code app in your Applications folder -> Get Info and click the icon at the top left -> Cmd+C then do the same on yourapp.app and Cmd+D and now it loosk like VS Code proper.
Hope that helps until they fix this.
methodbox
on 10 Apr 2018
I tried --disable-gpu-memory-buffer-compositor-resources, it does get rid of the flickering, but the UI just hangs.
VSCode 1.22.1 is mostly unusable at the moment for me with a 4k display in HighDpi mode. The only way to use it is to run the display in it's native resolution (which is a pita, but not yet enough reason to switch to Qt Creator).
teki
on 12 Apr 2018
Had previously experienced the flickering but it resolved itself with an update. Now the flickering is back.
OS: macOS 10.13.4
VSCode: 1.22.2
All while using HiDPI display connected to my mid-2015 15" MBP with AMD Radeon R9 M370X graphics card. As @teki mentioned, only work around that I've had success with is running in native resolution.
 jlmaners
on 14 Apr 2018
jlmaners
on 14 Apr 2018
@jlmaners
I don’t believe this is likely GPU-specific. I’m on a 2016 MBP with an AMD GPU but others with Nvidia have experienced the same issue.
It’s an issue that is essentially the same as one that plagued Atom (also built in Electron).
I would take a look at my post and the link to Chrome switches - there’s many related to GPU.
If one or the other doesn’t do the trick (or multiple together) I’d be very surprised.
If this were a driver issue there would be more pixel drawing on the screen that is affected than just VS Code (like the OS background) - you’ll notice in all examples there isn’t.
This means the rendering/drawing latency is isolated to the VS Code instance and has something to do with how it’s talking to the GPU (which is why I started with a buffer setting).
methodbox
on 15 Apr 2018
I've run into this on a mac as well. None of the gpu flags I tried made any difference, but the window size did - anytime the window was over a certain size the problem showed up. That size was about 1/3 of the viewable area of the monitor.
The problem only shows up for me when the view is split for viewing files side-by-side. Disabling scaling on the monitor made the problem disappear completely. This monitor is 3840x2160. The scaling option is set to, "looks like 3008x1692". It seems to be total window area that triggers the problem, not just a window taller or wider than some limit.
 trapgate
on 16 Apr 2018
trapgate
on 16 Apr 2018
The original chrome bug is about running out of GPU memory (they seem to have a hard coded limit): https://bugs.chromium.org/p/chromium/issues/detail?id=695427
teki
on 17 Apr 2018
Changing the buffer size (or disabling it) should free up real time available memory, so maybe that’s why it worked for me but I’d also expect there to be some serious fan action if the 4GB of GPU memory were maxed - not the case.
There are also a number of flags related to CPU and software rendering - can you guys play with these and see what happens?
methodbox
on 17 Apr 2018
Might want to look at —device-scale-factor.
Since all of these potentially set a value which also affects processes down the line it’s likely one of those.
There’s a number of raterization flags re: CPU vs. GPU.
methodbox
on 17 Apr 2018
From a previous Electron bug that was “fixed”:
--high-dpi-support=1 --force-device-scale-factor=1
Source: https://github.com/electron/electron/issues/6571
Based on comments appears this may be something that could be configured in the User Settings file in vscode, too.
methodbox
on 17 Apr 2018
"editor.disableTranslate3d": true
https://github.com/Microsoft/vscode/issues/25934
Grasping at straws here, but safe to say this is something that is fixed in Electron and Chrome for a while but somehow that fix is not backported into VS Code.
methodbox
on 17 Apr 2018
I already had "editor.disableTranslate3d": true.
--high-dpi-support=1 --force-device-scale-factor=1 might work, but it is not something that you want to look at.
--high-dpi-support=1 alone works and seems to be an acceptable workaround, it slows the UI down, but bearable.
teki
on 17 Apr 2018
It may slow the UI down, but that’s a boolean that should probably be part of VS Code settings.
It’s enabled for Atom by default without noticeable UI issues.
I’m really starting to think that this is a VS Code-specific issue with their Electron config.
methodbox
on 17 Apr 2018
Please – bumping for attention on this issue. I will try --hi-dpi-support=1 today, but I am near certain this is a VSCode issue as other Electron apps do not suffer in the same manner.
 drewlustro
on 23 May 2018
drewlustro
on 23 May 2018
On my setup, with vscode 1.23 (Insiders edition), passing --disable-gpu-blacklist fixed the issue once and for all.
Platform: Linux
OS: Ubuntu 16.04
GPU: Radeon RX 550 2GiB
 vgeddes
on 23 May 2018
vgeddes
on 23 May 2018
FYI There are also bleeding edge "exploration" builds available - these use Electron 2.0 and a newer Chrome: https://github.com/Microsoft/vscode/issues/45542
I'm now using the exploration build together with --disable-gpu-blacklist for a flicker and artifact free experience.
vgeddes
on 31 May 2018
No, this is definitely a VS Code issue, I think @vgeddes and others' testing shows that. Now we just need to probably wait for the next build that they backport the Electron fixes.
methodbox
on 31 May 2018
It's back since the latest update,
 masonk
on 3 Jun 2018
masonk
on 3 Jun 2018
I just tested as I was having a syntax issue which turned out to be unrelated, but this issue is still occurring.
This is my solution for now (from my comment on Apr 9 above):
If you're a perfectionist (like me) and you want to have a standard "app" to open like this (as you may not always be in terminal) you can use this simple AppleScript in Automator:
on run do shell script "/usr/local/bin/code --disable-gpu-memory-buffer-compositor-resources" end run
Save as an application (yourapp.app).
If you want to get even pickier (like me) you can find the VS Code app in your Applications folder -> Get Info and click the icon at the top left -> Cmd+C then do the same on yourapp.app and Cmd+D and now it loosk like VS Code proper.
Hope that helps until they fix this.
Edit: I realized a lot of people may want to make this effective for calling $ code from the terminal.
You can update your .bash_profile to do this.
#first create bash script that can handle the arguments for you
# **double-quotes** are important
# make sure to copy the '#!/bin/bash' - that's not a comment.
$ vi ~/opencode.sh
#!/bin/bash
opencode="code $1 --args --disable-gpu-memory-buffer-compositor-resources"
$opencode
:wq!
$ chmod +x ~/opencode.sh
# add this to the end or with your other aliases - the **single-quotes** are important
$ vi ~/.bash_profile
alias code='~/opencode.sh'
EDIT: updated because original code didn't work right.
methodbox
on 26 Jun 2018
I'm trying the --disable-gpu-memory-=buffer-compositor-resources advice now.
My issue is slightly reversed. I have a shiny new Dell Precision 5520 with a 4k display, and I'm using two older external monitors that aren't. Flickering and randomly crashing are par for the course. Most frustrating is when my integrated terminal window doesn't repaint, and I have to drag the size up or down to get it back. Eventually anything I mouse over flickers, and I have to restart. Also, I have to turn off the laptop monitor, or system resources go haywire while Code is open. That's probably another issue entirely.
I've ordered a pair of 43" 4K monitors from LG. My thinking is that if I remove scaling, this issue will go away. It works perfectly without the external monitors. After reading this newest set of issues, I'm not sure that will solve the problem.
Arch Linux: 4.14.51-1-lts
i3wm
Edit: --disable-gpu-memory-buffer-compositor-resources does not resolve this issue for me.
 wolfhoundjesse
on 27 Jun 2018
wolfhoundjesse
on 27 Jun 2018
@wolfhoundjesse
Unless you’re using a macOS GPU driver and API or an AMD GPU in Arch, I’d suspect not.
There are a number of other GPU flags that might help. I provided a link much earlier in the thread.
methodbox
on 27 Jun 2018
I experience this problem on Windows, so I don't think the drivers are that
important.
On Wed, Jun 27, 2018, 3:58 PM Methodbox.io notifications@github.com wrote:
@wolfhoundjesse https://github.com/wolfhoundjesse
Unless you’re using a macOS GPU driver and API in Arch, I’d suspect not.
There are a number of other GPU flags that might help. I provided a link
much earlier in the thread.—
You are receiving this because you were mentioned.
Reply to this email directly, view it on GitHub
https://github.com/Microsoft/vscode/issues/45492#issuecomment-400809544,
or mute the thread
https://github.com/notifications/unsubscribe-auth/ABZ-WaMZRR5je0LEhRv7DNXaLO6oJwEjks5uA-P1gaJpZM4Sle38
.
mix3d
on 28 Jun 2018
@mix3d
Are you also using an AMD GPU? My MBP has the AMD 550. It seems most everyone in this thread is using AMD.
There must be something in common.
methodbox
on 28 Jun 2018
Intel HD 620. Lenovo X1 yoga laptop.
mix3d
on 28 Jun 2018
Ran into this with the latest version. Seems that --high-dpi-support=1 now seems to solve it for me, which is weird because it didn't previously.
methodbox
on 30 Jun 2018
I have the opposite experience with --high-dpi-support=1, it used to work, now the glitches are back with 1.24.1. --disable-gpu does not do anything either.
macOS 10.13.5 (MacBook Pro 15 mid 2015), Intel Iris Pro GPU, 4k external display.
teki
on 2 Jul 2018
Managed to get it into usable shape with enabling reduce motion: https://support.apple.com/kb/PH25204
My guess is that Chrome is still running out of GPU memory.
teki
on 2 Jul 2018
I see something similar but just when in the terminal view (see below), using insiders version 1.25 on ubuntu 18.04.
the terminal window, is sitting over the explorer, I have the exact same version on a 16.04 and this isn't an issue, I guess it may have something to do with monitor size (18.04 on 27" screens 16.04 on 22" screens) neither screens are 4k (as far I can tell).
 DuncanFaulkner
on 5 Jul 2018
DuncanFaulkner
on 5 Jul 2018
@DuncanFaulkner I think that's https://github.com/Microsoft/vscode/issues/51479
Tyriar
on 6 Jul 2018
@Tyriar OK thanks will take a look
DuncanFaulkner
on 6 Jul 2018
I found using a DisplayPort cable instead of an HDMI cable solved this for me. Worth trying if you have the means.. 🙏
 ashmckenzie
on 31 Aug 2018
ashmckenzie
on 31 Aug 2018
@ashmckenzie DisplayPort has significantly higher bandwidth. If you’re using anything 2K or higher for your resolution and want 60Hz or better refresh rate (and you do ;)) then yeah, you want DP.
I on the other hand have been using a LG USB-C monitor at 4K 60Hz. DisplayPort is run over USB-C in this case.
I can try my USB-C to DP cable but then I don’t get the benefits of USB-C with even higher bandwidth and simultaneously charging my Mac.
I doubt that is the solution for most, and not for me as there is no technical benefit.
But I’m willing to swap out a cable for troubleshooting purposes.
It’s possible the GPU handles your HDMI port bus differently than the DP port bus, or that you simply were not getting the full benefits of your monitor and GPU with HDMI.
methodbox
on 31 Aug 2018
I'm running my monitors on DP, so it's certainly not that. This is an Electron issue through and through.
BytewaveMLP
on 31 Aug 2018
Similar to @BytewaveMLP, I am using DisplayPort exclusively. Beyond VSCode, I also experience similar flickering in Discord desktop, though I am running in Arch with a RX580, whereas it seems that most users here are using Macs. Definitely appears to be an Electron issue.
What is interesting is both issues tend to occur only after a period of some hours once the --ignore-gpu-blacklist flag is passed. VSCode commonly crashes after this period, whereas Discord starts flickering when it otherwise didn't.
 agg23
on 31 Aug 2018
agg23
on 31 Aug 2018
We are building exploration builds that use a much newer version of Electron (our UI framework). I wonder if this issue reproduces with one of these builds, could you try? Download:
bpasero
on 3 Sep 2018
@bpasero Thanks! I will try this later today and report back.
methodbox
on 3 Sep 2018
@bpasero Exploration build is butter smooth with no extra flags. Interestingly, the flickering on mainline Code appears to be reduced in more recent versions without --ignore-gpu-blacklist, but the performance is still just gone.
I dare say, though, that the exploration build is the smoothest Code experience I've seen in a while. Even with all extensions disabled on mainline and with GPU acceleration force-enabled, there's still some noticeable stutter in places (such as terminal refreshing on fast-printing commands like hexdump -C /dev/urandom), and in general it seems to handle comfortably faster. When are we getting this upgraded Electron on stable? :smiley:
BytewaveMLP
on 3 Sep 2018
Sadly confirm the similar issues. Unfortunately, reproducible for both UHD and HD monitors.
I have encountered this myself 1st time after updating VC from ver. 1.25 to recent 1.27 on Ubuntu 17.10 (run over XRDP from Xeon Server on HP laptop). However, one of my colleagues was reporting this for VC versions earlier than 1.25. In the latter case this was also U17 but run in VBox on W7 HP laptop.
In my case, 1st of all I tried reinstalling VC packages. This allowed to forget about the issue for about 1 week. After the issues got back, neither the packages reinstall, nor updates (nor re-copy of RDP fixing packages [https://github.com/Microsoft/vscode/issues/3451]) helped.
On the other hand, I noticed that the VCode-Insiders didn't have that issue (at least at the moment). I guessed this is caused (in addition to visual perception of what was happening on the screen, where some strange background color rectangular blocks started to appear randomly overlapping [covering, cleaning out] the code window text) by some bug with mouse hover hints pop-ups. I increased the code hints popup delay time and then switched that off completely (although, didn't find how to do the same for full file names pop-ups that appear when mouseovering on top of the file-names shown e.g. in the file list of file browser area or on the top bar of open files tabs). The luck of the VCode-Insiders in this sense seemed to be in the inability to find proper inclusions, so VCode-Insiders wasn't able to show any hint for the code, and hence, no mouseover popups.
Sadly, but disabling the hint popups didn't help the VC. After sometime (even without any mouse moves or visible origin for doing mouse hover triggered actions), the same random background color overlapping rectangles started emerging randomly again, so messing up all the text in the code window (up to 80%).
It doesn't look useful to provide any static screenshots. The videos of what happens might be more useful, if there is no guess from VC developers where the issue might come from..
Just let me know, whether it's needed then. I can shoot the video and post here.
So far, crossing my fingers with hope the VCode-Insiders could work. Otherwise, i'm completely blocked with VC usage for my project development..
 Ts-OV
on 7 Sep 2018
Ts-OV
on 7 Sep 2018
Ok. After sometime (probably allowing the corresponding spare processes spoiling text window to finalize), deprecation of mouse over popups really helped.
Next day I tried VC, there were just some VC "nervous" attempts to redraw with background color some several lines below one I was editing at the moment, but then it was able to recover the code text back quite fast.
Only once it showed up with the origin of what probably was causing that.
I seems, there were VC attempts to show some strange typed code context helper popup. But the info on that popup helper was completely illogical and inconsistent! E.g. it was popping up after typing colon symbol in the double slash comment line. Why the heck? What it was supposed to refer to?

Is it a bug?
Are those popups the real cause for messing up the text on the open windows in VC?
Can you please give us a hint which of those can be disabled in VC (in addition to already mentioned found mouse hover related)?
Ts-OV
on 8 Sep 2018
That's how it looks like with no popups blocked:

Ts-OV
on 8 Sep 2018
Also, as the bug description implies, switching VC from full screen mode to windowed of smaller size on UHD monitors seems like allows decreasing the number of residual aftereffects of the mentioned graphics redraw issues.
Ts-OV
on 10 Sep 2018
We are building exploration builds that use a much newer version of Electron (our UI framework). I wonder if this issue reproduces with one of these builds, could you try? Download:
bpasero
on 10 Sep 2018
Ok. After waiting for MS IntelliSense to setup (in order to be able showing mouseover popup hints), it looks like I do not see the graphics issues (Linux U17, XRDP) in the corresponding package after playing a little.
Ts-OV
on 12 Sep 2018
@Ts-OV Can you clarify what you meant by “waiting for MS Intellisense to setup”?
Intellisense is built-in to some extent but there are also extensions to add to this.
Are you using an additional extension for this? Or did you have it disabled previously?
I’m not sure your issue is the same as the rest of us, as per previous posts this hasn’t been inherently tied to Intellisense in any way.
methodbox
on 12 Sep 2018
What I meant previously, is VC standard extension (offered automatically by VC to be installed based on C++ project I work currently with):
"
C/C++ | ms-vscode.cpptools | Microsoft
C/C++ IntelliSense, debugging, and code browsing.
"
In addition to the extension standard installation, VC restarting, etc. more or less quick done actions, it needed much more time to build up its some internal (search indexer, etc.) database in order to be able finding the proper sources (includes) fast, to show then the hints for function declared either by mouseover or when intentionally clicked (from right-click menu) "Go to Definition/Declaration".
Until this DB is built, the hints cannot be shown, so there is no normally heavy graphics redraw load when moving mouse over code (no mouseover based popups) and typing at the same time (that also initiates some additional helper popups).
Although, there is no extra graphics redraw load from nonsense typing actions anymore (like for instance, the mentioned previously irrelevant popup when typing colon symbol in double slash commented out line). As well as, I didn't see yet redraws pushed due to some accidental VC IDE decision to apply different code dimming after building up internally another preprocessor _#ifdef .._ logic understanding.
However, I have seen shortly some new glitch where inclusion selection frame (shown by "Go to Definition/Declaration") stayed after its intentional closing, but text changed to normal view. (Didn't manage to make a screenshot).
Ts-OV
on 12 Sep 2018
@rightaway I'm still seeing this on Ubuntu with i3wm.
It seems to be caused when ever there are splits showing (which the diff has). One way around this (for me at least) is to pass the --disable-gpu-blacklist flag when I start code
 limptwiglet
on 24 Sep 2018
limptwiglet
on 24 Sep 2018
@bpasero
I have had the same issue with just a 1920x1080 monitor in ubuntu. The option C_Cpp.dimInactiveRegions turns the entire screen to empty blocks if any large sections of code are dimmed. It looks very similar to the picture from @Ts-OV and even ends up misdrawing the left side panel. I also needed to set the terminal renderer to dom in order for it to be responsive.
However, with the exploration version that was posted a couple weeks ago, those issues appear to be gone. There aren't any empty blocks and the terminal updates very quickly with the default renderer.
 jovere
on 27 Sep 2018
jovere
on 27 Sep 2018
Affected as well, but this happened after updating nvidia driver (Debian Buster, GTX 1070). Not sure what is the problem, but it means that VSCode is unusable to me. I tried --disable-gpu parameter, but with no luck.
 kobalicek
on 29 Sep 2018
kobalicek
on 29 Sep 2018
@kobalicek
I tried
--disable-gpuparameter, but with no luck.
Did you also try --ignore-gpu-blacklist? This at least mostly fixed the issue for me (not entirely, but it's at least usable now).
BytewaveMLP
on 29 Sep 2018
I was only lucky with --disable-gpu --force-cpu-draw arguments. It seems that --disable-gpu is not enough. This is definitely Blink or SKIA issue, VSCode is just a victim in this case :)
kobalicek
on 30 Sep 2018
@bpasero Thank you for your comments! I have cloned the repo and checked out branch electron-4.0.x. That build actually works beautifully for me. No more flickering at all. Can you tell me, how old/stable is this branch? Does it ever get updated? Would I better off using electron-3.0.x? Thank you.
 abtrumpet
on 15 Nov 2018
abtrumpet
on 15 Nov 2018
Latest build seems to be working well for me too. Have not noticed paint issues in a while. I tried the new TypedArray for the console, but had a crash or two so I disabled it.
mix3d
on 15 Nov 2018
We will not jump from Electron 2.0.x to 4.0.x. Currently we think about shipping 3.0.x in Q1 2019 which means Electron 4.0.x would be somewhere Q2 2019 (just guessing).
bpasero
on 18 Nov 2018
Ok, thanks. I will try the electron-3.0.x branch and see how it goes. It generally manages to run better, but I was having issues with it occasionally freezing. Such is the life of HiDPI laptop owner :)
abtrumpet
on 19 Nov 2018
l am on ArchLinux with a dual-graphics laptop (Intel & Nvidia GTX950M). When I run it with just code, it has the repaint issue but when I render on the Nvidia card with primusrun code, the repaint issue seems to be diminished/eliminated. That's using the Bumblebee daemon, of course. So, I'm not entirely sure of the situation that causes this issue.
abtrumpet
on 24 Nov 2018
Closing this issue given that we plan to release VSCode stable early February with Electron 3.x. If you want to benefit from the fix already, consider to use our insiders version that already contains the fix: https://code.visualstudio.com/insiders/
bpasero
on 25 Jan 2019
As of this writing, I'm using the latest version of the Insiders build on a MacBook Pro (15-inch, Radeon Pro 560X 4096 MB) + OS X 10.14.1 + Dell P2415Q (DisplayPort / MST Off / 3840x2160 @ 60Hz) and find that the issue still occurs on the external display.
After some additional troubleshooting, I determined that in my case the cause seems to be related to adjusting the Resolution to Scaled in the OS X Display Preference pane. With scaling disabled, I don't encounter the issue.
Note that using a third-party display resolution tool, SwitchResX, seems to allow me to adjust resolution while at the same time avoiding the VSC flicker.
This may prove applicable for some.
 cscomfort
on 20 Feb 2019
cscomfort
on 20 Feb 2019
@cscomfort I have similar issues, reported as a new issue: https://github.com/Microsoft/vscode/issues/68188
teki
on 21 Feb 2019
Related issues
 trstringer
·
3Comments
trstringer
·
3Comments
 sirius1024
·
3Comments
sirius1024
·
3Comments
 philipgiuliani
·
3Comments
philipgiuliani
·
3Comments
 VitorLuizC
·
3Comments
VitorLuizC
·
3Comments
 sijad
·
3Comments
sijad
·
3Comments
Most helpful comment
This might workaround the problem: