Vscode: Enable Chrome debugger to ship with VS Code
This issue covers the steps we need to take to bundle the https://github.com/Microsoft/vscode-chrome-debug within the standard distro of VS Code.
Purpose
The Chrome debugger remains one of our most popular debuggers, and with the upcoming release of multiple connections in Chrome 63, plus the upcoming support for break-on-load breakpoints, we think the debugging experience is good enougt to ship out of the box.
Questions
How do we update the Chrome debugger out of band?
The Chrome debugger has a history of smaller and faster releases than the Node debugger, so I imagine we would need to keep it that way.
I had a chat with @seanmcbreen and he mentioned that we can't update bundled extensions out of band. Is this still true?
Do we have other concerns that's product related to bundling the Chrome debugger?
Ping @roblourens @weinand @seanmcbreen @chrisdias
 auchenberg
All 34 comments
The Chrome debugger has a history of smaller and faster releases than the Node debugger, so I imagine we would need to keep it that way.
Not sure about this, nothing else in vscode updates out of band, and I think vscode builtins should only update along with vscode itself. In the past I've updated whenever a few fixes pile up, but I don't think we would miss much by updating at the same rate as the node debugger alongside vscode updates.
Do we have other concerns that's product related to bundling the Chrome debugger?
node-debug2 ships 3.6 MB including 2.8 MB of node_modules. If we ship another extension the same way, there will be a lot of waste- 99% of this will be shared with chrome-debug.
The VS team really wanted us to put both in a single repo. I don't really want to go that route because it's useful to keep them separate for issue tracking and support.
 roblourens
on 19 Oct 2017
roblourens
on 19 Oct 2017
fyi @microsoft/vscode
For me the main question is how do we decide that some extensions should be a part of vscode and some should not? I personally like VSCode being minimalistic and I think we should only bundle extensions which would benefit a significant chunk of our users.
IMHO chrome debugger would only be used by less than 5% of our users (telemetry experts: please dig up event debugSessionStart with type: chrome to support my claim). I understand that we can say that node debugger also benefits only a small number of users but node debugger for me is more like a built-in example that demonstrates how debugging is great.
As from the microsoft point of view should we not bundle an edge debugger?
On the other hand I understand that chrome debugging would be easier and nicer out of the box, but for me the minimilstic VSCode is clearly the way to go here.
Just because an extension is good does not mean we should ship with it, but maybe market it better on the site, using recommendations, somehow in the extnesions viewlet and so on.
 isidorn
on 19 Oct 2017
isidorn
on 19 Oct 2017
+1 for Rob's comment from above about updating VS Code's builtins only once a month.
If there is an urgent need for an out-of-band update, we always have the Insiders release.
Should the Chrome debugger be builtin?
Yes, because we ship all extensions that are useful for VS Code extension authors and JavaScript development. Excluding the Chrome debugger is like excluding TypeScript support.
(But I think it would be helpful if we you could easily share common node_modules between the debuggers and keep VS Code's size small...)
 weinand
on 19 Oct 2017
weinand
on 19 Oct 2017
I had a chat with @seanmcbreen and he mentioned that we can't update bundled extensions out of band. Is this still true?
I'm pretty sure this isn't true anymore. I remember talking to @weinand about this scenario. If any of the node-debug extensions come out with a bug, it should be easy for him to just publish the new version in the marketplace and have users update to that.
This makes me thing an installed extension in the user's extensions folder will override a built-in extension with the same name. But @sandy081 will know for sure.
 joaomoreno
on 19 Oct 2017
joaomoreno
on 19 Oct 2017
(telemetry experts: please dig up event debugSessionStart with type: chrome to support my claim)
I see chrome getting around 1/3 of the machines/day of node+node2. It has picked up the past couple months. I'm very curious where that would go with a little extra publicity and building it in.
As from the microsoft point of view should we not bundle an edge debugger?
This will be possible in the near future but if we include chrome-debug we should think about how it will scale to other browsers, for naming things, etc.
roblourens
on 19 Oct 2017
(telemetry experts: please dig up event debugSessionStart with type: chrome to support my claim)
About 13% of users who ever started a debug session in the past 30 days used the "chrome" type
 ramya-rao-a
on 19 Oct 2017
ramya-rao-a
on 19 Oct 2017
@isidorn The reasoning for shipping a "browser debugger" in-product is that we have expanded our beachhead segment from "Node developers" to "JavaScript developers" and want to provide an out of box experience that enables debugging of both servers and clients.
Long term I imagine us having a "browser debugging story" where Chrome, Edge, Firefox and others fit into the puzzle. We are in-parallel are having conversations with browser vendors on using the same remote debugging protocol that will enable the core of Chrome debugger to work with fx Edge.
auchenberg
on 19 Oct 2017
@auchenberg while I agree with your sentiment -- is the current browser debugging story currently robust enough? Personally very often when I've tried to take advantage of the chrome debugging in product, it falls down -- mainly with breakpoints not being hit and I need to fall back to debug within chrome itself. Granted we are using webpack hot-reload with source maps, but it almost always works in chrome, but very rarely in vscode.
 eamodio
on 19 Oct 2017
eamodio
on 19 Oct 2017
@eamodio I believe we have a good enough experience, when the two previously mentioned features land for the majority of our Chrome debugger users (based the flow of issues and user feedback, and the work we have been doing with framework clis)
auchenberg
on 19 Oct 2017
@auchenberg I should have read those features more closely -- the multiple connections will be HUGE (next you just need a sync of breakpoints to seamlessly switch between the two 😉). And with any luck break-on-load work will resolve our BP issues. Thanks!
eamodio
on 19 Oct 2017
This makes me thing an installed extension in the user's extensions folder will override a built-in extension with the same name. But @sandy081 will know for sure.
Yes, installed extension will override the built-in with same pub.name
 sandy081
on 20 Oct 2017
sandy081
on 20 Oct 2017
My only concern is by including more extensions that may push out start up performance further as it needs to register commands at which point all the extension code is loaded in (even if no activation events fire). I know it's not much but it all adds up.
 Tyriar
on 20 Oct 2017
Tyriar
on 20 Oct 2017
@Tyriar Valid concern. Do we know how much overhead it adds? The Chrome debugger looks to register 2 command and our Node debugger does the same.
auchenberg
on 20 Oct 2017
@auchenberg actually I think it probably has minimal impact thinking about it again, the load time of 149ms below:
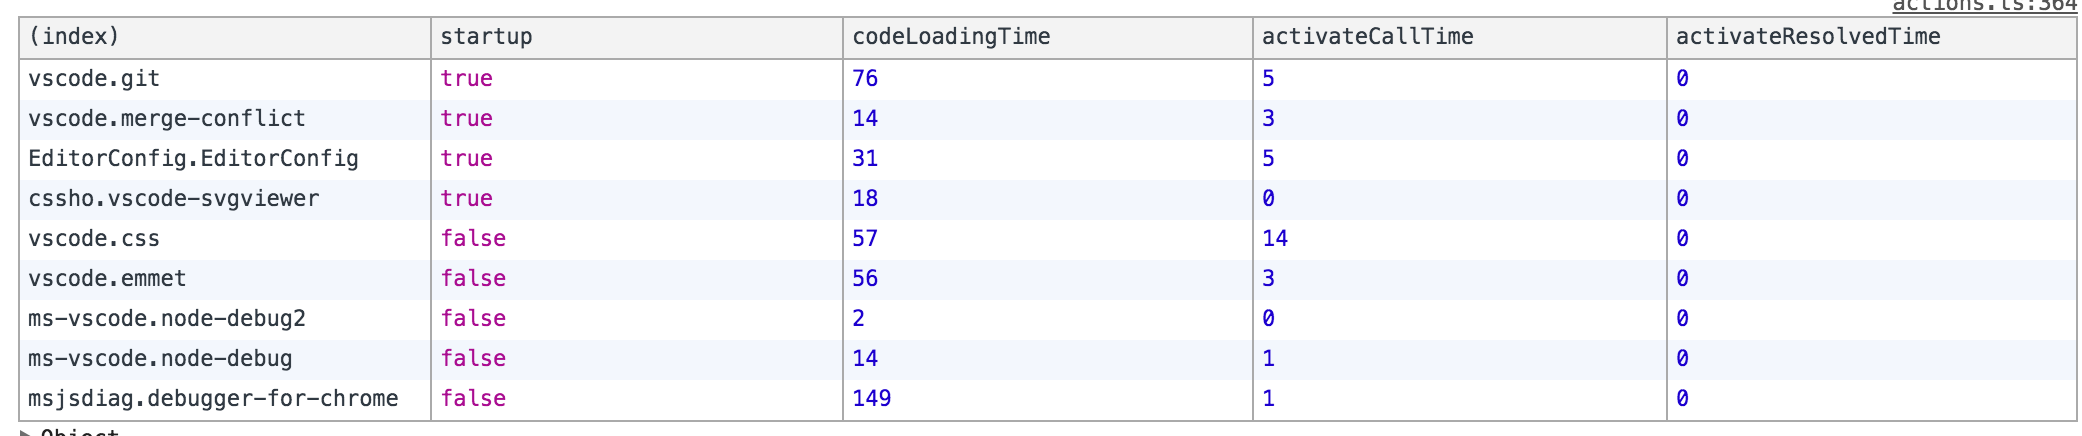
is on the extension host process, so it should have minimal impact on performance unless the system only has a single core.
Tyriar
on 21 Oct 2017
Why is it so much slower than node/node2?
roblourens
on 21 Oct 2017
So to summarize:
- We can ship the Chrome Debugger as built-in just like the Node debugger.
- We have a concern of shipping both Node and Chrome will increase the footprint with roughly 2.8 MB of duplicated node_modules. Can we live with this, @weinand @roblourens?
- We don't have a concern of the perf overhead registering 2 additional commands will have to extension host process. @Tyriar
Actions
1) What are the next steps for including the Chrome debugger in upcoming builds, @roblourens?
auchenberg
on 24 Oct 2017
- 2.8 MB seems like a lot, especially when it's all duplicated code from node2. Unfortunately I think we couldn't reduce it without restructuring the debug adapters to cohabitate one extension, or doing some weird stuff to make them share files. I don't know whether 2.8 MB is a deal breaker or not.
roblourens
on 24 Oct 2017
@roblourens with "restructuring the debug adapters to cohabitate one extension" you mean to move the common node_modules (e.g. cdp-core) into a new "faceless" extension that becomes the prereq for the chrome and node2 extensions?
I think 2.8 MB is not a deal-breaker but if we could share code via a code-extension easily, we should try that.
weinand
on 24 Oct 2017
Right I mean they would have to go in the same repo and be published as a single extension, which I don't really want to do.
roblourens
on 24 Oct 2017
I thought you meant using 3 extensions (and 3 corresponding repos):
- a faceless extension "cdp-core" that contains just the cdp-core library,
- node-debug2 (which depends on cdp-core),
- chrome-debug (depending on cdp-core too)
weinand
on 24 Oct 2017
I guess I don't understand what you mean by "faceless extension", cdp-core wouldn't do anything by itself and can't really run as an extension.
roblourens
on 24 Oct 2017
The third extension is just a container for cdp-core and would export the cdp-core API so that node2 and chrome could use it. There is extension API to access the API of other extensions.
I can explore the details of how this would work.
weinand
on 25 Oct 2017
I think cdp-core would currently show up in the Installed extensions in the viewlet. Was 2.8MB the increase in download size? It should compress fairly well if it's all duplicated data. :D
 chrmarti
on 25 Oct 2017
chrmarti
on 25 Oct 2017
True! That's the size on disk.
@weinand I know that extensions can call commands on other extensions, but I don't know if that's the right model for debug adapter extensions. -core exports a class which the adapters subclass, and there are lots of references back and forth at runtime. So this would be like a "code library extension".
roblourens
on 25 Oct 2017
@auchenberg I did not really get a feeling that we came to a concensus regarding this discussion and in the planning meeting it seems that we have reached a decision to ship the chrome debugger with vscode. I personally found this a bit surprising.
In zurich we had a discussion regarding this and the overall impression that I got was not to ship the chrome debugger with VSCode. Some points were made that if we do this we could use the same logic to also ship with tslint, eslint and many other extensions. Though I might be missing something here so please correct me if I am wrong.
isidorn
on 14 Nov 2017
@isidorn It's new to me that you have had a discussion in Zurich about this, as my take away from this thread is support by @weinand, @roblourens, plus that we have had several discussions on the PM side in Redmond.
Generally we have expanded our beachhead segment from Node.js to JavaScript, which will require us to ship the necessary components to support client-side JavaScript. This is reflected in our roadmap, where we mention shipping client-side debugging in-box, and the first step on this journey is to include the Chrome debugger.
The arguments from https://github.com/Microsoft/vscode/issues/36517#issuecomment-337994927 still stands, and is well-aligned with our parallel efforts on enabling Edge + Firefox debugging from the Chrome debugger, as those browsers will embrace the Chrome DevTools protocol in the near future. This will allow us to expand the VS Code story from "Chrome debugging" to full "client side browser debugging", and that's the framing we'll plan to go with, where Chrome debugging is our starting point.
What's your concerns for going down this route @isidorn? That we'll introduce a lot of scope creep to support all possible scenarios for JavaScript?
auchenberg
on 14 Nov 2017
@auchenberg Sorry for not informing you about our discussion. I should have updated this issue sooner.
I understand that we want to expanded to JavaScript however we could use exactly the same argument for shipping eslint and tslint extension. Since they are also necessary components to support client-side JavaScript. Also tslint end eslint are used by many more users imho so they might make more sense to be the first step.
As for my concerns I have mentioned them in my original comment.
Apart from those every time we bundle a new extension we:
- loose the ability to update that extension out of our vscode rhythm
- bundling extensions makes our build a bit slower as we have to always download the extension from azure - this is particularly true when building locally
- we will get more issues in our vscode git hub repository
- increasing install size
- lots of users not caring about the extension still get it and have no way to disable it
Once Edge and Firefox debugging embrace the Chrome DevTools protocol then it makes sense to ship with this since it would be more of a "Browser Debugger". Until then it is just marketing a product done by Google imho.
Bottom line it seems like I am the only one strongly against this so I just wanted to raise my concerns and I understand if the PM decision is to still do this.
isidorn
on 14 Nov 2017
@auchenberg yes, we had a discussion in Zurich and I'm supporting to bundle the Chrome Debugger with VS Code.
Besides all the other arguments mentioned here the most important argument for me is to ship VS Code with the inner-loop tools that we need for VS Code development (I would even support to include eslint and tslint but maybe they are a bit on the edge).
Including the Chrome Debugger fosters more self hosting on the VS Code debuggers. Today most VS Code devs are not self-hosting on the VS Code debugger but use the Chrome Dev Tools instead. Only those developers that work on extensions typically use node-debug. This reduces the self-hosting coverage of the debugger considerably (and it sometimes results in errors not detected early in self-hosting). Bundling the Chrome Debugger with VS Code and baking debug configurations for it into VS Code could alleviate this.
weinand
on 14 Nov 2017
To be honest anyone from the team can install the chrome extension in less than 10 seconds - they are not doing it for other reasons(do not want to go into that since it is another topic). So I would not take this as an argument to bundle it for stable and our 2 million users.
And yes I agree we should self host on the chrome debugger - which I will change for my workflow this very moment.
isidorn
on 14 Nov 2017
@isidorn To my the main difference between adding a chrome/browser debugger and tslint is that debugging is one of the unique differentiating features for VS Code that set's us apart from Sublime and others. We already have a Node debugger built-in, so it's natural progression to add the most popular browser debugger into the product as we expand our focus to full-stack JavaScript. Linting isn't strictly needed for JavaScript authoring.
loose the ability to update that extension out of our vscode rhythm
I had this concern too, but was addressed earlier in the thread.
bundling extensions makes our build a bit slower as we have to always download the extension from azure - this is particularly true when building locally
What do you think the ballpark overhead will be? We don't want to slow down local builds significantly.
we will get more issues in our vscode git hub repository
We already have a steady stream of Node/Chrome issues, and we have educated users to use the vscode repo recently, so I don't expect this to add a massive overhead.
increasing install size
This was also addressed earlier in the thread.
lots of users not caring about the extension still get it and have no way to disable
This extension will be invisible to users who don't use it.
auchenberg
on 15 Nov 2017
The discussion about install size and update frequency that we are having about the Chrome Debug extension is similar to previous discussions about other built-in extensions such as TS, CSS, HTML, or Markdown. With every built-in extension we increase install size and we also increase what we need to test during endgame week and the functional areas we need to consider for recovery builds.
We are bundling built-in extensions at build time. If we allow to install certain extensions either at install time or auto-install them after first startup we can avoid these issues while still getting most of the benefits of built-in extensions. We'll take the Chrome Debug Extension as a concrete example to explore this path. This goes back to discussions @egamma, @seanmcbreen and I had earlier today.
 kieferrm
on 15 Nov 2017
kieferrm
on 15 Nov 2017
I think you should stop adding buildins tools because you have extensions system which can be managed to match a particular development environment.
You could ask or detect a project environment. I mean if the project is a typescript one, then you can load necessary extensions; if the project is a c++ one, then you load only c++ extensions and let user adds its own extensions for this environment.
In typescript environment case, you impose chrome debugger if not present, but the user can remove it if he doesn't want to use it.
From there, this is an additional feature which requires a new environment management tool.
This is just my opinion.
 Alphapage
on 15 Nov 2017
Alphapage
on 15 Nov 2017
I'm ok if the chrome debugger is built-in; however, an effort should be made to revert previous decisions regarding how debuggers are isolated and begin code sharing with other similar debuggers (a good 95% with the NW.js debugger fork for example)
 gwicksted
on 1 Dec 2017
gwicksted
on 1 Dec 2017
Closing this as we concluded that our recommendation system is sufficient to prompt the extension for the relevant front-end users of Code. Shipping it inside the box won't provide a significant opportunity to attract new users.
auchenberg
on 29 Jan 2018
Related issues
 biij5698
·
3Comments
biij5698
·
3Comments
 vsccarl
·
3Comments
vsccarl
·
3Comments
 shanalikhan
·
3Comments
shanalikhan
·
3Comments
 villiv
·
3Comments
villiv
·
3Comments
 trstringer
·
3Comments
trstringer
·
3Comments
Most helpful comment
The discussion about install size and update frequency that we are having about the Chrome Debug extension is similar to previous discussions about other built-in extensions such as TS, CSS, HTML, or Markdown. With every built-in extension we increase install size and we also increase what we need to test during endgame week and the functional areas we need to consider for recovery builds.
We are bundling built-in extensions at build time. If we allow to install certain extensions either at install time or auto-install them after first startup we can avoid these issues while still getting most of the benefits of built-in extensions. We'll take the Chrome Debug Extension as a concrete example to explore this path. This goes back to discussions @egamma, @seanmcbreen and I had earlier today.