Vscode: Enable customers to profile the extension host
From time to time we receive issues about the extension host going mad. When this happens we are blind and are basically asking folks to disable all or _some_ extensions to check if the problem still shows... Instead we should ship the v8-profiler module that allows to create cpu profiles and heap snapshots such that users have something real for us to look at
 jrieken
All 11 comments
Moving this out to October - this will increase our bundle size by at least 2.5MB which isn't very desirable. For October we should pre-compile bits and ship this as extension
jrieken
on 26 Sep 2016
It is very helpful for optimizing hotspot in (slow) extension..!
 ypresto
on 30 Dec 2016
ypresto
on 30 Dec 2016
It's quite unlikely that we will ship the profiler as it is supported right now. The problem is that debugging must start form the inside. This is what we were planning: (1) detect extension host slow, (2) start profiler for a bit. However, since a slow/dead extension cannot process yet another request like 'start profiler' we won't be successful. Later versions of node.js/v8 allow to profile from the outside, without depending on a responsive JS event loop. As soon as that is available to us we will make this happens.
Still, if you want to profile your extensions (or another) you can use the v8-profiler. A version that works with VS Code can be found here: https://github.com/jrieken/v8-profiler
jrieken
on 3 Jan 2017
Anyone was able to run this profiler on Windows?
Can't get this to work:
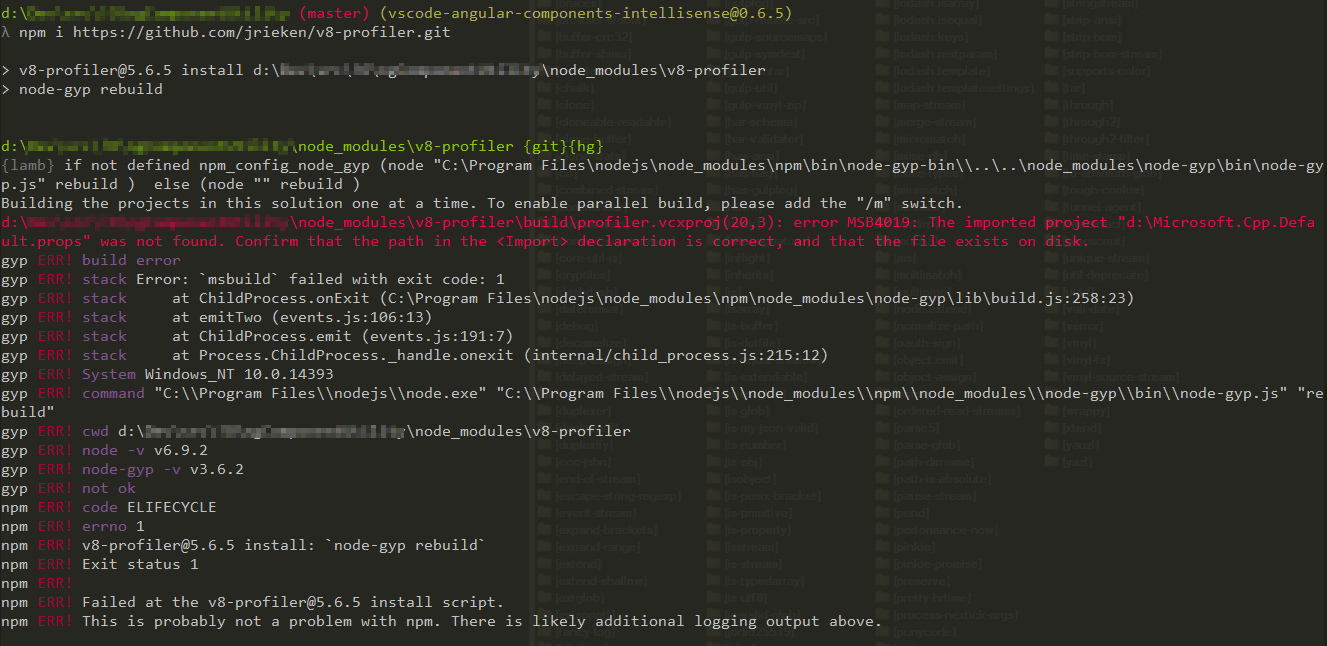
Am I missing something?
Update:
This did the trick regarding all prerequisites. It's better, but still failing:
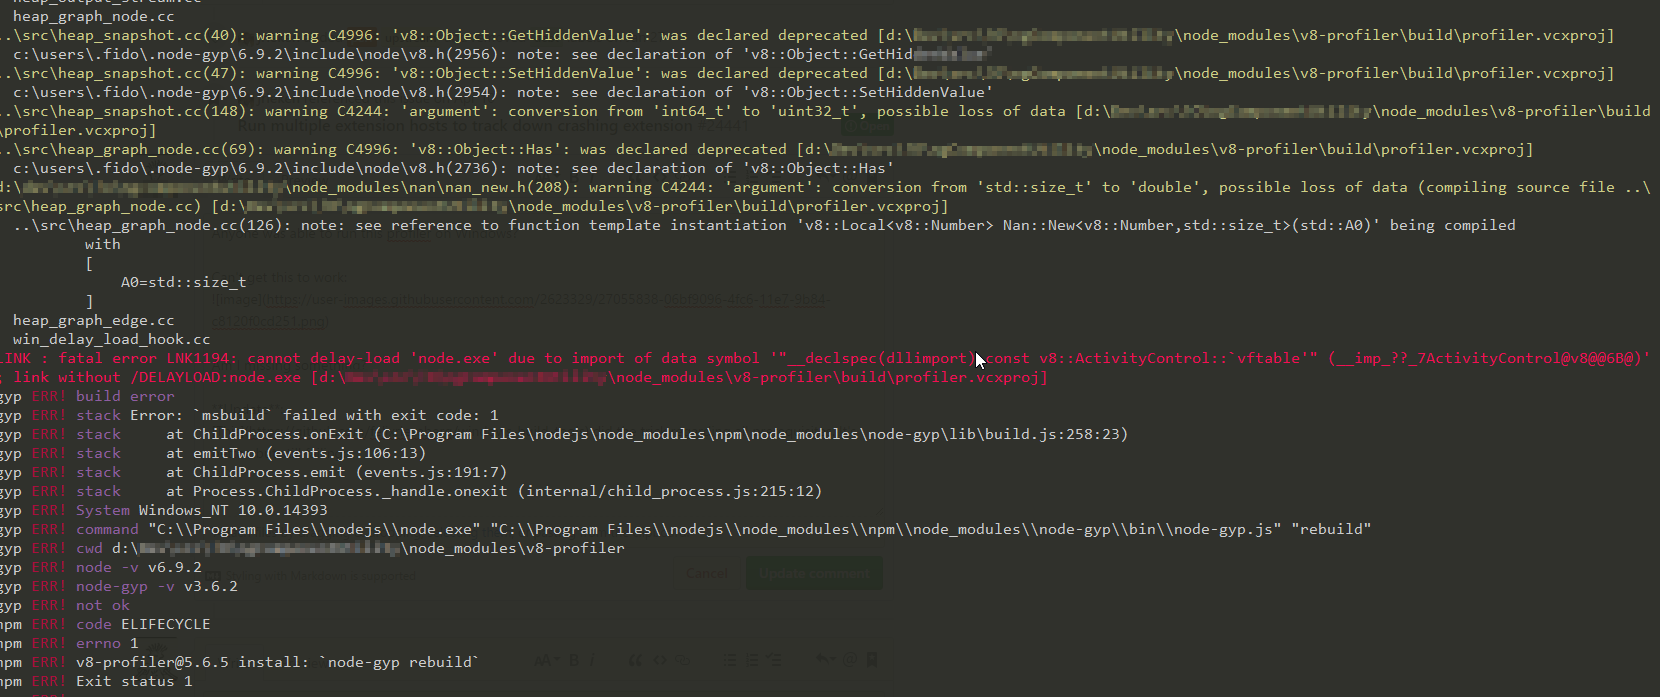
 ipatalas
on 12 Jun 2017
ipatalas
on 12 Jun 2017
With the latest electron update this is now possible. We just need a way to bring the process into debug mode (in which it normally isn't) and then you can connect chrome-dev-tools to them 🎉
jrieken
on 16 Aug 2017
That would be great! I believe a command line switch should be enough for that. Can't wait to be able to profile one of my extensions :)
ipatalas
on 16 Aug 2017
That would be great! I believe a command line switch should be enough for that. Can't wait to be able to profile one of my extensions :)
That's actually already possible. While look for ways to implement this I have found the debugPluginHost-option. Do the following (using Insiders)
- start from the command line like so
vscode-insider --debugPluginHost=5678 - open developer tools and find a message that start with 'Debugger listening on port 5678' and end with a link
- open that link in Chrome
jrieken
on 23 Aug 2017
@jrieken is that documented anywhere with regards to extension development? It would be great if not.
 eamodio
on 23 Aug 2017
eamodio
on 23 Aug 2017
Yeah, we should document it
jrieken
on 23 Aug 2017
The "implementation" of this will be an update of our documentation. I'll post it here to begin with, the it goes via release notes into our docs (fyi @gregvanl)
jrieken
on 28 Aug 2017
- Start VS Code from the command line the with
--inspect-extensions=<port>-flag, e.g.code --inspect-extensions=9333 - In VS Code, hit
F1, typeToggle Developer Tools, hitEnter - Select the Console-tab and find a message that starts with
"Debugger listening on port 9333"and that ends with achrome-devtools-link - Open that link in Chrome for dedicated dev-tools for the extension host
- Use the CPU and Memory profiler to understand how memory and compute is being used


jrieken
on 28 Aug 2017
Related issues
 sirius1024
·
3Comments
sirius1024
·
3Comments
 trstringer
·
3Comments
trstringer
·
3Comments
 ryan-wong
·
3Comments
trstringer
·
3Comments
ryan-wong
·
3Comments
trstringer
·
3Comments
 shanalikhan
·
3Comments
shanalikhan
·
3Comments
Most helpful comment
Yeah, we should document it