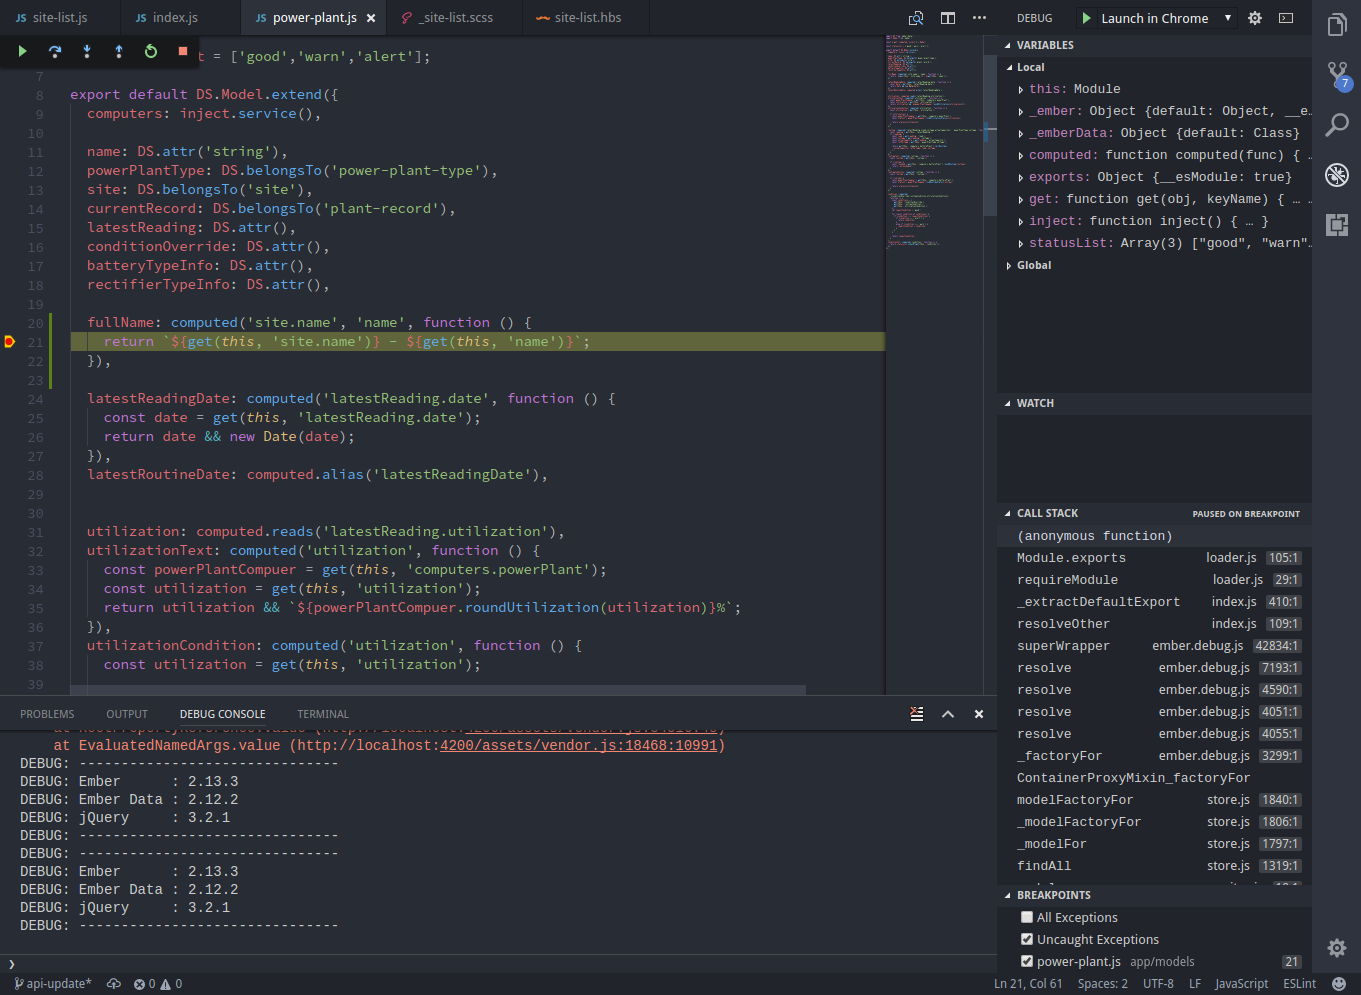
Vscode: Debug actions pane often blocks file names
Currently the debug actions pane is always displayed at the top center position. This often blocks the file names.

It would be helpful to find a better place for the pane or add the ability to move the debug actions pane.
 jasonyueyang
All 56 comments
Yes please! It would be great to have this in its own toolbar. I'm constantly having to move it out of the way when trying to switch tabs.
 jtlowe
on 14 Oct 2016
jtlowe
on 14 Oct 2016
Possibly something like the image below, that would only appear when in debug mode.

jtlowe
on 14 Oct 2016
I'd love to see it be moveable (more than left to right), or in the debug pane itself. This is pretty painful as is being locked on top of the file tabs.
 kmudrick
on 13 Apr 2017
kmudrick
on 13 Apr 2017
Assigning to april to investigate a better solution. Though not making gurantees that this gets fixed in april.
fyi @stevencl
 isidorn
on 13 Apr 2017
isidorn
on 13 Apr 2017
@jamiedawsonyoung - would love to hear your thoughts on this.
 stevencl
on 10 May 2017
stevencl
on 10 May 2017
What are those extra buttons in the screenshot here? How to get those buttons? Can debug buttons be placed there?
 gulshan
on 10 May 2017
gulshan
on 10 May 2017
@gulshan your link is not good, however some adapter support more debug actions and when using those adapters more actions appear. For instance the chakra debugger supports step back debugging, and when debugging chakra an additional step back action will be added
isidorn
on 11 May 2017
The image in the link looks like-

gulshan
on 11 May 2017
@gulshan those buttons are from ancient times of Monaco on azure websites. That product is an ancestor to VSCode, you can google around to search for more data.
isidorn
on 11 May 2017
@stevencl When I looked at the debug section on the website I can see what looks like a 'grip / grabber' to the left of the controls. It would suggest that this panel has been floating in the past? Was there a reason it's now fixed?
It doesn't look (from my fairly light experience of VSC) that we have many floating windows that users can move around so I'm not sure we should introduce one here.
It might be there's a place for it in the debug view (the view I see when I click the bug icon on the left but I'd need to try out debugging something for real to see the controls work and whether they could fit.
@stevencl could you or someone send me a file I can try to debug?
 jamiedawsonyoung
on 11 May 2017
jamiedawsonyoung
on 11 May 2017
Hey @jamiedawsonyoung to debug something have the following file and press F5
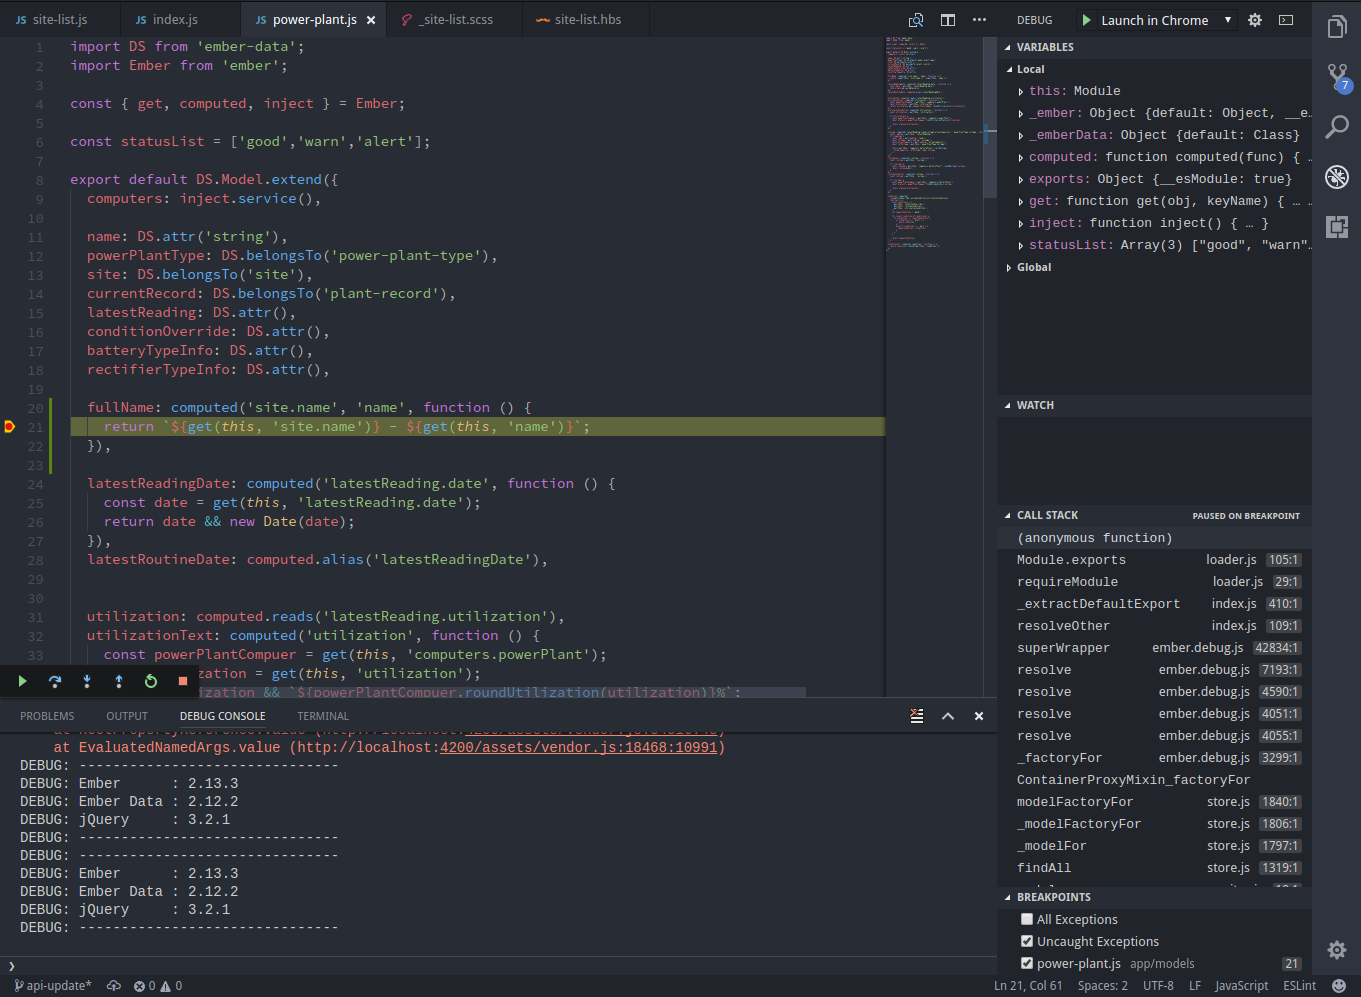
The screenshot in this issue is outdated, currently we allow the debug toolbar to be dragged around but only horizontally. We are thinking if we should also allow vertical dragging with some sugar on top - like the toolbar beinging docked to top and it takes extra effort to dock it out.
console.log('hey jamie')
Thanks @isidorn Got it working :-)
jamiedawsonyoung
on 11 May 2017
@jamiedawsonyoung let me know if I can help in some other way or if you would like to chat so I provide more details about the issue.
isidorn
on 12 May 2017
Hey @isidorn That would be great. I'll set up a wee call so we can chat about this.
jamiedawsonyoung
on 12 May 2017
To start we have decided to experiment with the default position of the debug toolbar(move it from center to all the way to the right). We have also added telemetry to track where usres usually place the debug toolbar so in the future we can make a data driven decision.
Pushing this out to June to get some telemetry data before making a final decision.
isidorn
on 17 May 2017
@isidorn Moving the panel to a different spot on the top definitely won't address this problem. I think telemetry is great, but I don't think it'll help as people will put the bar anywhere but over the file of interest. Why can we not move it away from the filenames altogether?
 seesemichaelj
on 27 May 2017
seesemichaelj
on 27 May 2017
@seesemichaelj thanks for the feedback and I agree that telemetry might not be beneficial in the end.
We have some ideas on moving it from the filenames which we want to explore next milestone.
After discussing within the team we have decided to change the default location back to the center of the screen due to discoverablity.
isidorn
on 29 May 2017
When you say next milestone, do you mean June or July? I think we could have an initial solution for the June to see if it works out instead of waiting for July. I guess I'm still confused why the delay? Is it too difficult to solve? Do you need help implementing it?
seesemichaelj
on 29 May 2017
June.
 jens1o
on 29 May 2017
jens1o
on 29 May 2017
June.
This week we are in the may endgame which means we accept no new features and we are only testing. Due to that we can only do this in June.
PRs are of course always welcome, but I would prefer some UX sketches before you potentially start implementing something.
isidorn
on 30 May 2017
I've just published an extension for adding a debugger to the statusbar, might be a decent workaround until this gets fixed, check it out:

 fabiospampinato
on 16 Jul 2017
fabiospampinato
on 16 Jul 2017
Being able to position it bottom left of the editor view would be my preference, or just being able to snap it to any edge along the editor view.
 robbiespeed
on 18 Jul 2017
robbiespeed
on 18 Jul 2017
@robbiespeed Having it anchored at the top I believe it's a mistake, how should it behave if the there's not enough space for both the debugger and the search widget?
Having it at the bottom might cause the same problem, but for that to happen the window would need to be very weirdly resized, so it shouldn't be a concern.
fabiospampinato
on 18 Jul 2017
I think it would be helpful if it could be optionally pinned to its own bar directly below the title bar. This would get it out of the way of everything else. This would take away a little room from the code window and sidebar, but is that a great concern?
At the least, there should be the option to get it out of the way of tabs and other stuff.
Thanks
Jordan
On Jul 18, 2017, at 8:31 AM, Fabio Spampinato notifications@github.com wrote:
@robbiespeed Having it anchored at the top I believe it's a mistake, how should it behave if the there's not enough space for both the debugger and the search widget?
Having it at the bottom might cause the same problem, but for that to happen the window would need to be very weirdly resized, so it shouldn't be a concern.
—
You are receiving this because you are subscribed to this thread.
Reply to this email directly, view it on GitHub, or mute the thread.
jtlowe
on 18 Jul 2017
Maybe you should the buttons in the activity bar. There is a lot of space for those buttons. The sessions drop down could be placed at the status bar.
 NCC1701M
on 15 Aug 2017
NCC1701M
on 15 Aug 2017
I really don't know why this cant just be like an actual toolbar (not floating) like VS, or pretty much any other ide (I know.... crazy concept). (forgive me for being very opinionated on this, this is almost solely why I tend to use webstorm over vscode)
I feel like there's someone someplace that just decided idea of toolbars in vscode are evil, and while this would be the typical solution if we weren't talking vscode... suggestions to solve many of the problems toolbars would normally solve, tend to be real round about stuff like... just remember the command, or stick a button in the status bar.
 ronnyek
on 21 Sep 2017
ronnyek
on 21 Sep 2017
A lot of excellent ideas, pictures and comments about this issue in #9093
 wyckster
on 26 Sep 2017
wyckster
on 26 Sep 2017
@ronnyek I share your thoughts. I don't mind trying to work through a better solution, but I'd love a toolbar option in the meantime.
Anyway, maybe some guidelines will help pin down a better solution. Here are my opinions:
- It should be configurable. There are so many variables in how we all use Code that a single solution will cause a problem for someone.
- Multiple configurations: docked in its own toolbar, positioned to top or bottom, or floated
- Don't overlay the bar on top of other things, unless given the option to.
- Keep its visibility independent of any sidebar or panel. It needs to be visible when viewing both the Explorer and Debug sidebars (and probably others as well). It also needs to be visible when the Debug or other panel is closed
- It should not be affected by other extensions, editors, window size, etc...
- Other extensions can place icons in the activity bar. Placing it here would reduce space for other extension icons, and could also be affected by the height of the window. This is the same for the status bar.
- It's placement shouldn't affect other items (excluding screen real estate for a toolbar). This will allow it to become visible in debug mode without moving anything else around or other side effects.
- For example, placing it in the tabs area may displace the open tabs, plus may be strange with split editors.
- Don't compromise on accessibility
jtlowe
on 26 Sep 2017
I'm really looking for a solution to this problem as it seems that the debugger is always in my way. I keep moving it all the time. I'm trying to exclusively use the shortcuts now (because my debugger is never in the same place) and may be you could allow us to hide it if we don't want it (because we are only using the shortcuts). Thanks.
 JeanClaudeCottier
on 29 Sep 2017
JeanClaudeCottier
on 29 Sep 2017
@JeanClaudeCottier you can already hide it, just add "debug.hideActionBar": true to your settings.
fabiospampinato
on 29 Sep 2017
@fabiospampinato I've just tried your extension. Its great, thanks a lot.
JeanClaudeCottier
on 29 Sep 2017
Shameless hack here jut because 😆
Open the editor web tools, paste this thing in the console and hit enter. Make sure to have the widget visible in your screen.
function getOutOfMyWay() {
  document.querySelector('.debug-actions-widget')
    .setAttribute('style', `
      bottom: 0;
      left: 0;
      position: fixed;
      height: 32px;
      display: flex;
      padding-left: 7px;
      box-shadow: none;
      transform: rotate(-90deg) translate(90px, 20px);
      transform-origin: left center 0px;
  `);
}
getOutOfMyWay();
 n370
on 1 Dec 2017
n370
on 1 Dec 2017
A few of my ideas:
- Allow it to be draggable to the bottom above the status bar.
- Sticky it to the top of the left panel, so it pushes the panel down. If the panel is hidden, it could float like it does now (combine with first point).
- Hide the faded debug tools in the widget when they are disabled, then it can be over the right side tab controls without covering actual tabs.
 knownasilya
on 3 Jan 2018
knownasilya
on 3 Jan 2018
I hope code devs didn't scratch this idea as it seems like to me this would make sense to solve with a toolbar, but powers that be here have for all intents and purposes stated that they have no intentions of doing anything at all with toolbars. (I guess at least they aknowledged it was some sort of conspiracy... unfortunate decision though)
ronnyek
on 3 Jan 2018
For the last 3 months I've been using VSCode to do stuff I haven't done before: debug Python. I absolutely love it (despite the disability to debug unit tests - still can't figure out if it's a bug or a lack of some kind of massive configuration), but that constant moving of debug buttons from left to right just got on my nerve already.
Could you please let us know of your current plans on this? Thanks!!
 bakasmarius
on 8 Feb 2018
bakasmarius
on 8 Feb 2018
I would be extremely okay with the thing taking up space on the left sidebar underneath the usual icons.
 dearsaturn
on 8 Feb 2018
dearsaturn
on 8 Feb 2018
Hey @bgashler1 & @isidorn, is this still being picked up? For now I'm using the plugin to hide it in the statusbar. But that one does not provide a switcher between multiple running processes...
I would vote for integrating it with (or putting it below) the DEBUG panel title bar.
 guidobouman
on 9 Feb 2018
guidobouman
on 9 Feb 2018
From #9093:

Is that what you guys mean?
 mattacosta
on 9 Feb 2018
mattacosta
on 9 Feb 2018
This is a problem that users are having and we plan to adress it in the near future.
As to in which milestone exactly I can not specify yet, but seems like not in february.
In the meantime if somebody is willing to contribute a PR, feel free to create one where we can discuss first how to solve it and agree on the implementation.
isidorn
on 9 Feb 2018
@mattacosta I actually really like that idea. That's a pretty sensible spot for it.
dearsaturn
on 9 Feb 2018
@isidorn how about the next one? :)
 JesseNewman19
on 14 Mar 2018
JesseNewman19
on 14 Mar 2018
Here's my way around it:
Open the workbench.main.js file inside vscode.app (on a mac, unsure of pc but I'm sure that file exists) and search for:
style("top",r.getTitleBarOffset()+"px")
and replace with:
style("top",(r.getTitleBarOffset()+35)+"px")
This moves the debugger down into your code area.

This needs to be redone after every update.
 EverlastEngineering
on 24 Mar 2018
EverlastEngineering
on 24 Mar 2018
@fabiospampinato Your extension words fine! Thx
But not has a option to hide the native Debug actions pane.
 ghost
on 30 Mar 2018
ghost
on 30 Mar 2018
@tiagoSAmaral the README file explains how to do that: https://github.com/fabiospampinato/vscode-statusbar-debugger#hints
seesemichaelj
on 30 Mar 2018
Thx
ghost
on 30 Mar 2018
I don't understand why this thing has to be locked on the y-axis... I haven't looked at the implementation but people have been complaining about this for 2 years. Wouldn't a great first step be to simply allow it to be dragged wherever the user wants? Then the telemetry results might actually be helpful.
 mattblackdev
on 16 Apr 2018
mattblackdev
on 16 Apr 2018
Debugging is one of the flashiest of vscode and also one of the most critical features for users ... yet this perpetual annoyance of a debugging UI stays under discussion for years. Purporting that it is "part of a larger problem" does exactly nothing for users who would be perfectly happy with the dirtiest quick hack to allow it to float anywhere in the window instead of frozen to the top row of the window. That's gotta be what, an hour's work? Mind-blowing to read such a thread ... is there a product manager that's married to the location perhaps?
 kletkeman
on 3 May 2018
kletkeman
on 3 May 2018
I'm sorry, but I think we need to stop complaining and go ahead and put in the work. I don't see any of you stepping up to the plate and submitting a PR as @isidorn recommended in February.
Sure, I'm not sure why this one issue has fallen through the cracks, but I feel as developers we all know what it's like to be "too busy" to work on something that isn't in our priority list, or our bosses priority list. We all probably are just going to respond "Mike, we don't have time to do this, this is _Microsoft's_ job." Well they are busy too, and try to release a stable product monthly for the entire world to use.
I will try to put in some time the next two weeks to submit a PR if no one else steps up to the plate, merely because I'm tired of hearing all of the complaints.
seesemichaelj
on 3 May 2018
I've submitted 2 PRs for further discussion with VSCode maintainers/@isidorn. While #49097 is a readily available PR which allows vertical dragging, I prefer the other proposed solution in #49099 which will need further discussion in terms of implementation. I will push to have some sort of solution merged for the May or June milestones.
seesemichaelj
on 3 May 2018
I've been using Fabio's extension for months (THANK YOU FABIO). Most of the time, I'm using the keyboard shortcut anyway. I switch off the original and awful (yes awful) debugger tab and never looked back. I made VSCode my main platform for development (I wouldn't have without the extension). I feel the pain for the people that can't use it. I can't believe this hasn't been fix yet. VSCode is a great product that I'm promoting all the time. But the debug tab!!!! What are you waitting for guys? No excuses, for such a critical feature.
JeanClaudeCottier
on 3 May 2018
@seesemichaelj I agree that the whinging is probably best replaced with action. My excuse is having worked into the wee hours for too many days in a row, shuffling the debug tab back and forth as I stop, start, restart, stop, start, restart a couple of micro-services ... it gets a little old ... I'll take a look at Fabio's extension, thanks for the tip @JeanClaudeCottier
kletkeman
on 3 May 2018
@seesemichaelj I agree with you, but when I decided to try and make a PR myself I went to read about how to set up VSCode for developing it... It surprisingly has quite a lot of steps, so I decided to leave it for later "when I have more time", so like never :D But I guess I should just do it today and get over with it :)
bakasmarius
on 4 May 2018
I appreciate the initiative @bakasmarius! I went ahead and created PRs (see my last comment) so at this point it would be duplicating work, and much of it relies on the outcome of UX meetings.
seesemichaelj
on 4 May 2018
Thanks for the feedback and for opening PRs with great ideas.
After discussion we decided to introduce the following setting
"debug.toolbar": "float"|"dock"|"hide"
The default is like before that the debug toolbar is floating, however it can now be docked to the debug viewlet.
debug.hideActionBar is now deprecated and we will no longer support that setting in 2 milestones.
Feedback is welcome, especially on naming of settings.
What I still plan to investigate if possible is to add some action in the toolbar to dock it directly from there.
fyi @weinand @alexr00

isidorn
on 10 May 2018
That's better, thank you, but why not putting the commands in a secondary line/toolbar? Like this:
The current solution isn't great for compound debugging, this sidebar looks absolutely massive to me:

It can be resized, but then I lose the name fo the view ("DEBUG"), the name of the launch configuration gets cropped, and even the "more" button gets hidden.

Putting this actions on a secondary line/toolbar just seems a better solution to me.
fabiospampinato
on 10 May 2018
I definitely agree with @fabiospampinato.
Further, you lose the launch configuration drop down. There are cases where you start debugging and then want to run another launch configuration. You can't press F5 because your selected configuration is already running and I believe combining the multi-process dropdown and launch configuration dropdown into one will be nonintuitive and a clutter.
seesemichaelj
on 10 May 2018
Related issues
 DovydasNavickas
·
3Comments
DovydasNavickas
·
3Comments
 trstringer
·
3Comments
trstringer
·
3Comments
 lukehoban
·
3Comments
lukehoban
·
3Comments
 shanalikhan
·
3Comments
shanalikhan
·
3Comments
 mrkiley
·
3Comments
mrkiley
·
3Comments
Most helpful comment
I've just published an extension for adding a debugger to the statusbar, might be a decent workaround until this gets fixed, check it out: