Tracking issue for debugger improvements:
- [ ] Fix/cleanup
ruby-debug-ideintegration with editor. This includes making sure the debugger properly handles breakpoints (#270, #44) - [ ] Support external debuggers. Support will be done via the
debugger-xmlgem and theruby-debug-ideprotocol. This would bring in support forbyebuganddebugger - [ ] Support/document attaching to existing processes (#18, #114)
- [ ] Support remote debugging (#42)
- [ ] Support
pry - [ ] Support autodetection of debugger gems via environment detection
- [ ] Support debug console REPL (#439)
 wingrunr21
All 29 comments
I would like to very gently bring up the idea of putting the debugger into a separate extension. Seems like we already have quite a full plate with the language features... :)
 gurgeous
on 5 Apr 2018
gurgeous
on 5 Apr 2018
For me the debugger is a critical part of this extension. Allowing for quickly debugging Ruby projects. I prefer VSCode over RubyMine for most debugging - as it's less setup. I hope it doesn't get de-prioritised.
My 2 ¢
 thomthom
on 5 Apr 2018
thomthom
on 5 Apr 2018
I am in agreement. This extension will have a debugger. If others wish to write an extension they are welcome to do so but people shouldn’t have to install 3-5 extensions for the basics
wingrunr21
on 5 Apr 2018
I (and other team members) switched to Code because of this extension and the debugger. I've been digging into the VSCode extension development just to help make this part better and more reliable.
The new VSCode log points would be very useful and one I'd like get working as well.
 pelted
on 6 Apr 2018
pelted
on 6 Apr 2018
OK, understood. Perhaps it's just a matter of prioritization. There's a lot of work slated for v1 at the moment.
gurgeous
on 6 Apr 2018
The debugger experience is decoupled from the language server implementation. I think the current debugger code needs some cleanup work and love but it can be done independently of the language server work. PRs against that would be helpful as about all I've done in that area is read the docs.
wingrunr21
on 6 Apr 2018
This extension started as a ruby debugger integration for vscode, and then more features came, like linters, formatters, etc. Let's keep it in this extension ;)
Comparing this extension with other debuggers (like Python, Go or OmniSharp), the biggest pain point IMHO is setup. At the very beginning, the extension api was limited, like there is no support for memento (persistent storage for extensions) so I decided to use the documentation to guide ppl through the setup. But looked at what other debuggers provided at this moment, we can see quite a few places that we can improve
- Ruby env detection
- Automatically download required binaries
- Setting page inside the editor (see GitLens as an example)
@castwide mentioned similar ideas in https://github.com/rubyide/vscode-ruby/issues/318#issuecomment-378911761
 rebornix
on 11 Apr 2018
rebornix
on 11 Apr 2018
I'd like to throw in my two cents: the debugger is the core element that I really need from this extension. Most of the other stuff is nice-to-have, but being able to trigger breakpoints and cleanly examine the environment is something I consider a critical tool. Being able to use VS Code for this is ideal because it lets me consolidate the number of applications I need installed to run my assorted projects.
Admittedly, as it currently stands, I had the debugger working properly on another machine and then when I moved to a new one I started getting some weird behavior where breakpoints were nominally hit but none of the environment variables showed and it didn't seem to be possible to step through the code at all. Assuming y'all are keeping debugging support in, I'll file an issue next week and see if I can figure out what's happening.
 nonsenseless
on 23 Apr 2018
nonsenseless
on 23 Apr 2018
All,
The debugger WILL be getting improvements. It will NOT get stripped from the extension. Just so everyone is aware, there is no risk of it not getting some attention. I consider it a core element of the extension (but not THE core) and it will be improved. That is what this issue is for. It is not for people to put in their two cents as to whether the feature is of importance.
Thanks
wingrunr21
on 23 Apr 2018
I filed this issue in ruby-debug-ide.
Current wrapping is:
rdebug-ide spring (debuggable)
--> spring child process post fork (runs rspec spec/file_spec.rb) (not debuggable)
Wondering if anyone can suggest a good way to accomplish the following wrapping:
spring (pre-fork - not debuggable)
--> rdebug-ide -- rspec spec/file_spec.rb (debuggable! Rejoice!)
Currently that's not possible as rdebug-ide is unconditionally used by the GUI and would wrap spring.
 CJBridges
on 22 Jun 2018
CJBridges
on 22 Jun 2018
I'll share a workaround for rdebug-ide and spring here and if y'all feel it's not in the right place I'll promptly move it elsewhere:
I made an executable file called ~/.local/bin/rdebug-wrapper with the following contents:
#!/usr/bin/env bash
rdebug-ide -- $*
I then updated my vscode debugger configs to include:
"pathToRDebugIDE": "$HOME/.local/bin/rdebug-wrapper",
It hits breakpoints and seems to work for all of the use cases that I encounter in my daily work.
 lukewestby
on 19 Nov 2018
lukewestby
on 19 Nov 2018
Could you add a way to only step through your project files, not the Gem files? It's annoying having to step through Rails when I just want to debug my own files. Or is this possible right now?
 erlingur
on 26 Feb 2019
erlingur
on 26 Feb 2019
Well I'll quietly hope that this issue being pinned 7 days ago and assigned a few hours ago means that this issue may be under construction soon! 😃
 jon-sully
on 26 Feb 2019
jon-sully
on 26 Feb 2019
It’s next in my list after I finish language server bugs with the latest release.
wingrunr21
on 26 Feb 2019
Hi everyone, I believe I have worked through most of the language server bugs. There might be a few more here or there but I started work on the debugger overhaul last night.
I am still looking into whether I can slow-roll these updates like I have been doing the language server. The way the extension is configured today it will not be possible however it looks like I can move the debugger to run within the extension host and allow a config option to switch back and forth between the debuggers. I'll see how this ends up playing out.
It looks like the work is going to fall into two available backends: ruby-debug-ide + debase support and byebug. The debugger-xml gem hasn't been updated in years and appears to no longer support newer version of byebug. This means I'll probably need to write specific support for byebug. Still investigating here.
I will be structuring things to focus on ruby-debug-ide support first.
wingrunr21
on 7 Mar 2019
Just to clarify (since #426 is closed), is it still not possible to debug a rails app within VS Code?
 erikthered
on 28 Mar 2019
erikthered
on 28 Mar 2019
Issue number #476 can be fixed by this
Instructions say that you must open the workspace you want in vscode and start debugging it.
I mean run the project on another computer and open the root in vscode in your local machine that might work. See this https://github.com/rubyide/vscode-ruby/wiki/3.-Attaching-to-a-debugger
I think setting remoteworkspace to {workspaceroot} will help.
That means you should run the project on another device and open the project in your local machine with vs code and set cwd and remoteworkspaceroot to {workspaceroot}
 minkir014
on 6 May 2019
minkir014
on 6 May 2019
Seeing as #477 is locked to collabs, I thought I'd post my findings here.
The issue described in #476 is that the remoteWorkspaceRoot is not being used when telling the remote process where the breakpoints are set, and thus they aren't honored. It doesn't matter what you set it to. I've only been experimenting with this on a Windows -> Linux (docker) environment. I created a test repository here: https://github.com/Ratismal/rdebug-windows-docker-test
When using #477, breakpoints are added with the correct location. See before:
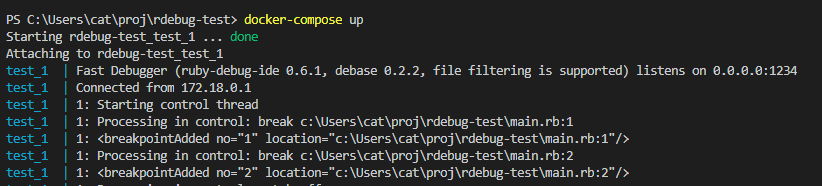
Compared to with #477:

Thus, it seems to be working as intended to me. Considering that this is a longstanding issue that's halting the workflow of myself and others, as well as the fact that a solution has already been created, can we expect this to be resolved in the near future? What is the status of the PR @wingrunr21?
 Ratismal
on 21 May 2019
Ratismal
on 21 May 2019
Any news on this, and/or directions to help in resolving the issues? I'd be glad to try and contribute but don't know where to go from there as I'm not familiar with the stuff :(
 qortex
on 24 May 2019
qortex
on 24 May 2019
Seeing as #477 is locked to collabs, I thought I'd post my findings here.
The issue described in #476 is that the remoteWorkspaceRoot is not being used when telling the remote process where the breakpoints are set, and thus they aren't honored. It doesn't matter what you set it to. I've only been experimenting with this on a Windows -> Linux (docker) environment. I created a test repository here: https://github.com/Ratismal/rdebug-windows-docker-test
When using #477, breakpoints are added with the correct location. See before:
Compared to with #477:
Thus, it seems to be working as intended to me. Considering that this is a longstanding issue that's halting the workflow of myself and others, as well as the fact that a solution has already been created, can we expect this to be resolved in the near future? What is the status of the PR @wingrunr21?
I have been slamming my head into the wall for the past 2 days trying to figure out what the difference was between my OS X and Windows config because debugging was working just fine on OS X but it would only attach and then miss all breakpoints on Windows.
This seems to address the problem. What's the status?
 mattschutt
on 31 May 2019
mattschutt
on 31 May 2019
@wingrunr21 I would love to sponsor you to fix some of these if you can apply for the GitHub sponsor program?
 andrewmcodes
on 5 Jul 2019
andrewmcodes
on 5 Jul 2019
@andrewmcodes you can start by adding a PR for adding support for debugger-xml
minkir014
on 6 Jul 2019
@wingrunr21 Is adding support for repl for running only or for debugging with breakpoints???
minkir014
on 6 Jul 2019
@andrewmcodes I signed up for it but it's still in beta. Thank you for your support though.
I have not made a ton of progress against this for a few reasons:
- Language server support has been taking up more time. It is quite difficult to keep up with the pace of VSCode development as a single dev working on this in his (limited) free time. This in addition to a user base who expect full support for features even when they are still in the Insiders release (like remote environments were).
- I'm trying to build out test suite coverage and better ways for the OS community to contribute. I think this will ultimately bring about better pacing of development and release
I am currently setting up a project plan and am aiming for a v1 release by RubyConf this year
wingrunr21
on 6 Jul 2019
Hi,
I've been bashing my head against the debugger for several days trying to work out why its so unstable. Despite poking about a lot in the ruby-debug-ide code I'm still not sure. The variables window is particularly problematic. I'm beginning to wonder whether there are a lot of problems in the ruby extension side of things...
James
 jabamaus
on 10 Apr 2020
jabamaus
on 10 Apr 2020
Can you elaborate more specifically what is problematic? Some concrete ecamples?
thomthom
on 10 Apr 2020
Its mostly about refreshing the variables view but it also feels like some state is left over between debug runs as restarting vscode/deleting all breakpoints does seem to help. Its so hard to pin down because I realised my own code which contained BasicObject/method_missing was adding further problems due to the debugger's use of inspect/to_s/pretty_print. During my fiddling I've seen lots of weird stuff like on one run a step over command seems to behave like a step in command in that I have to press step multiple times on a one line each loop - but then it may behave differently next run.
I've just realised that a MAJOR part of the problem is that ruby-debug-ide is taking almost 5 minutes to inspect a tree of variables. That's not going to help. I'm trying to further pin down where the time is going,
Sorry its all a bit vague. Probably not the extensions fault at all, although I did see a suspicious TODO in main.ts...
protected evaluateRequest(response: DebugProtocol.EvaluateResponse, args: DebugProtocol.EvaluateArguments): void {
    // TODO: this will often not work. Will try to call
    // Class.@variable which doesn't work.
    // need to tie it to the existing variablesReference set
    // That will required having ALL variables stored, which will also (hopefully) fix
    // the variable value mismatch between threads
    this.rubyProcess.Enqueue("eval " + args.expression).then(result => {
        response.body = {
            result: result.value
                ? result.value
                : (result.length > 0 && result[0].value
                    ? result[0].value
                    : "Not available"),
            variablesReference: 0,
        };
        this.sendResponse(response);
    });
}
Hm... this had me interested because I've had some issues myself.
I've also had cases where variable inspection stops working. Additionally adding/removing breakpoints appear to not take effect. In my case it appear to happen when I try to set Watches.
But I'm also debugging Ruby inside of SketchUp - and I was suspecting the SketchUp debugger interface (https://github.com/SketchUp/sketchup-ruby-debugger) being the culprit - though I've not had time to dig into that.
thomthom
on 10 Apr 2020
This issue has not had activity for 30 days. It will be automatically closed in 7 days.
![github-actions[bot] picture](https://avatars.githubusercontent.com/in/15368?v=4&s=40) github-actions[bot]
on 16 Aug 2020
github-actions[bot]
on 16 Aug 2020
Related issues
 Yukaii
·
4Comments
wingrunr21
·
4Comments
Yukaii
·
4Comments
wingrunr21
·
4Comments
 SerkanOruc
·
5Comments
SerkanOruc
·
5Comments
 pelletencate
·
5Comments
pelletencate
·
5Comments
 ecbrodie
·
5Comments
ecbrodie
·
5Comments
Most helpful comment
Hi everyone, I believe I have worked through most of the language server bugs. There might be a few more here or there but I started work on the debugger overhaul last night.
I am still looking into whether I can slow-roll these updates like I have been doing the language server. The way the extension is configured today it will not be possible however it looks like I can move the debugger to run within the extension host and allow a config option to switch back and forth between the debuggers. I'll see how this ends up playing out.
It looks like the work is going to fall into two available backends: ruby-debug-ide + debase support and byebug. The debugger-xml gem hasn't been updated in years and appears to no longer support newer version of byebug. This means I'll probably need to write specific support for byebug. Still investigating here.
I will be structuring things to focus on ruby-debug-ide support first.