Vscode-ruby: Breakpoint not hit for rails
Your environment
vscode-rubyversion: 0.12.1- Ruby version: 1.9.3p551
- VS Code version: April 2017 (version 1.12)
- Operating System: OSX 10.12
- Hardware (optional): Macbook Pro 2015 x86_64
Have installed ruby-debug-base19x (0.11.31), ruby-debug-ide (0.6.0)
launch.config:
{
"name": "Rails server",
"type": "Ruby",
"request": "launch",
"cwd": "${workspaceRoot}",
"pathToBundler": "/Users/leaveofabsence/.rvm/gems/ruby-1.9.3-p551@sampleapp2/bin/bundler",
"useBundler": true,
"showDebuggerOutput": true,
"program": "${workspaceRoot}/bin/rails",
"args": [
"server"
]
},
Expected behavior
Breakpoints should be hit when debugging rails
Actual behavior
Debugger launches correctly and rails server is up and running. However, breakpoints don't activate (ie. breakpoint in UsersController.rb "index" action and navigate to localhost:3000/users, VSCode does not break on breakpoint). If I debug a simple .rb file using default "Debug local file" configuration, then breakpoints successfully activate.
This is the output from the Debug Console:
Fast Debugger (ruby-debug-ide 0.6.0, ruby-debug-base19x 0.11.31, file filtering is not supported) listens on 127.0.0.1:1234
DEPRECATION WARNING:
Sass 3.5 will no longer support Ruby 1.9.3.
Please upgrade to Ruby 2.0.0 or greater as soon as possible.
[2017-05-29 10:19:06] INFO WEBrick 1.3.1
[2017-05-29 10:19:06] INFO ruby 1.9.3 (2014-11-13) [x86_64-darwin16.5.0]
[2017-05-29 10:19:06] INFO WEBrick::HTTPServer#start: pid=23728 port=3000
Any ideas of where I'm going wrong?
 leaveofabsence
All 8 comments
In my case I solved with bundle install --binstubs
 mberrueta
on 22 Jun 2017
mberrueta
on 22 Jun 2017
I'm having same issue, @mberrueta 's suggestion did not make any difference for me.
 hshar7
on 30 Jun 2017
hshar7
on 30 Jun 2017
Also having this problem. Not very experienced with VSCode debugger, but I've set breakpoints and the server does not stop.
Config:
    {
      "name": "Launch unicorn",
      "type": "Ruby",
      "request": "launch",
      "cwd": "${workspaceRoot}",
      "showDebuggerOutput": true,
      "program": "${workspaceRoot}/bin/unicorn",
      "args": ["-p", "3000", "-c", "./config/unicorn.rb"]
    },
Debug output:
Fast Debugger (ruby-debug-ide 0.6.0, debase 0.2.1, file filtering is supported) listens on 127.0.0.1:1234
WARN: Unresolved specs during Gem::Specification.reset:
      rake (>= 0.8.1)
WARN: Clearing out unresolved specs.
Please report a bug if this causes problems.
I, [2017-08-28T15:40:39.276409 #11485]  INFO -- : Refreshing Gem list
I, [2017-08-28T15:40:51.195646 #11485]  INFO -- : listening on addr=0.0.0.0:3000 fd=15
I, [2017-08-28T15:40:51.440931 #11485]  INFO -- : master process ready
I, [2017-08-28T15:40:51.446100 #11510]  INFO -- : worker=0 ready
127.0.0.1 - - [28/Aug/2017:15:41:16 +1000] "GET / HTTP/1.1" 200 63841 4.1009
127.0.0.1 - - [28/Aug/2017:15:41:18 +1000] "POST /mini-profiler-resources/results HTTP/1.1" 200 - 0.0367
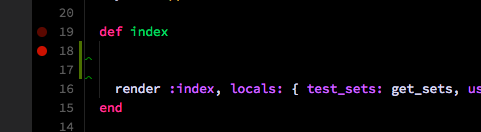
Breakpoint set:
 rhys-vdw
on 28 Aug 2017
rhys-vdw
on 28 Aug 2017
Any updates here?
hshar7
on 31 Aug 2017
I actually managed to make it work by adding the path to my RdebugIDE
{
    "version": "0.2.0",
    "configurations": [
        {
            "name": "Rails server",
            "type": "Ruby",
            "request": "launch",
            "cwd": "${workspaceRoot}",
            "remoteWorkspaceRoot": "${workspaceRoot}",
            "showDebuggerOutput": true,
            "program": "${workspaceRoot}/bin/unicorn",
            "args": ["-p", "3000", "-c", "./config/unicorn.rb"],
            "pathToRDebugIDE": "/Users/Etienne/.rbenv/versions/2.4.0/lib/ruby/gems/2.4.0/gems/ruby-debug-ide-0.6.0/bin/rdebug-ide"
        }
]}
My debug output shows
Fast Debugger (ruby-debug-ide 0.6.1.beta9, debase 0.2.2.beta10, file filtering is supported) listens on 127.0.0.1:1234
 etiennejcharles
on 21 Sep 2017
etiennejcharles
on 21 Sep 2017
Closing for issue cleanup. Apologies if this is still an issue. We are working to improve the core extension experience.
 wingrunr21
on 3 Apr 2018
wingrunr21
on 3 Apr 2018
For anyone who still has the issue, this config helped me:
 {
            "name": "Rails server",
            "type": "Ruby",
            "request": "launch",
            "showDebuggerOutput": true,
            "cwd": "${workspaceRoot}",
            "program": "script/rails",
            "args": ["server"]
 }
With original config on my project, startup script (${workspaceRoot}/bin/rails) executes 'script/rails' in the second process without the debugger.
 virtax
on 22 Aug 2018
virtax
on 22 Aug 2018
In my case it was due to this:
https://github.com/Shopify/bootsnap/issues/168
I upgraded from ruby 2.5.3 to 2.6.0 and it fixed it (patching 2.5.3 to the latest probably would have worked too).
 mark100net
on 5 Jan 2019
mark100net
on 5 Jan 2019
Related issues
 Snake-Sanders
·
4Comments
Snake-Sanders
·
4Comments
 Yukaii
·
4Comments
Yukaii
·
4Comments
 rebornix
·
3Comments
rebornix
·
3Comments
 chrisnicola
·
5Comments
chrisnicola
·
5Comments
 mmarinaccio
·
3Comments
mmarinaccio
·
3Comments