Vscode-react-native: The extension doesn't work with Expo Cli
I have a problem,
Recently as you can see on the screenshot under create-react-native-native-app is now outdated.
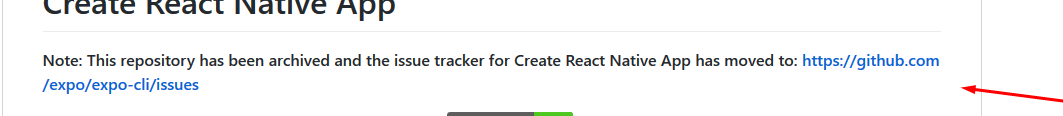
And the new name of the extension is expo-cli
https://expo.io/
Can you support debuging expo cli app using visual studio code ?
Thanks
link of the create-react-native-native-app repo : https://github.com/react-community/create-react-native-app
 MichelMelhem
All 26 comments
Hi @The-Developeur and thanks for asking. Extension already support debugging in Expo. Please refer to this documentation section for more details. Also, be aware that Configuring Expo section is outdated, but we already proposed a PR with update, so if you need more information about advanced configuration, please, turn to it for now.
Please let us know, if you have any questions.
 ruslan-bikkinin
on 19 Nov 2018
ruslan-bikkinin
on 19 Nov 2018
My apologies if this isn't close enough to what this issue is about...
I created an app using ``expo
I followed the instructions in the PR #826, ran the "Debug in Exponent", logged in to expo when prompted, scanned the QR code, runs the sample app on my phone, all good! However vscode does not stop at breakpoints, and after a few minutes I get an error, "Launch/Request timeout".
I note from the instructions that I should expect some files to be created in .vscode/ , e.g. exponentIndex.js . These files are not created. All I see is .vscode/.react/debuggerWorker.js
My launch.json is
  "configurations": [
    {
      "name": "Debug in Exponent",
      "program": "${workspaceRoot}/.vscode/launchReactNative.js",
      "type": "reactnative",
      "request": "launch",
      "platform": "exponent",
      "sourceMaps": true,
      "outDir": "${workspaceRoot}/.vscode/.react"
    }
  ]
I'm looking for something obvious like in this reply but not seeing it, sorry!
github repo
output log
expo version 2.4.0
extension version 0.6.18
node 10.13.0-64
 hatton
on 22 Nov 2018
hatton
on 22 Nov 2018
@hatton I could debug your application running on Windows machine and Android emulator without any problem.
I'm looking for something obvious like in this reply but not seeing it, sorry!
So, did you try that solution? Did it help you?
Sorry if I confused you with my answer about the docs. The most recent documentation is in improve-docs branch and we are going to merge it soon. So for now, please turn to this documentation file for getting more details about how to debug Expo apps until it merged.
ruslan-bikkinin
on 23 Nov 2018
Sorry if I confused you with my answer about the docs. The most recent documentation is in
improve-docsbranch and we are going to merge it soon. So for now, please turn to this documentation file for getting more details about how to debug Expo apps until it merged.
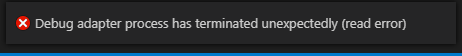
That link is dead, but if I open the correct one (mentioned above), and follow those instructions, I still get errors:
Debug adapter process has terminated unexpectedly (read error)
 Morriz
on 29 Nov 2018
Morriz
on 29 Nov 2018
@Morriz seems to be that you have completely different case, please, submit separate issue.
That link is dead,
Thanks for pointing on that, changes from that PR already in master.
@hatton do you still have a problems debugging Expo App? If not, i'd close this.
ruslan-bikkinin
on 29 Nov 2018
I do. Also, your newly pointed documentation still refers to old expo stuff:
the extension will install xde and @expo/ngrok when this feature is used for the first time.
It works now. Had to restart vscode :)
Morriz
on 29 Nov 2018
And now it barks on .vscode/exponentIndex.js not found
Morriz
on 29 Nov 2018
@Morriz please submit separate issue.
ruslan-bikkinin
on 29 Nov 2018
Thank you @ruslan-bikkinin
MichelMelhem
on 29 Nov 2018
I'm looking for something obvious like in this reply but not seeing it, sorry!
So, did you try that solution? Did it help you?
In that screenshot, there is a "Debug JS" link on the phone. But I don't see anything like that in the Android expo app. Similarly, the instructions now show a different screenshot with that kind of button, but again, only a partial screenshot, so you can't see where in the app you should see this.
Here's what I see: https://i.imgur.com/PDxSEvg.png, https://i.imgur.com/6OG8FNO.png.
Also, do let me know if you'd like a different issue for @Morriz and I seeing no .vscode/exponentIndex.js. Thanks!
hatton
on 29 Nov 2018
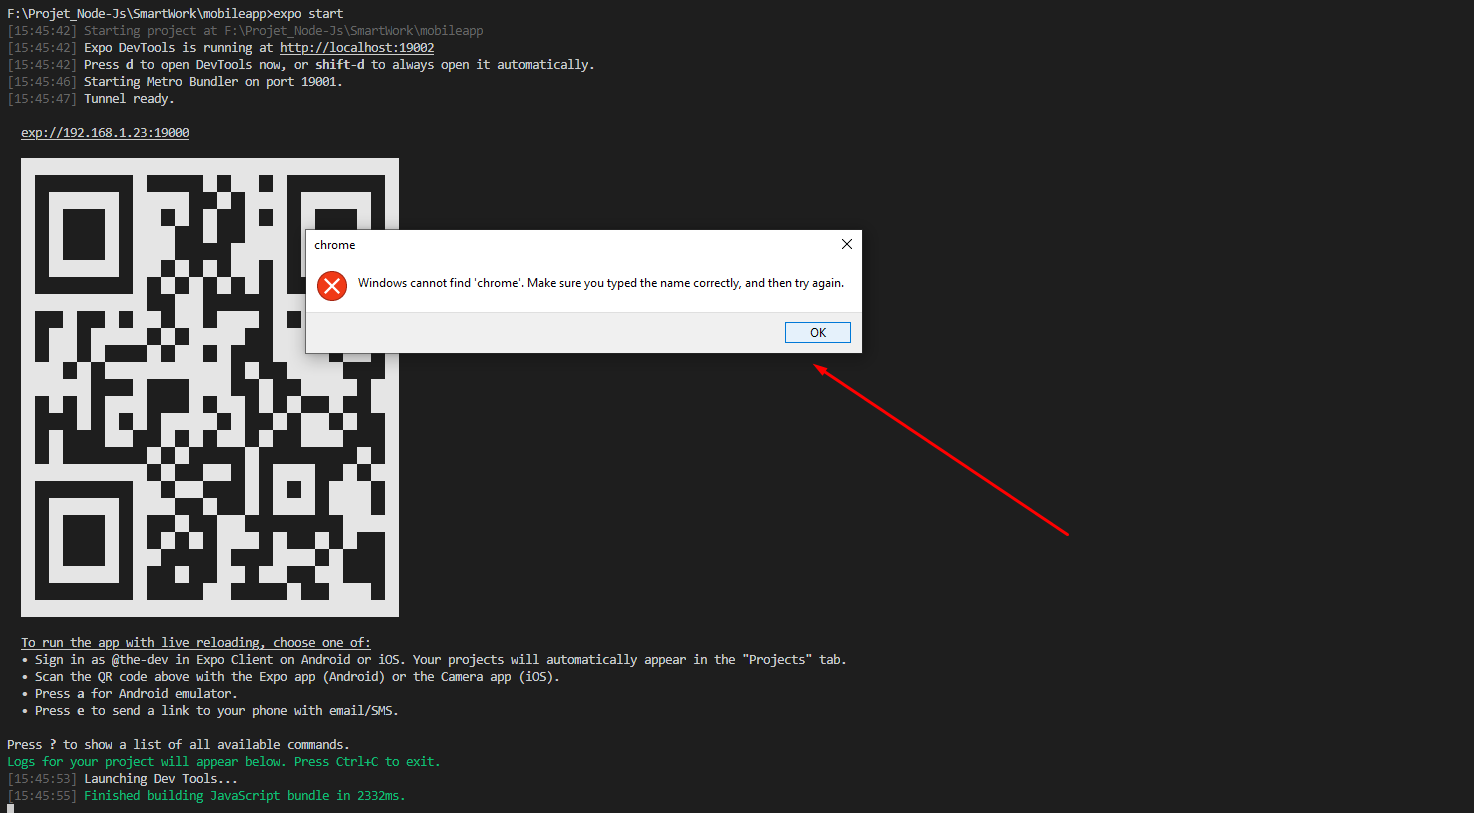
@ruslan-bikkinin When i start my project with the "Debug in Exponent" configuration i have this error

And in my .vscode Folder i don'y have launchReactNative.js
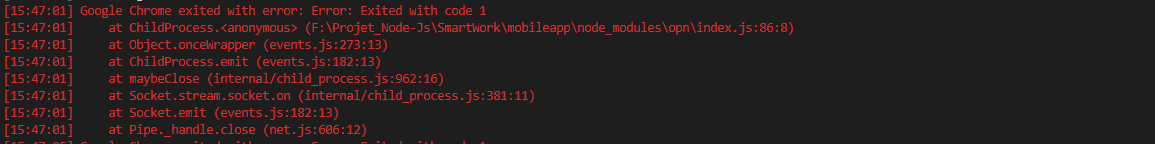
I have an other error when i select on the expo app remote js debuging i have this error on the console

MichelMelhem
on 29 Nov 2018
OK, I read more instructions, more carefully, and found that the secret to getting to the developer menu is literally shaking your device (that's a new one!). And now we have https://github.com/Microsoft/vscode-react-native/issues/846 for the lack of generated .vscode files, so my part of this issue is dealt with. Thanks for the help!
hatton
on 29 Nov 2018
@hatton I hnow but when i select remote debuging expo said me i need chrome to allow me remote debuging
MichelMelhem
on 29 Nov 2018
@hatton thanks for your reply. Do you experience the same issue now like in #846?
@The-Developeur
And in my .vscode Folder i don'y have launchReactNative.js
Technically debugger doesn't require .vscode/launchReactNative.js and this file is no longer being generated inside .vscode. This is undocumented yet but the thing is that it couldn't be a reason for your problem.
What OS do you use? What platform are you targeting: android or iOS? Are you running your app on real device or simulator/emulator?
@hatton I hnow but when i select remote debuging expo said me i need chrome to allow me remote debuging
Could you please show me a screenshot of that?
ruslan-bikkinin
on 29 Nov 2018
Actual Behavior
i start the debugger with the configuration Debug in Exponent

I Have this error
The Debugger ShutDown
### Expected Behavior
debugger to continue
Software
I use the expo app on ios
This is my error when i selected "use a remote debugger"
MichelMelhem
on 29 Nov 2018
@hatton thanks for your reply. Do you experience the same issue now like in #846?
Yes, I still do not see .vscode/exponentIndex.js.

hatton
on 29 Nov 2018
@hatton please see https://github.com/Microsoft/vscode-react-native/issues/846#issuecomment-443128583
ruslan-bikkinin
on 30 Nov 2018
@The-Developeur if you use Debug In Exponent configuration then you don't need to run expo start.
All you need to do is to run Debug In Exponent configuration, wait until QR code window appears, open Expo app on your device/simulator, scan or copy-paste qr code to your app, wait until app is loaded, open Developer Menu, enable remote js debugging and that's it.
Regarding this error:

Could you please give us exact reproduction steps for it and these logs:
- Output of the Debug Console (View -> Toggle Debug Console):
PASTE OUTPUT HERE
- Output of the React-Native output channel (View -> Toggle Output -> Select React-Native in ListBox):
PASTE OUTPUT HERE
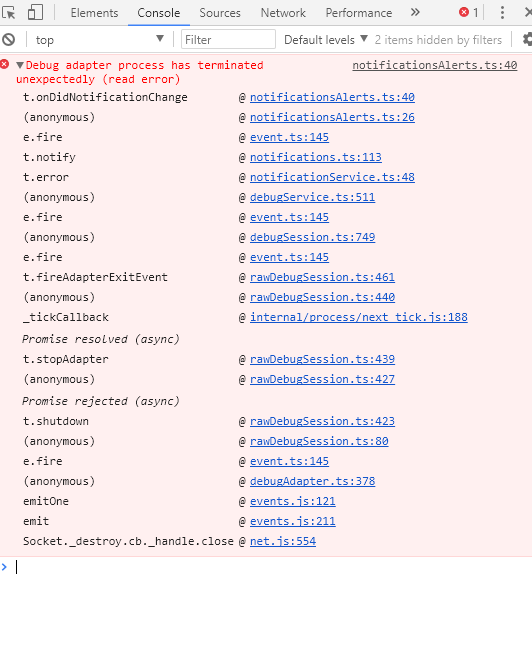
- Output of the Developer Tools console (Help -> Toggle Developer Tools -> Select Console tab):
PASTE OUTPUT HERE
Also, please be aware, that there are some issues with logging in current version of VS Code 1.29, but in latest Insiders build these issues are resolved, so, please, use Insiders build for it.
ruslan-bikkinin
on 30 Nov 2018
Output of the Debug Console (View -> Toggle Debug Console):
Nothing.
Output of the React-Native output channel (View -> Toggle Output -> Select React-Native in ListBox):

I don't have react native in the Listbox
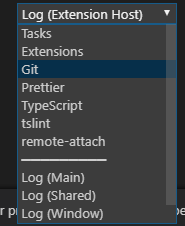

I have the extension;

Output of the Developer Tools console (Help -> Toggle Developer Tools -> Select Console tab):
| t.onDidNotificationChange | @ | notificationsAlerts.ts:40
-- | -- | -- | --
| (anonymous) | @ | notificationsAlerts.ts:26
| e.fire | @ | event.ts:145
| t.notify | @ | notifications.ts:113
| t.error | @ | notificationService.ts:48
| (anonymous) | @ | debugService.ts:511
| e.fire | @ | event.ts:145
| (anonymous) | @ | debugSession.ts:749
| e.fire | @ | event.ts:145
| t.fireAdapterExitEvent | @ | rawDebugSession.ts:461
| (anonymous) | @ | rawDebugSession.ts:440
| _tickCallback | @ | internal/process/next_tick.js:188
| Promise resolved (async) | |
| t.stopAdapter | @ | rawDebugSession.ts:439
| (anonymous) | @ | rawDebugSession.ts:427
| Promise rejected (async) | |
| t.shutdown | @ | rawDebugSession.ts:423
| (anonymous) | @ | rawDebugSession.ts:80
| e.fire | @ | event.ts:145
| (anonymous) | @ | debugAdapter.ts:378
| emitOne | @ | events.js:121
| emit | @ | events.js:211
| Socket._destroy.cb._handle.close | @ | net.js:554
MichelMelhem
on 30 Nov 2018
@ruslan-bikkinin
MichelMelhem
on 30 Nov 2018
@The-Developeur it's still not clear, what cause your problem. Could you please, share with us demo application so we could try to reproduce it on our side?
Also, please fill these items:
Software versions
- React-Native VS Code extension version:
- VSCode version:
- OS platform and version:
- NodeJS version:
- React Native version:
- Expo SDK version (include if relevant):
ruslan-bikkinin
on 3 Dec 2018
@The-Developeur do you have a chance to look at this, please?
ruslan-bikkinin
on 6 Dec 2018
Software versions
React-Native VS Code extension version:
VS Code extension version: 0.7.0
VsCode version : 1.29.1
Windows 10 Version 1809
NodeJs version : v10.13.0
React native version : v0.57.5
Expo sdk version : sdk-31.0.0
Expo Cli version : 2.6.0
This sample projet don't run with the "Debug in Exponent" debuger config
(When you donlowoad the projet don't forget to run npm i ^^ )
@ruslan-bikkinin
MichelMelhem
on 6 Dec 2018
Hi @The-Developeur and sorry for delayed response. Your project works without any problems in my case. I was able to reproduce your problem only once, when for some unknown reason all files except directories were missing in node_modules/react-native. I'd recommend you to remove node_modules directory and run npm install again. Please let me know if it helps.
ruslan-bikkinin
on 18 Dec 2018
Okay,
thank you for your helping ^^
Finally i use your extension with the react native cli and it work perfectly !
MichelMelhem
on 25 Dec 2018
Related issues
 molant
·
3Comments
molant
·
3Comments
 canpoyrazoglu
·
3Comments
canpoyrazoglu
·
3Comments
 kralcifer-ms
·
4Comments
kralcifer-ms
·
4Comments
 springcoil
·
5Comments
springcoil
·
5Comments
 yuki2006
·
5Comments
yuki2006
·
5Comments