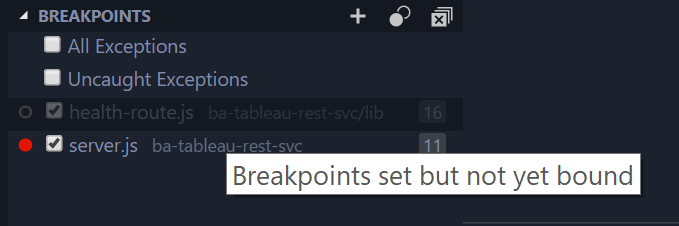
Vscode-react-native: Breakpoint set but not yet bound
Actual Behavior
- Breakpoint does not stop code execution
Expected Behavior
- Breakpoint stops code execution
- Latest version of everything.
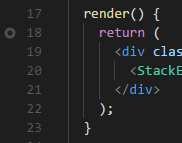
- "Breakpoint set but not yet bound" is displayed when hovering over the breakpoint.
- Debugger is working just fine, when pressing the pause button the execution stops.
- Console log shows that the code is running in the file where the breakpoint is set.
Workaround
Just remove any of your breakpoints and add it again - breakpoints become red and stop code execution
 dancomanlive
All 90 comments
i'm getting this too... very annoying!
 AylwSt01
on 12 Feb 2018
AylwSt01
on 12 Feb 2018
So something definitelly with the newest update, since it worked in the past.
 novellizator
on 16 Feb 2018
novellizator
on 16 Feb 2018
Hey guys, thanks for reaching us and sorry for the delayed response. We are going to investigate it asap and let you know if we have any questions or updates.
 sergey-akhalkov
on 16 Feb 2018
sergey-akhalkov
on 16 Feb 2018
Is there anything we can help with? I'll have to switch from VSCode unless this gets fixed :/
novellizator
on 19 Feb 2018
Hi @novellizator, yes, it would be great, because I've just tried to debug my iOS test app - it works as expected without any issues and I was able to debug my code. Going to verify on Android and then switch to Windows. Currently, my environment is the same as in this issue: https://github.com/Microsoft/vscode-react-native/issues/630
Here is my test app: https://github.com/sergey-akhalkov/vsrn625
issue625.zip
So could you guys please share with us your exact environment and provide a minimum working version of your code where the issue reproduces?
sergey-akhalkov
on 19 Feb 2018
I just setup VScode for the first time and ran into the same issue:
Vscode 1.20.1
RN Tools 0.5.7
RN 0.53.0
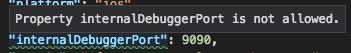
One unusual thing I noticed is that when I created the launch parameters I looked at launch.json and when I reviewed the docs for the Extension it recommended to add internalDebuggerPort, but I see this:
Here is some additional information from the debug console:
OS: darwin x64
Adapter node: v7.9.0 x64
vscode-chrome-debug-core: 3.18.5
Starting debugger app worker.
Established a connection with the Proxy (Packager) to the React Native application
Debugger worker loaded runtime on port 4612
The "Debugger worker" port seems to be changing on every run.
 edmundito
on 19 Feb 2018
edmundito
on 19 Feb 2018
Hi @edmundito, thanks for sharing the info!
internalDebuggerPort
Hm, I have not touched it at all and it works just as it is.
The "Debugger worker" port seems to be changing on every run.
The same is for me, so I don't think if it's a root cause, so I'm still trying to reproduce the issue.
sergey-akhalkov
on 19 Feb 2018
Invalidating <RCTCxxBridge: 0x6040003c97e0> (parent: <RCTBridge: 0x6040000cae20>, executor: RCTWebSocketExecutor)
RCTLog.js:48
Debugger worker loaded runtime on port 33223
Module RCTImageLoader requires main queue setup since it overrides `init` but doesn't implement `requiresMainQueueSetup`. In a future release React Native will default to initializing all native modules on a background thread unless explicitly opted-out of.
RCTLog.js:48
Running application issue625 ({
RCTLog.js:48
    initialProps =     {
    };
    rootTag = 31;
})
Running application "issue625" with appParams: {"rootTag":31,"initialProps":{}}. __DEV__ === true, development-level warning are ON, performance optimizations are OFF
Fun stuff: I added a console.warn to the click function so that it look like this
click() {
    console.warn("hahaha");
    this.setState({ clicks: ++this.state.clicks });
  }
and set a breakpoint to this.setState(). The debugger didn't work.
But then, I set another breakpoint to the line with console.warn, and everything worked.
novellizator
on 19 Feb 2018

Still not working. Tried on two different projects.
dancomanlive
on 20 Feb 2018
can't it be some version of external dependency?
novellizator
on 20 Feb 2018
Hi @novellizator, could you please confirm - do I get it right that the issue has place since the new version of VSCode 1.20.0 or you have seen it before?
sergey-akhalkov
on 20 Feb 2018
I dont remember when the VSCode got updated, but it's a fairly recent issue. Can I somewhere find an older version of VSCode to try it out? (there isn't one on the homepage)
novellizator
on 20 Feb 2018
@novellizator, here is https://code.visualstudio.com/updates/v1_20
For older version of VSCode you can found download links there, please let me know if you need anything else.
sergey-akhalkov
on 20 Feb 2018
are you sure there any any download links? don't see any... please send me
a link for macOS download of some older version....
On Tue, Feb 20, 2018 at 11:52 AM, Sergey Akhalkov notifications@github.com
wrote:
@novellizator https://github.com/novellizator, here is
https://code.visualstudio.com/updates/v1_20
For older version of VSCode you can found download links there, please let
me know if you need anything else.—
You are receiving this because you were mentioned.
Reply to this email directly, view it on GitHub
https://github.com/Microsoft/vscode-react-native/issues/625#issuecomment-366940168,
or mute the thread
https://github.com/notifications/unsubscribe-auth/AChNTbeUlk_p27UlYE8c-PoyhirrAvoXks5tWqPpgaJpZM4R5GjR
.
novellizator
on 20 Feb 2018
are you sure there any any download links?
yeah, here is

Here is the link for Mac download (verions 1.19) https://vscode-update.azurewebsites.net/1.19.3/darwin/stable
sergey-akhalkov
on 20 Feb 2018
My bad, just quickly searched for "download" and didn't find anything relevant on the webpage.
Anyways, 1.19 works well. So it only breaks on 1.20
novellizator
on 20 Feb 2018
@novellizator, got it, thanks, it's useful info. So could you please confirm if the issue reproduces on the demo app I've sent here https://github.com/Microsoft/vscode-react-native/issues/625#issuecomment-366719491? If so, could you please let me know what the line of the code you are setting a breakpoint to?
sergey-akhalkov
on 20 Feb 2018
You wont believe this. But I tried running 1.18 with tools 0.5.7 and it worked, then updated the tools to 0.6.0, still worked, Then ran VSC 1.19, still worked (I didn't remove the original VSCode though!) and now that I opened VSC 1.20 (I had it in /Applications for the whole time), it magically works again... So probably I can't (and don't reaaaly want to ;) ) reproduce the bug again...
I thing that I noticed (hopefully right) is, that I didn't seem to have the "Node Debug [email protected]" extension installed at the time whe it didn't work. I'm not sure if I remember correcly though.
novellizator
on 20 Feb 2018
@novellizator, gotcha :)
Please let me know if the issue will happen for you again. I'm going to try one more thing but I'm still looking for reproducible demo / repro steps.
sergey-akhalkov
on 20 Feb 2018
Hey guys, I've tried to reproduce the issue both for Android and iOS on macOS but with no luck. So I need your help to figure out what goes wrong. Could you please answer the following questions to make things clear:
- Are you using TypeScript in your project?
- Does the issue reproduces on the test app I've provided here https://github.com/Microsoft/vscode-react-native/issues/625#issuecomment-366719491 If not, please provide us a minimum working version of your app. @dancomanlive, could you please share the link to your app where the issue reproduces?
- What OS are you using: macOS, Windows?
- Does this issue have a stable repo? If so, could you please provide repro steps?
- What launch configuration are you using, default or custom?
- Have you ever seen this issue before VSCode version 1.20 or it reproduces for 1.20 only?
- What version of
react-native-cliare you using? - Please share exact version of your software you are using for development from this issue template
- Could you please try to reinstall VSCode to see if the issue still has place?
sergey-akhalkov
on 20 Feb 2018
For what it's worth:
- no
- originally the issue reproduced on your code, also, now your code works
- macOS
- default
- no, never before
On Tue, Feb 20, 2018 at 2:48 PM, Sergey Akhalkov notifications@github.com
wrote:
Hey guys, I've tried to reproduce the issue both for Android and iOS on
macOS but with no luck. So I need your help to figure out what goes wrong.
Could you please answer the following questions to make things clear:
- Are you using TypeScript in your project?
- Does the issue reproduces on the test app I've provided here #625
(comment)
https://github.com/Microsoft/vscode-react-native/issues/625#issuecomment-366719491
If not, please provide us a minimum working version of your app.
@dancomanlive https://github.com/dancomanlive, could you please
share the link to your app where the issue reproduces?- What OS are you using: macOS, Windows?
- Does this issue have a stable repo? If so, could you please provide
repro steps?- What launch configuration are you using, default or custom?
- Have you ever seen this issue before VSCode version 1.20 or it
reproduces for 1.20 only?- What version of react-native-cli are you using?
- Please share exact version of your software you are using for
development from this issue template
https://github.com/Microsoft/vscode-react-native/issues/new—
You are receiving this because you were mentioned.
Reply to this email directly, view it on GitHub
https://github.com/Microsoft/vscode-react-native/issues/625#issuecomment-366982596,
or mute the thread
https://github.com/notifications/unsubscribe-auth/AChNTX87jx_l5zEcvjoDV8L1jra2Geoyks5tWs1KgaJpZM4R5GjR
.
novellizator
on 20 Feb 2018
@novellizator, thank you! Waiting for clarification from the others, just trying to find any leads that can help me to reproduce the issue.
sergey-akhalkov
on 20 Feb 2018
@sergey-akhalkov
- No
- Yes, issue was reproduced on your repo
- macos High Sierra
- Just cloned your repo, npm install, set breakpoints in App.js:27 and App.js:31 and faced this problem
- Default
- I think, I seen this issue before (september-october release maybe) but not sure.
- react-native-cli: 2.0.1
- React-Native VS Code extension version: 0.6.0
- VSCode version: 1.20.1
- OS platform and version: macOS High Sierra 10.13.3
- NodeJS version: 9.5.0
- React Native version: 0.53.2 & 0.52.2 on my project
- Reinstalled (settings not been erased) but got some problem.
Downgraded VSCode to 1.19.3 and breakpoints work! But when I switched back to 1.20.1 breakpoints don't work again.
 olegdeezus
on 20 Feb 2018
olegdeezus
on 20 Feb 2018
Version 1.21.0-insider (1.21.0-insider)
MacOS 10.13.3 (17D47)
Same result for Android.
dancomanlive
on 21 Feb 2018
Hey guys, thank you so much for sharing all the info. I've found 2 things (while debugging vsrn625 I've provided previously) that really worrying me:
- your
vscode-chrome-debug-coreversion is3.18.5, but mine is3.23.0 - your
rootTagin appParams is31, but mine is11
So guys could you please totally remove React Native tools using this command rm -rf ~/.vscode/extensions/vsmobile.vscode-react-native-0.5.7/ and then install it again (please install the lates version 0.6.1) to see if you have the same vscode-chrome-debug-core version and the same rootTag number?
Please let me know if you have any updates.
sergey-akhalkov
on 21 Feb 2018
I recently installed the version 0.6.1 of vscode-react-native. The breakpoints are not working yet.
react-native-tools: 0.6.1
vscode:1.20.1
OS: Ubuntu 17.10
react-native-cli: 2.0.1
node:v9.5.0
 Sler69
on 21 Feb 2018
Sler69
on 21 Feb 2018
Same here. Breakpoints don't work. :(
react-native-tools: 0.6.1
vscode: 1.20.1
os: ubuntu 16.04
react-native-cli: 2.0.1
node: 8.9.4
react-native: 0.47
 f4z3k4s
on 22 Feb 2018
f4z3k4s
on 22 Feb 2018
Hi @Sler69, @f4z3k4s, could you please let me know what is your version of vscode-chrome-debug-core (you can check it in debug console)?
If this module has version 3.18.5 - please try to reinstall your extension as I've described here and let me know if the issue still has place for you.
sergey-akhalkov
on 22 Feb 2018
Hi @sergey-akhalkov, my vscode-chrome-debug-core version is : 3.23.0.
f4z3k4s
on 22 Feb 2018
Hi @sergey-akhalkov,
vscode-chrome-debug-core version is : 3.23.0
Sler69
on 22 Feb 2018
Hey guys, I was able to reproduce it:
- Completely remove RN Tools Extension with all its dependencies from VSCode
- Install it again
Debug iOS
The debugging actually works when I reset one of the debug breakpoints, but it's actually annoying. So I'm going to investigate the root cause of the issue and let you know if I have any updates.
sergey-akhalkov
on 23 Feb 2018
breakpoints does not work at all.
the only way to break is to type "debugger" where one need to set the breakpoint.
this way the debugger is invoked and execution stops
 Gremlin80
on 23 Feb 2018
Gremlin80
on 23 Feb 2018

Getting this error when reloading the application in debug mode. I don't know if it is relevant to this issue though but I am sharing it just in case it would be. Break point still not working after reinstalling React Native Tools. DevTools.js comes from remote-redux-devtools/lib. I have "remote-redux-devtools": "^0.5.12"
dancomanlive
on 26 Feb 2018
Hi @Gremlin80,
breakpoints does not work at all
Hmm, please let me clarify which way I was able to reproduce the issue:
- Set up breakpoints
- Launch
Debug iOS - Got "Breakpoint set but not yet bound" messages
- Reset one of the breakpoints (just click twice on it)
- Debugging works again
Here is the demo:

So guys, could you please let me know if all of you are experiencing the same issue and if debugging works as expected after resetting breakpoints?
As of now I'm working on fix that should allow to avoid of breakpoints resetting (avoid/remove step 4)
sergey-akhalkov
on 26 Feb 2018
Yes resetting a single breakpoint allow me to use all the defined breakpoint.
OS: darwin x64
Adapter node: v7.9.0 x64
vscode-chrome-debug-core: 3.23.0
---
netss-MBP:~ nets$ node -v
v9.5.0
---
RN Tools : 0.6.3
react-native-cli: 2.0.1
RN: 0.53.3
VS Code: 1.20.1
 netsmertia
on 26 Feb 2018
netsmertia
on 26 Feb 2018
Yep resetting a single breakpoint enabled all the breakpoints and allowed me to create new ones. Thanks for the feedback @sergey-akhalkov !!
Sler69
on 26 Feb 2018
Now I managed to replicate it even in VSCode Version 1.19.3
so maybe something about the .vscode files crashed, or some running daemon?
On Mon, Feb 26, 2018 at 1:56 PM, Natwar Singh notifications@github.com
wrote:
Yes resetting a single breakpoint allow me to use all the defined
breakpoint.OS: darwin x64
Adapter node: v7.9.0 x64vscode-chrome-debug-core: 3.23.0
netss-MBP:~ nets$ node -v
v9.5.0
RN Tools : 0.6.3
react-native-cli: 2.0.1
RN: 0.53.3
VS Code: 1.20.1—
You are receiving this because you were mentioned.
Reply to this email directly, view it on GitHub
https://github.com/Microsoft/vscode-react-native/issues/625#issuecomment-368492851,
or mute the thread
https://github.com/notifications/unsubscribe-auth/AChNTThzDguYIF8TmrCAVPBp6cpTWFBjks5tYqnmgaJpZM4R5GjR
.
novellizator
on 26 Feb 2018
https://mega.nz/#!bQdCXSRQ!aKz9alToOoL4v1z4cJ9Gj3j0_-KGxuhtO1dt15CE9qs
these are my .vscode and .vscode-react-native folders
novellizator
on 26 Feb 2018
I did replicate the bug on two different macs, dunno how I managed that. I had eslint installed on both machines....
novellizator
on 26 Feb 2018
I tried the fix of deleting the react native tools (including the .vscode folders in home) and didn't help
novellizator
on 26 Feb 2018
Hi @novellizator, have you tried to reset your breakpoints (remove and add them again)? Please let me know if it works or not because I believe that you probably have another issue.
Going to verify the Archive you've sent to me.
sergey-akhalkov
on 26 Feb 2018
The debugger is working now. Still testing but everything works as expected.
dancomanlive
on 27 Feb 2018
Hey guys, just a quick update - I've created an issue here https://github.com/Microsoft/vscode-chrome-debug-core/issues/293 for a breakpoints activation issue (on first debug session) I've described previously, hope they'll be able to respond soon and share their ideas regarding this so we'll be able to fix this issue much faster.
As of now the only way to bypass the issue - is to use a workaround I've described previously - reset one of the breakpoints by removing and adding it again.
sergey-akhalkov
on 27 Feb 2018
I've got the same issue on VS Code as below:
Version 1.20.1
Commit f88bbf9137d24d36d968ea6b2911786bfe103002
Date 2018-02-13T15:34:36.336Z
Shell 1.7.9
Renderer 58.0.3029.110
Node 7.9.0
Architecture x64
Debugger attaches OK. But all breakpoints are dark grey empty circles:
 zmechanic
on 1 Mar 2018
zmechanic
on 1 Mar 2018
I have got the same issue today, but noticed I was setting break points on the packages that are in node_modules using npm link or lerna add or symlinks
If i set breakpoint on the actual package that works fine
 mailaneel
on 2 Mar 2018
mailaneel
on 2 Mar 2018
@sergey-akhalkov
It seems like not the vscode-chrome-debug-core's issue to me.
I tried the workaround, and it didn't help.
I also switched to lots of versions of the vscode and react-native, it didn't help too.
OS:macOS 10.13.3
VSCode:1.20.1(1.19.x tried)
vscode-chrome-debug-core: 3.23.0
react-native:0.54.0(0.5x.0 tried)
Just run react-native init Rn and debug.
 faust21
on 7 Mar 2018
faust21
on 7 Mar 2018
Can confirm repro of this issue with versions below. Turning breakpoints off/on again allows for them to trigger.
mac vs code Version 1.20.1 (1.20.1)
react native tools extension 0.6.4
react-native-cli: 2.0.1
react-native: 0.52.0
 scolestock
on 7 Mar 2018
scolestock
on 7 Mar 2018
Do not use VSCode 1.20 or 1.21. They do not stop at breakpoints.
Use VS Code 1.18 : https://code.visualstudio.com/updates/v1_18
And dont let your version upgrade by default. Set "update.channel": "none".
Otherwise it updates itself to 1.20 and you go back to unhit breakpoints...
 ilkerican
on 8 Mar 2018
ilkerican
on 8 Mar 2018
Same here. Breakpoints don't work. Also @sergey-akhalkov workaround don't work
react-native-tools: 0.6.4
vscode: 1.21.0
os: Arch Linux with latest updates
react-native-cli: 2.0.1
node: 9.8.0
react-native: 0.54.1
these are my .vscode and .vscode-react-native folders https://yadi.sk/d/GO0F50Do3TFHev
Breakpoints in chrome working well
 yakimka
on 11 Mar 2018
yakimka
on 11 Mar 2018
Hey guys, just want to provide a quick update regarding this issue and also clarify several things:
- The issue we are talking about in this thread is described here https://github.com/Microsoft/vscode-react-native/issues/625#issuecomment-368421380 and if you have another repro - please create new issue. Currently we are collaborating with the
vscode-chrome-debug-coreteam and seems like the root cause of the issue is inms-vscode.node-debug2- we are working on this. - @yakimka, the issue you are talking about should be related to this one https://github.com/Microsoft/vscode-react-native/issues/660, @max-mironov already has provided an update regarding this - the issue is in Metro bundler and I think fix should be shipped soon ( 0.54.2 or so )
- If you are unable to hit breakpoint in other cases (not related to 1st-2nd points) - please make sure you are familar with the following items https://github.com/Microsoft/vscode-react-native#known-issues ; https://github.com/Microsoft/vscode-react-native/blob/master/doc/debugging.md ; https://github.com/Microsoft/vscode-chrome-debug#my-breakpoints-arent-hit-whats-wrong otherwise please create separate issue and provide us as much info as possible.
sergey-akhalkov
on 12 Mar 2018
0.54.2 is up
 pennyandsean
on 12 Mar 2018
pennyandsean
on 12 Mar 2018
Just wanted to chime in and include my report that 0.54.2 does not seem to solve the issue for me (I believe they are still using Metro 0.28.0 instead of 0.29.0).
Receiving the message: Unverified breakpoint, breakpoints set but not yet bound
Clicking to reset the breakpoints does nothing.
macOS: 10.13.3
React Native Tools 0.6.4
vscode-chrome-debug-core: 3.23.0
The interesting thing is that breakpoints do indeed work with Webstorm on the same project. Are we positive this is completely an issue with Metro?
 justinwaite
on 14 Mar 2018
justinwaite
on 14 Mar 2018
@jdeanwaite we have added tmp fix for this case, could you please upgrade VSCode RN extension for 0.6.5, reload VSCode and try again?
(sourcemaps should be generated now, the only thing could be an issue described above: https://github.com/Microsoft/vscode-react-native/issues/625#issuecomment-368421380, you could overcome it currently by removing/adding breakpoint again).
 max-mironov
on 14 Mar 2018
max-mironov
on 14 Mar 2018
@max-mironov It is working now other than, as you stated, the need to reset a breakpoint once to get it to work (I can live with that).
justinwaite
on 14 Mar 2018
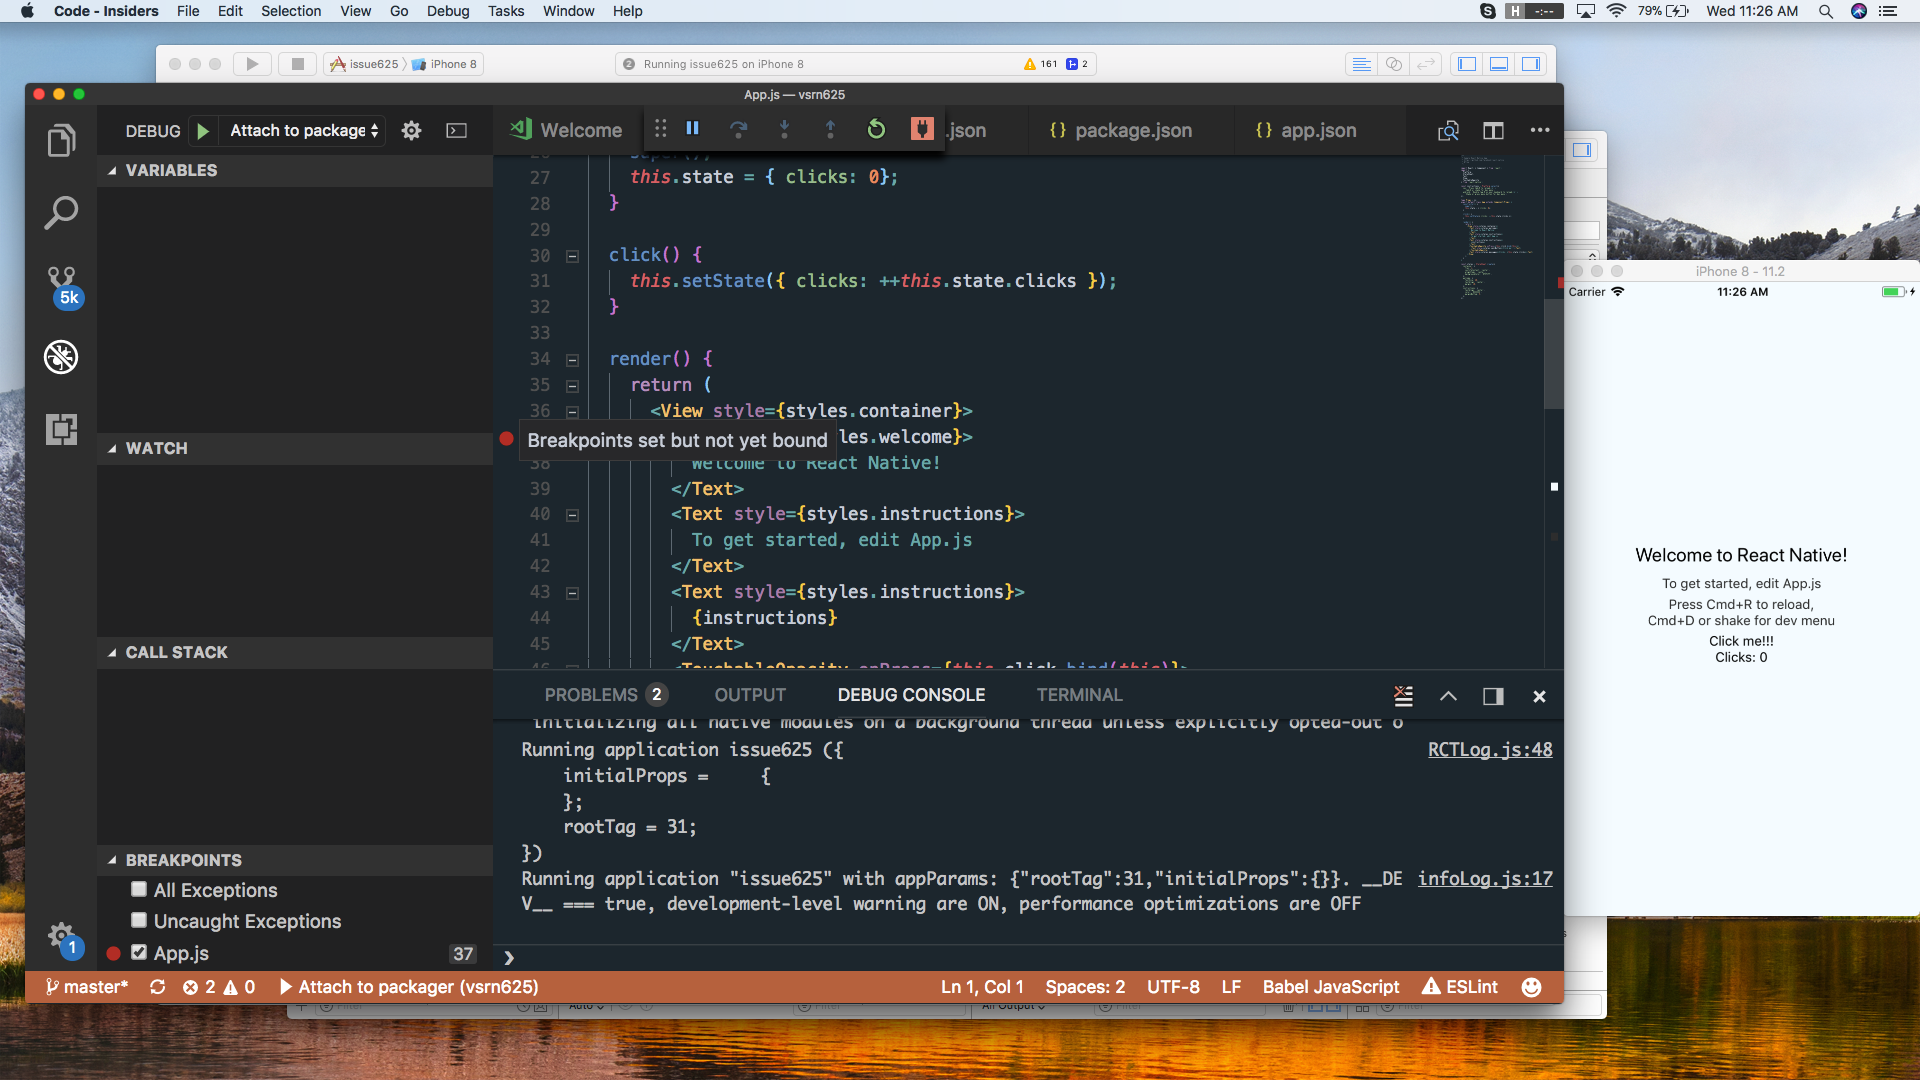
This seems to happen to me when I am accessing the project if its in a subdirectory. I have a mono repo with multiple projects. My typescript nodejs application is in a subdirectory called server.
When I open vscode in the subdirectory of server, the breakpoints are showing (i.e. not as unverified breakpoints). They are still not hitting though. When I click run the application, I have a setTimeout which prints a console.log statement. Before this setTimeout, I have another console.log statement. In the debugging window when a console.log gets printed it gives you a clickable link to open the file that the console.log statement was run from.

Its only in this file that I can create breakpoints that are actually hit.
Version 1.21.1
Commit 79b44aa704ce542d8ca4a3cc44cfca566e7720f1
Date 2018-03-14T14:46:30.761Z
Shell 1.7.9
Renderer 58.0.3029.110
Node 7.9.0
Architecture x64
 tjma2001
on 20 Mar 2018
tjma2001
on 20 Mar 2018
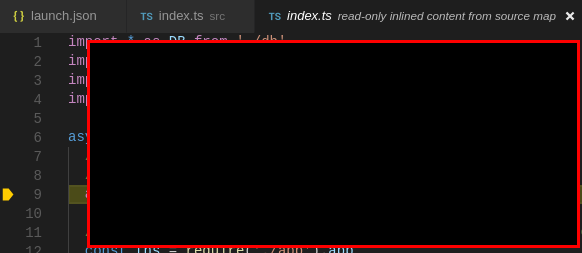
I have just changed my debug command from inspect to inspect-brk. Breakpoints are being hit, but at the wrong points.
This is where is set them:
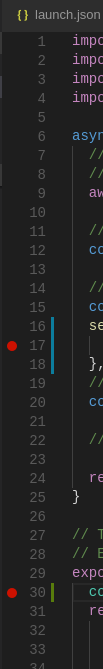
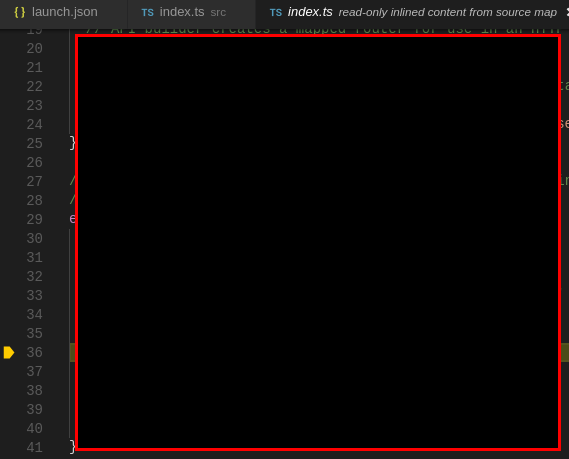
This is where the code is triggering, (once again in the "index.ts read-only inlined content from source map")
This is my current launch.json
{
    // Use IntelliSense to learn about possible attributes.
    // Hover to view descriptions of existing attributes.
    // For more information, visit: https://go.microsoft.com/fwlink/?linkid=830387
    "version": "0.2.0",
    "configurations": [
        {
            "type": "node",
            "request": "attach",
            "name": "Attach to Remote",
            "address": "localhost",
            "port": 5858,
            "protocol": "inspector",
            "localRoot": "${workspaceRoot}",
            "remoteRoot": "/app",
            "sourceMaps": true,
            "restart": true,
            "outFiles": [
                "${workspaceRoot}/server/built/**/*.js"
            ]
        },
        {
            "type": "node",
            "request": "launch",
            "name": "Launch Program",
            "program": "${workspaceFolder}/index.js"
        }
    ]
}
Still have the same issues with version Version 1.21.1 (1.21.1) of VSCode. With workaround it works, but a fix would be cool.
 Benzer1406
on 20 Mar 2018
Benzer1406
on 20 Mar 2018
Same goes here. The weirdest thing is that works on some repos from the same workspace but in the recently settled.
 diego-G
on 27 Mar 2018
diego-G
on 27 Mar 2018
@Benzer1406
Hi ,You say there is a solution to the current version?
What is it? Pls tell me! Thank you very much!
 snoopy83101
on 30 Mar 2018
snoopy83101
on 30 Mar 2018
if solution is "Reset a new breakpoint?"
god ! I choose to die
snoopy83101
on 30 Mar 2018
Yes @snoopy83101, the workaround is to click on a breakpoint that is already set and deactivate it and then click it again on the line where you want it to be and it works.
Benzer1406
on 30 Mar 2018
@Benzer1406
Whenever i restart a debug
Breakpoint Jumps to an Unknown Line
I must first find the unknown line and cancel him.
Then set it again, in the line I want??
Sorry for the Google translation I used
snoopy83101
on 30 Mar 2018
@snoopy83101 then maybe it is a good idea just to use very few breakpoints, Just. One or two.
Benzer1406
on 30 Mar 2018
@Benzer1406
Thank you very much for your answer!
Does the community's big brothers say that this problem will be fixed recently? (in this issues)
snoopy83101
on 30 Mar 2018
None of these "workarounds" do much in my case, all the breakpoints stay with
Breakpoint set but not yet bound
If I add "debugger;" line into the code the debugger stops at this line however not in code but in "index.bundle"
To me the debugger seems fine but the sourcemaps don't seem to point to the actual code. Is there a way to check and see whether the sourcemap are generated correctly?
vscode: 1.21.1
RN tools: 0.6.6
vscode-chrome-debug-core: 3.23.0
 ak99372
on 30 Mar 2018
ak99372
on 30 Mar 2018
same as @ak99372 for me. Exactly the same.
 basdp
on 5 Apr 2018
basdp
on 5 Apr 2018
I am experiencing the same thing "Breakpoint set but not yet bound" :sweat_smile:
 arvi
on 5 Apr 2018
arvi
on 5 Apr 2018
Still an issue in VSCode Version 1.21.1 (1.21.1), React Native Tools 0.6.6,
react-native-cli: 2.0.1
react-native: 0.54.2
scolestock
on 5 Apr 2018
This may be a different problem, but I noticed when I upgrade react-native from 0.54.2 to 0.54.3 my index.map is no longer generated in ./.vscode/.react/
Staying on 0.54.2 is working for me.
My working setup:
OS: Mac OS High Sierra 10.13.4
vscode: 1.21.1
react-native-cli: 2.0.1
react-native: 0.54.2
 hippotz
on 5 Apr 2018
hippotz
on 5 Apr 2018
My breakpoints are grey and never get hit using metro bundler in terminal and using 'Attach to Packager' debug mode.
react-native-cli: 2.0.1
react-native: 0.54.4
windoze 10
RN tools 0.6.6
node debug 2 1.20.0
 ghost
on 6 Apr 2018
ghost
on 6 Apr 2018
I am also encountering this issue
 zhangbobell
on 10 Apr 2018
zhangbobell
on 10 Apr 2018
Upgrading to node 9.11.1 seems to have resolved the problem for me.
 animaonline
on 10 Apr 2018
animaonline
on 10 Apr 2018
Problem still persists with VScode Version 1.21.). FYI i have also check on old version (1.17.2). On both version breakpoints are not working at all. Any fix would be really appreciated.
 ASP-2014
on 11 Apr 2018
ASP-2014
on 11 Apr 2018
Facing same issue with vscode 1.22.1, when i switch to 1.19, it works perfectly, any help will be appreciated !
 rakeshgits
on 12 Apr 2018
rakeshgits
on 12 Apr 2018
1.22.2 behaves the same way.
I'm trying to debug a local WebpackDevServer.
OK, here's what happens (I caught this error after I turned on Break on: All Exceptions):
"Error: Cannot find module 'kexec'
    at Function.Module._resolveFilename (internal/modules/cjs/loader.js:548:15)
    at Function.Module._load (internal/modules/cjs/loader.js:475:25)
    at Module.require (internal/modules/cjs/loader.js:598:17)
    at require (internal/modules/cjs/helpers.js:11:18)
    at /Users/mbo/dev-st/sematext-cloud/frontend/node_modules/babel-cli/lib/babel-node.js:67:17
    at /Users/mbo/dev-st/sematext-cloud/frontend/node_modules/v8flags/index.js:110:14
    at /Users/mbo/dev-st/sematext-cloud/frontend/node_modules/v8flags/index.js:38:12
    at /Users/mbo/dev-st/sematext-cloud/frontend/node_modules/v8flags/index.js:49:7
    at process._tickCallback (internal/process/next_tick.js:176:11)
    at Function.Module.runMain (internal/modules/cjs/loader.js:697:11)"
Hope this helps, VSCode team.
EDIT
This module is a part of babel.
After I installed this package it stopped braking on this error above, but now debugger freezes when I try to step-over an execution of a binary file (kexec.node).
 mbonaci
on 16 Apr 2018
mbonaci
on 16 Apr 2018
By the way, Jest debug sessions don't work either now, because the test finishes a lot before I can even manage to click on a breakpoint.
{
      "type": "node",
      "request": "launch",
      "name": "Jest Tests",
      "program": "${workspaceRoot}/node_modules/jest/bin/jest",
      "args": [
          "-i"
      ],
      "internalConsoleOptions": "openOnSessionStart",
      "outFiles": [
          "${workspaceRoot}/dist/**/*"
      ]
    }
used to work, but doesn't any more.
 SudoPlz
on 17 Apr 2018
SudoPlz
on 17 Apr 2018
OK. After reading all the previous comments and tried.
4 ways to solve this problem for React native dev:
1. With the latest version 1.22.2
- After starting the app, the breaking point in the app will be black.
- click it to disable then click again to active it.
- Now it works.
- Anytime you refresh, do it again.
- Still, won't stop inside
render()function, but event handler works now.
2. Downgrade to 1.19
- Everything works flawlessly
- Remember to turn off the auto update by setting
update.channeltonone - Otherwise, VSC will auto-update and breaks everything.
- One suggestion, not override the existing version. Create a new one. Becasue in my case it ONLY work for the first override at least in my case. For the 2nd override, everything still works but you can't see the breakpoint and its highlight which is another bug.
3. Use Atom + Nuclide
- Everything works
4. Use debugger with the latest version 1.22.2
- Everything works
- use the
debuggerstatement rather than setting up the VSC - Recommend to use this
Something must happened here. Because Webstorm has some similar issues like won't stop inside the render rather than event handler. But works with debugger statement
 Albert-Gao
on 22 Apr 2018
Albert-Gao
on 22 Apr 2018
For Me the debugging only worked with Visual code studio Version 1.17.2 (1.17.2)
Don't forget to disable update for Visual Studio code otherwise it will get updated automatically
In Preferences Set "update.channel": "none".
 krazykira
on 30 Apr 2018
krazykira
on 30 Apr 2018
@krazykira Instead of setting breakpoints in VSC, add the statement debugger; in your code. Run the project in debug mode and the debugger will break at that line.
 joebernard
on 30 Apr 2018
joebernard
on 30 Apr 2018
Hi everyone.
TL;DR
It will be fixed in VS Code v1.24
Explanation:
The cause of issue is a bug in vscode-chrome-debug-core package upon which built-in extension vscode-node-debug2 depends on, that we are using. Bug have fixed since v1.24.0 of vscode-node-debug2, but current latest version of it (which vscode is using) is v1.23.5. So in the next minor release of VS Code this issue should be fixed automatically.
 ruslan-bikkinin
on 10 May 2018
ruslan-bikkinin
on 10 May 2018
Hi guys, I was having the same issue when trying to Attach to Pocess ID by selecting a nodemon instance. I switched to select the one that just says node and everything started to work. Not sure if this will help but doesn't hurt to try.
 danieluy
on 27 May 2018
danieluy
on 27 May 2018
When will the next minor release of VSCode be? Sounds like this bug was fixed almost a month ago now.
 dhalperi
on 6 Jun 2018
dhalperi
on 6 Jun 2018
Hi @dhalperi, as far as I know, new minor version of VS Code is being released at the first half of each month.
ruslan-bikkinin
on 6 Jun 2018
VS Code 1.24 has been released today and this issue has to be resolved now. I tested debugging using this version of VS Code and it worked like a charm, so I am closing this issue.
Please let us know whether you still experiencing such problem after VS Code update.
ruslan-bikkinin
on 7 Jun 2018
I verified it works after the update. Thanks!
joebernard
on 7 Jun 2018
I am still experiencing issues with debug breakpoints not being hit - on version 1.24. Running Node.js code, breakpoints hit in the main program specified, but when breakpoints are set outside of the main code I get the following error:
This happens within both the WSL and with a Windows install of node. Any help would be appreciated - I've tried a variety of debug configurations and none have worked.
 dxh9845
on 7 Jun 2018
dxh9845
on 7 Jun 2018
Hi @dxh9845 could you please submit a new issue including all the info from the issue template that could help us resolve your problem quicker? Also, please include answers for the following questions:
- Are you running a pure React Native project (not Expo, not using Haul packager)?
- Does your project use javascript or typescript? If it uses typescript, please, let us know how it has been configured for it.
- If it is possible, please, attach demo project.
ruslan-bikkinin
on 8 Jun 2018
Hi! I have the same problem. Using 1.24.0 vscode on ubuntu 18.04 with nodejs(javascript) project. I attach to exposed port from docker.
 ivanromaniv
on 8 Jun 2018
ivanromaniv
on 8 Jun 2018
Hi @ivanromaniv so, are you using nodejs project, not React Native project? If you are, I believe, you should submit new issue in vscode repository instead as a better place for this.
ruslan-bikkinin
on 8 Jun 2018
I have locked conversation around this issue due to it's specific symptoms described in the first post. If you are experiencing the similar problem, please, submit a new issue for that.
ruslan-bikkinin
on 11 Jun 2018
Related issues
 springcoil
·
5Comments
springcoil
·
5Comments
 tavrez
·
4Comments
tavrez
·
4Comments
 vladimir-kotikov
·
5Comments
vladimir-kotikov
·
5Comments
 canpoyrazoglu
·
3Comments
canpoyrazoglu
·
3Comments
 kralcifer-ms
·
4Comments
kralcifer-ms
·
4Comments
Most helpful comment
Hi everyone.
TL;DR
It will be fixed in VS Code v1.24
Explanation:
The cause of issue is a bug in
vscode-chrome-debug-corepackage upon which built-in extensionvscode-node-debug2depends on, that we are using. Bug have fixed since v1.24.0 ofvscode-node-debug2, but current latest version of it (which vscode is using) is v1.23.5. So in the next minor release of VS Code this issue should be fixed automatically.