Vscode-r: Workspace viewer similar to vscode-julia
Is your feature request related to a problem? Please describe.
It is time-consuming having to individually examine objects through the View() command. View(globalenv()) does not update automatically so cannot be used for this purpose.
Describe the solution you'd like
I understand that this has been around about brought up in a few issues, such as #15, #23, and #47. However, I think that with the session viewer having access to the current R environment, it would be neat to do something similar to what vscode-julia has semi-recently implemented here.
Considering that the session viewer currently examines the R environment, I think exposing what it shows in the sidebar would be helpful. This exists in vscode-julia, and in R Studio (i.e. the environment viewer). We currently sort of have this through the View(globalenv()) call (which is great!), but the returned dataframe is not interactive, doesn't update without reloading the object, and takes up a pane in the workspace.
At the moment, we are able to access objects, graphs, etc. with the View() command when we have the session viewer enabled. In vscode-julia, when you click on, for example, a dataframe, it opens up the dataframe in the active panel. I think we could have a similar thing, where objects can be opened by clicking them in the "workspace viewer", so that we can easily and quickly move between examining objects, functions, etc. It could be it calls a View() command in the active R terminal when you click on the object.
Overall, I think what is missing right now is:
- Workspace viewer that updates without reload
- It could be that when a variable is defined (or re-defined), the workspace viewer is updated
- Ability to preview environment objects by clicking them in the workspace viewer
- Workspace viewer contained within sidebar area to not take up space
Describe alternatives you've considered
If the dataframe from the View(globalenv() was updated following an object being defined, it could act as a simple environment viewer.
The View() command can be bound to a keybind in order to offset typing, and can be used with objects selected in order to speed this up even more. However, it does not offset the fact that it must be run at all, as a live workspace would remove this step.
Additional context
Here is the julia workspace preview, indicated by the red arrow:

Here is a small mockup I made for example:
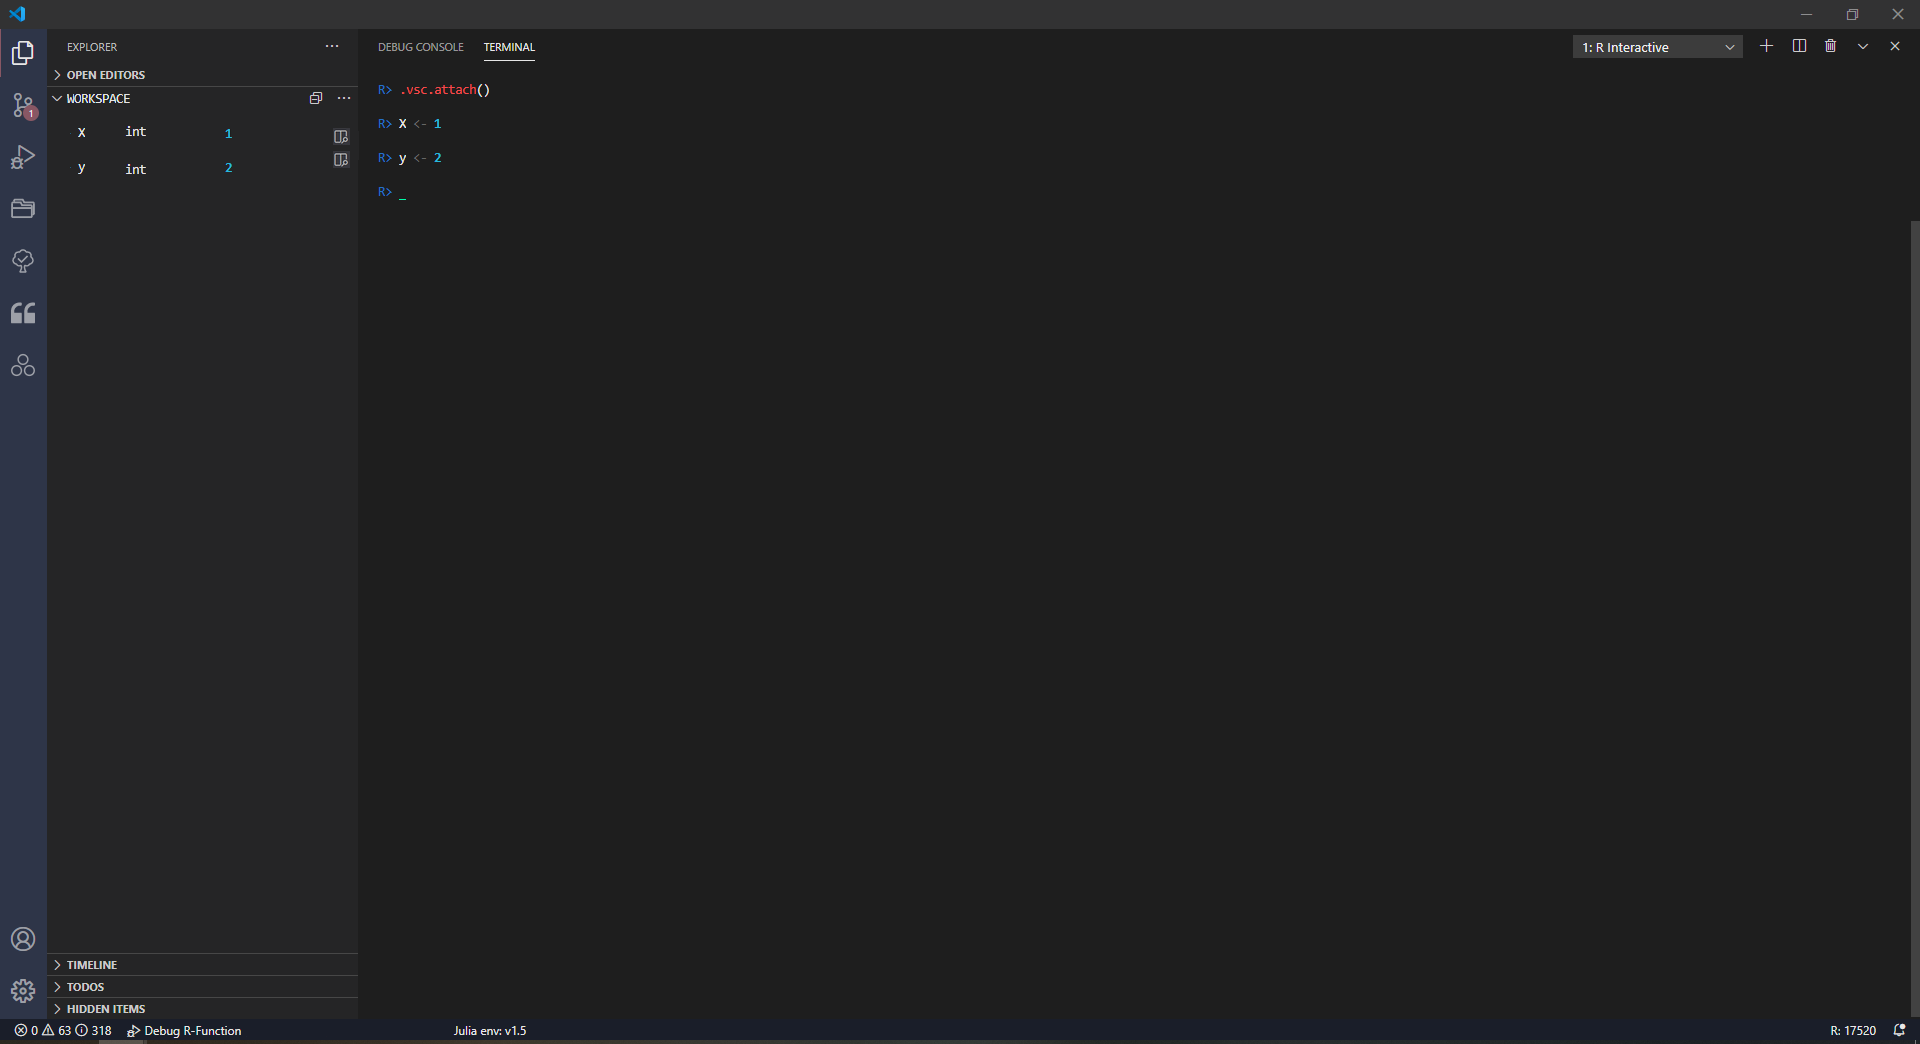
 ElianHugh
All 9 comments
I've been working on a debugger recently which includes a variable viewer for the active debug session. It's not quite what you described, but using "debugMode": "workspace" and checking the variable view of the dummy frame Global Workspace looks similiar to your mockup. This is a bit of a workaround though, since vs code's debug adapter is not meant for "session-watcher-like behaviour", so a proper workspace watcher would still be nice to have.
 ManuelHentschel
on 5 Oct 2020
ManuelHentschel
on 5 Oct 2020
I've been looking into this a little bit and I think what could be done is we use the tree view API to create the viewer. If we exported/used the globalenv json from session.ts, we could import it into a "workspace.ts" and populate the treeview with its information. I've noticed that globalenv.json is auto updated by session.ts so there shouldn't be much of a problem with keeping the workspace up to date.
I think the main issue would be tying it to the view command? I'd be interested in fiddling around with this, but I'm very much a beginner with TypeScript/JS so development could be slow!
ElianHugh
on 24 Nov 2020
I think the main issue would be tying it to the view command?
Do you mean triggering the tree view with the R command View etc.? That shouldn't be difficult using the existing communication mechanism between R and vscode used e.g. here. Or do you mean something different?
On a side note: PR #141 at the debugger adds an experimental background-attach functionality that might be interesting as well.
ManuelHentschel
on 24 Nov 2020
I think the main issue would be tying it to the view command?
Do you mean triggering the tree view with the R command
Viewetc.? That shouldn't be difficult using the existing communication mechanism between R and vscode used e.g. here. Or do you mean something different?On a side note: PR #141 at the debugger adds an experimental background-attach functionality that might be interesting as well.
Ah - I didn't know about that! That makes things a lot easier re: attaching commands to the viewer.
I've fiddled around a bit, but have had difficulty in activating the view when testing in a vscode-r repo. If I try an empty repo it works fine. I think it might have something to do with the activate function being asynchronous?
The background attach is interesting! Is there much of an overhead in running it?
ElianHugh
on 27 Nov 2020
I've fiddled around a bit, but have had difficulty in activating the view when testing in a vscode-r repo. If I try an empty repo it works fine. I think it might have something to do with the activate function being asynchronous?
No idea, if you upload the code I could take a look
The background attach is interesting! Is there much of an overhead in running it?
I ran a small test with a file tmp.R containing the following:
N <- 1e8

t0 <- as.numeric(Sys.time())

for(i in 1:N){}

t1 <- as.numeric(Sys.time())
print(t1-t0)
Results are:
D:\Documents\Projekte\vscode\RTools\vscDebugger>R --silent
> source('tmp.R') # no websocket at all:
[1] 0.7214899

> vscDebugger::.vsc.startWebsocket()
Starting server on port: 18721

> source('tmp.R') # no debug session attached:
[1] 0.9104981

> source('tmp.R') # with an attached debug session:
[1] 5.061661

> source('tmp.R') # after disconnecting the debug session again:
[1] 5.072534
Error in structure(.External(.C_dotTclObjv, objv), class = "tclObj") : # will have to fix this...
  [tcl] can not find channel named "sock000000002140E440".
There definitely is some very significant overhead in this example, though I don't know how more realistic computations behave.
The disconnect doesn't seem to work properly yet, but it should be possible to get back to the performance of the second run (running websocket, no debug session)
ManuelHentschel
on 27 Nov 2020
I've made some significant progress that I thought might be interesting.
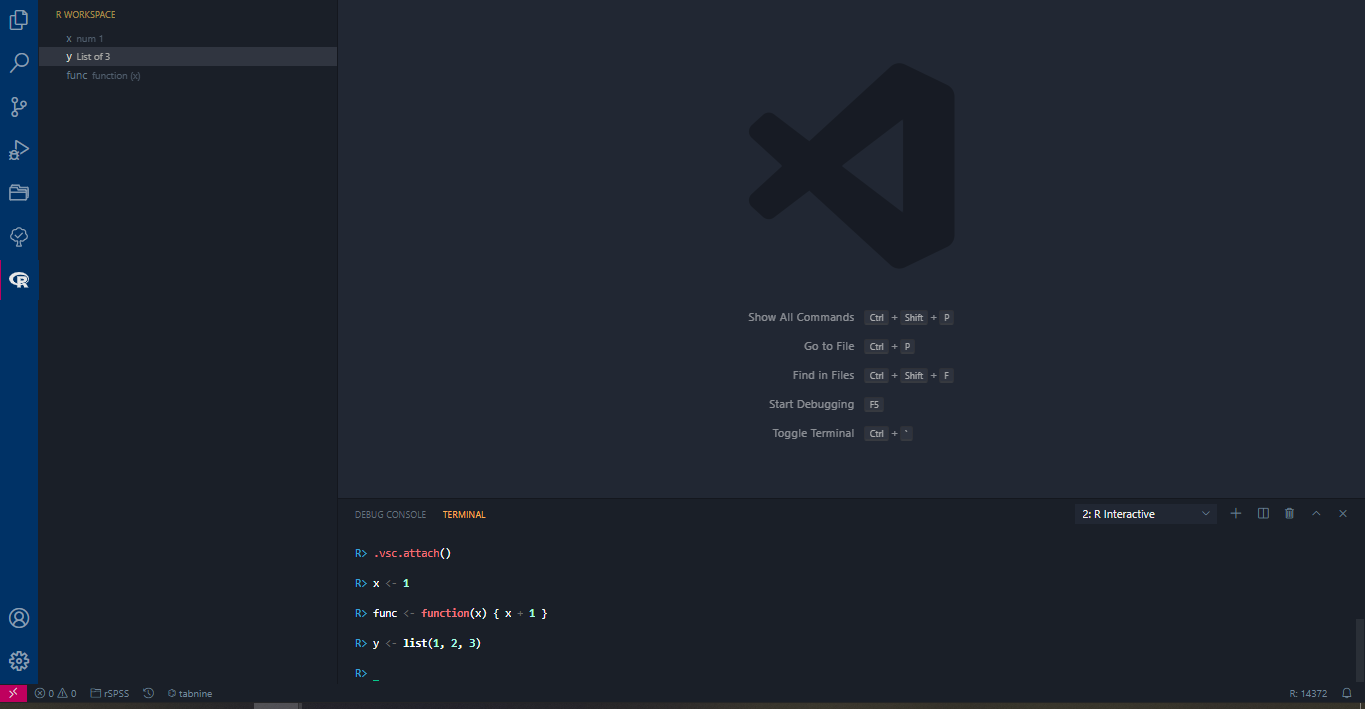
Workspace is tied into globalenv so it updates on the fly. I'm not 100% what information should be displayed, so I've settled for the key and str output for the time being.
I've yet to add the View() on click command but that should be easy enough (I hope).
No idea, if you upload the code I could take a look
Turns out there was a tiny typo breaking the whole thing... :) Thank you though!
I ran a small test with a file
tmp.Rcontaining the following:N <- 1e8 t0 <- as.numeric(Sys.time()) for(i in 1:N){} t1 <- as.numeric(Sys.time()) print(t1-t0)Results are:
D:\Documents\Projekte\vscode\RTools\vscDebugger>R --silent
> source('tmp.R') # no websocket at all:
[1] 0.7214899

> vscDebugger::.vsc.startWebsocket()
Starting server on port: 18721

> source('tmp.R') # no debug session attached:
[1] 0.9104981

> source('tmp.R') # with an attached debug session:
[1] 5.061661

> source('tmp.R') # after disconnecting the debug session again:
[1] 5.072534
Error in structure(.External(.C_dotTclObjv, objv), class = "tclObj") : # will have to fix this...
  [tcl] can not find channel named "sock000000002140E440".
There definitely is some very significant overhead in this example, though I don't know how more realistic computations behave.
The disconnect doesn't seem to work properly yet, but it should be possible to get back to the performance of the second run (running websocket, no debug session)
Interesting! Perhaps it would be useful for unobtrusive command calls, e.g. the IDE calling View() without littering the terminal?
ElianHugh
on 28 Nov 2020
I have now implemented view, manual refresh, and environment clearing. I wanted to add memory allocation like RStudio has, but I don't think that it's a necessity. Below is how it is currently functioning:

Once I'm happy with it, I could set up a PR? I currently have it on a fork (https://github.com/ElianHugh/vscode-R), which seems to be working on Windows. I'm not sure how this would interact with remote setups (I have yet to test WSL), presumably a globalenv file exists for these?
Aside from that, are there any features that people think is missing?
ElianHugh
on 29 Nov 2020
@ElianHugh Thanks for working on this. Your demonstration already looks good.
Once I'm happy with it, I could set up a PR?
Of course, you could send a PR now.
I'm not sure how this would interact with remote setups (I have yet to test WSL), presumably a globalenv file exists for these?
It should work out-of-the-box under remote development.
 renkun-ken
on 29 Nov 2020
renkun-ken
on 29 Nov 2020
@ElianHugh This is awesome. I just tested on WSL it works exactly the same as your GIF. VSCode remote extensions is quite robust usually it 'just works'.
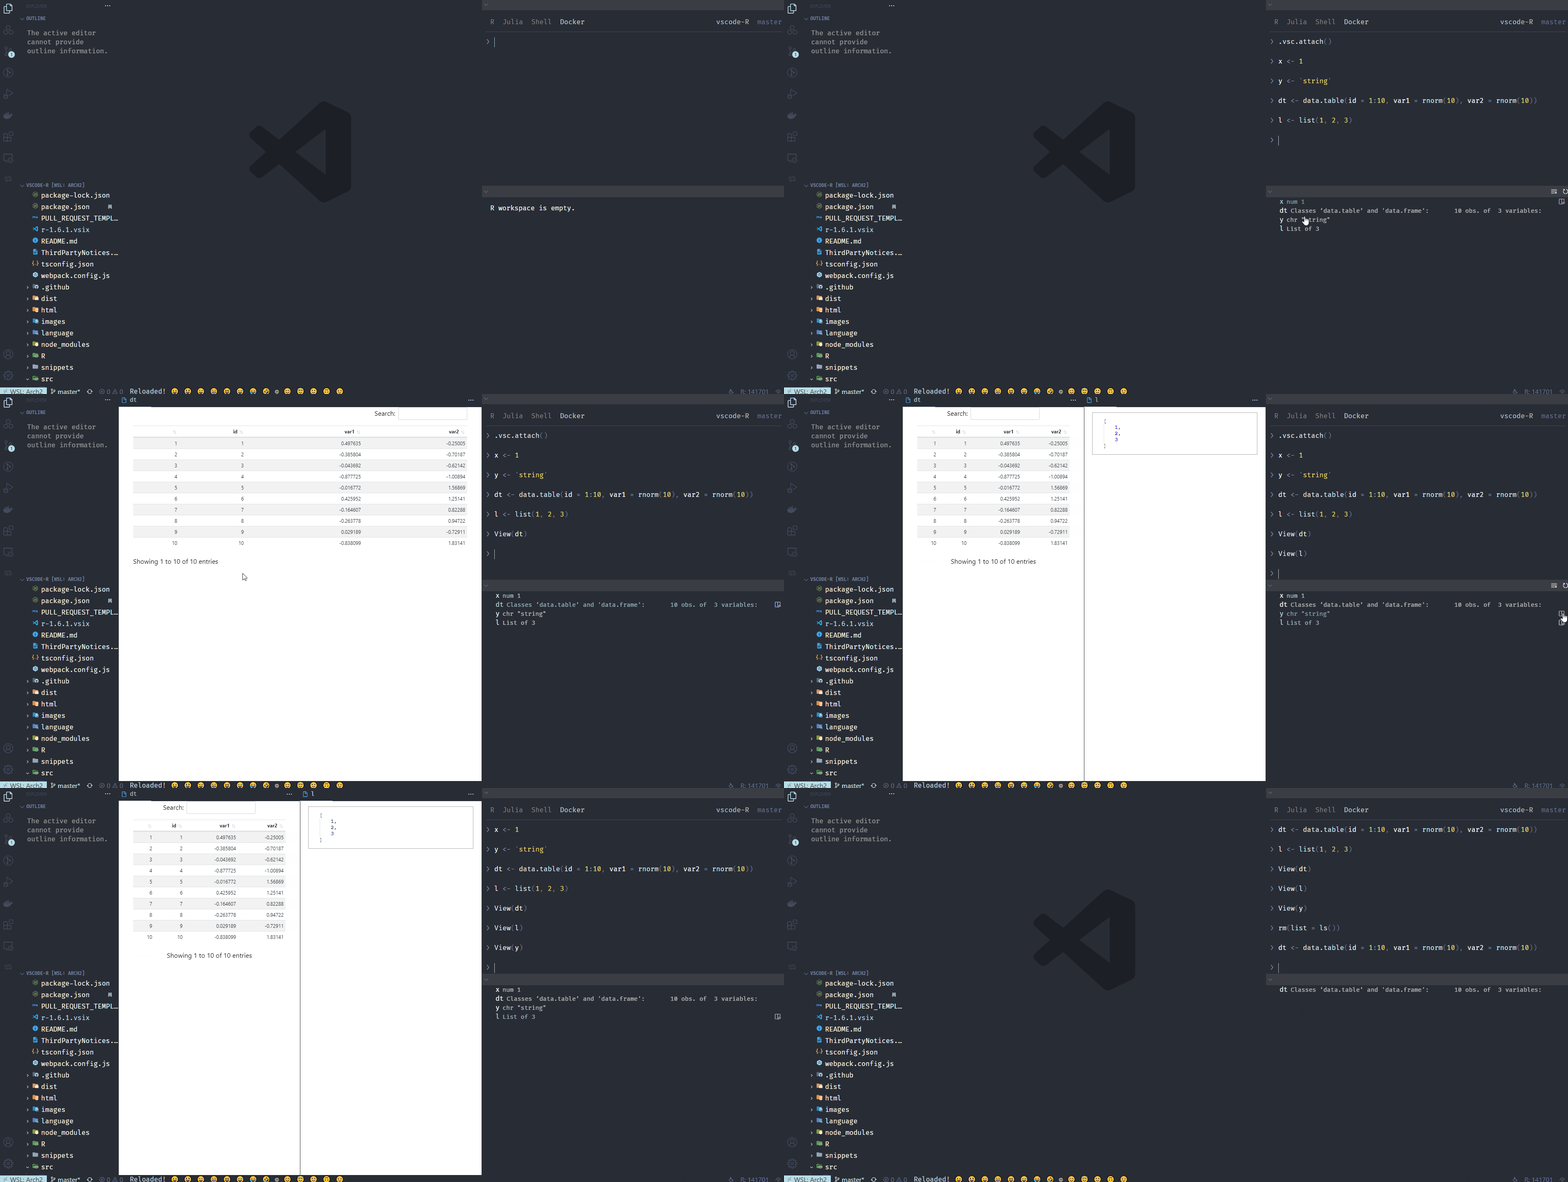
 kar9222
on 29 Nov 2020
kar9222
on 29 Nov 2020
Related issues
 Kalaschnik
·
4Comments
Kalaschnik
·
4Comments
 michaelHL
·
3Comments
michaelHL
·
3Comments
 andycraig
·
4Comments
andycraig
·
4Comments
 LePeti
·
4Comments
LePeti
·
4Comments
 bdeshon
·
3Comments
bdeshon
·
3Comments
Most helpful comment
I have now implemented view, manual refresh, and environment clearing. I wanted to add memory allocation like RStudio has, but I don't think that it's a necessity. Below is how it is currently functioning:
Once I'm happy with it, I could set up a PR? I currently have it on a fork (https://github.com/ElianHugh/vscode-R), which seems to be working on Windows. I'm not sure how this would interact with remote setups (I have yet to test WSL), presumably a globalenv file exists for these?
Aside from that, are there any features that people think is missing?