Vscode-r: Possibility to run R script with breakpoints
- VSCode Version: Version: 1.27.2
- VSCode-R Version: 0.6.1
- OS Version: Ubuntu 16.04 LTS
Steps to Reproduce:
None
Do you want to fix by self? (I hope your help!)
No
(If yes,) what kind of help do you want? (e.g. Which file should I fix, Survey (related documents)
This is not bug report. I that possible to run R in debug mode with breakpoints?
If not could you be so kind to add this feature?
(If related)setting.json
// R.exe path for windows
"r.rterm.windows": "C:\\Program Files\\R\\R-3.4.4\\bin\\x64\\R.exe",

// R path for Mac OS X
"r.rterm.mac": "/usr/local/bin/R",

// R path for Linux
"r.rterm.linux": "/usr/bin/R",

// R command line options (i.e: --vanilla)
"r.rterm.option": [],

// An optional encoding to pass to R when executing the file, i.e. 'source(FILE, encoding=ENCODING)'
"r.source.encoding": "UTF-8",

// Keeping focus when running
"r.source.focus": "editor",
Thanks for attention to my message and have a nice day.
 Sabutobi
All 21 comments
The extension doesn't give you the full debugging capabilities built into VS Code, but you can always add a browser() call to your script and you will be R's debug mode in the interactive terminal when you reach that point in the script.
 jacob-long
on 20 Sep 2018
jacob-long
on 20 Sep 2018
@jacob-long
Thanks for answering. I'm just interesting about that. Have a nice day.
Sabutobi
on 20 Sep 2018
Would be really interested in debugging functionality for R. It is listed as a TODO, is there any update on this? Thank you!
 explodecomputer
on 2 Dec 2019
explodecomputer
on 2 Dec 2019
I'm digging into this topic using the file-based approach suggested in #143. If we can inject hook functions in browser mode so that each action (such as continue, step in, etc.) can trigger the hook function, we can write out session and breakpoint information to debugger through DAP. So far I have not found any easy way to do that. Maybe we have to look at how RStudio does it and it is best that we don't have to hack too much into R internals.
 renkun-ken
on 2 Dec 2019
renkun-ken
on 2 Dec 2019
I believe RStudio uses a client/server approach, with the R session running in the server, so they have more access to the session. It looks like they directly inject a trace into the code:
 andycraig
on 3 Dec 2019
andycraig
on 3 Dec 2019
@andycraig, yes, utils::setBreakPoint does similar things, we can set a break point where the trace function can be specified to write out the code location before calling browser() so that the vscode debugger could caputure it. But so far I haven't found any callbacks if user hit next step, step into, and continue. If we could make these actions trigger some callback, we can also write out the code location to be caputured outside by debugger. I'm doing some experiment and see if we can caputure the code location change in browser mode.
renkun-ken
on 3 Dec 2019
In VSCode, debugging runs in a fresh session on each start debugging. We only have to translate debugger action to stdin and capture stdout and stderr from the R process. The code location is clearly printed out on each code location change.
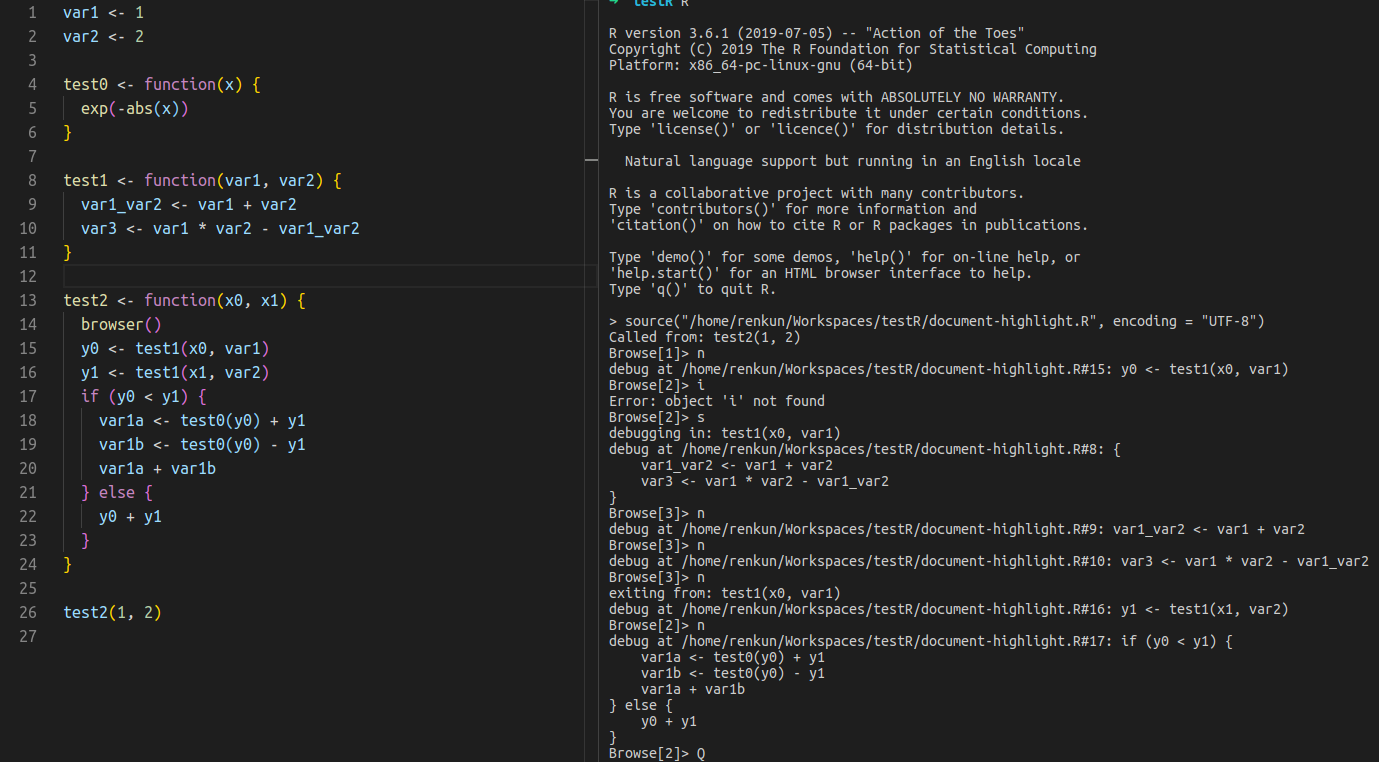
For debugging in user code in vscode, I believe it is mainly about implementing an DAP-compliant adapter that communicates with R through std in/out/err. However, there are some tricky parts:
- If user chooses to step into R package code, the R code does not seem to have a file-based location.
- To extract values of variables at break point, we can send
ls.str()on each break which will force evaluation of promises. We may usepryr::promise_info()to avoid force evaluation.
renkun-ken
on 3 Dec 2019
@renkun-ken This is sounding promising!
When the user sets a breakpoint in VSCode, is the idea that utils::setBreakPoint or trace would be sent to the R console to get it into the R session?
andycraig
on 4 Dec 2019
@jacob-long
In your reply you stated:
The extension doesn't give you the full debugging capabilities built into VS Code, but you can always add a
browser()call to your script and you will be R's debug mode in the interactive terminal when you reach that point in the script.
Could you explain in more detail how do to that in a minimal example?
I'd naively imagine the following (consider some example R-code):
...
bla <- list(1,2,3)
...
At first, set a breakpoint at the line containing "bla <- list(1,2,3)" via left-click on the left-hand side of the editor.
Secondly, insert the command "browser()" as a newline before or after that line in question, e.g.:
...
browser()
bla <- list(1,2,3)
...
Finally, start the debugging session via F5 of the currently opened file?
But even then, the question would be with which configuration within the launch.json - file I should start this debugging session? I cannot just use my python-debugger etc.
Thanks in advance for clarifying this with more details.
 AndreasLuckert
on 18 Dec 2019
AndreasLuckert
on 18 Dec 2019
@AndyLuckert we haven't yet implemented a debugging server that is compliant with Debug Adapter Protocol to work with R and VSCode. That's why you can't find a debugger in VSCode to launch an R session to debug a script.
When you hit F5 you enter the VSCode deubgging session only when a debugger that implements DAP for R is provided. Unfortunately, we don't have one at the moment. And we are trying to figure out a way to implement one in the future.
R's native debugger works in pure command line. When you call browser() in any part of your code, the interpreter enters a browser mode in which you can inspect the current environment using R functions such as ls(), ls.str(), and you can also navigate the debugger using some specialized commands such as next statement, step into, etc. Please see https://stat.ethz.ch/R-manual/R-devel/library/base/html/browser.html for more details.
The debugger we are trying to implement to work with R and VSCode is probably through such an interface.
renkun-ken
on 18 Dec 2019
That sounds good, that you're planning/working on the future implementation of a proper R-debugger!
I've just tried to implement this browser()-approach in an R-script I'd like to debug:
# Load MixSIAR package
library(MixSIAR)

# To run on your data, replace the system.file call with the path to your file
mix.filename <- system.file("extdata", "wolves_consumer.csv", package = "MixSIAR")

# Load mixture data
mix <- load_mix_data(filename=mix.filename,
                     iso_names=c("d13C", "d15N"),
                     factors=c("Region", "Pack"),
                     fac_random=c(TRUE, TRUE),
                     fac_nested=c(FALSE, TRUE),
                     cont_effects=NULL)

browser() # opens debugging session
...
more code
As you can see, I've inserted "browser()" into the script at a specific code-line.
Next, I ran it in my bash-terminal via the following command:
Rscript /usr/local/lib/R/site-library/MixSIAR/example_scripts/mixsiar_script_wolves.R
Unfortunately, nothing happened. The script was just running through without stopping at the point where I put browser, nor was there any reaction regarding this additional code-line whatsoever.
What I aim for is putting kind of a break-point within an R-script, as I'm used to do that with python, and from that breakpoint on go through the code step by step, with the possibility of stepping into functions.
If this is possible with "browser()", I'd like to learn how.
Thanks again in advance.
AndreasLuckert
on 18 Dec 2019
@AndyLuckert Rscript starts an non-interactive R session where browser() does not interrupt the session to enter the debugging mode. You may try the following:
- Start an interactive R session using
R, and you can either send code line by line to R terminal orsource("your-code.R"). When your code hit abrowser(), it will enter the debugging mode for you and look around. You shouldn't send all code to R terminal manually since when the R session is interrupted bybrowser(), the code following is still sent to terminal to mess up. - Or start a
radianconsole which has better handling ofbrowser()interruption. You can send line by line, source the file, all send all lines, all work fine.
renkun-ken
on 18 Dec 2019
Alright, thanks! I'll try it out when I get to it.
AndreasLuckert
on 19 Dec 2019
I've been working on an R debugger recently, following the same approach as @renkun-ken described. Since this approach is quite different from the current R extension, I decided to do so in a new project. If you have the time to try the debugger, I would appreciate any feedback :)
https://github.com/ManuelHentschel/VSCode-R-Debugger
https://github.com/ManuelHentschel/vscodeRPackage
 ManuelHentschel
on 18 May 2020
ManuelHentschel
on 18 May 2020
@ManuelHentschel Thanks for sharing your work on R debugger!
I tried it but does not manage to make it work on macOS with the following error:

Am I missing something?
renkun-ken
on 19 May 2020
In this step the extension tries to start a terminal/shell process in which to run the R session.
The path to the terminal is retrieved from the setting "terminal.external.osxExec" and displayed as "terminalPath: ..." in the debug console (in the collapsed content of the "Starting R Session..." entry).
I sometimes needed to restart vscode for changes to this setting to take effect.
If the correct path is used, maybe try a different shell?
So far I have got this to work with bash on linux and cmd.exe on windows, but had no opportunity yet to test it on a mac.
ManuelHentschel
on 19 May 2020
@ManuelHentschel Looks like the default setting
"terminal.external.linuxExec": "x-terminal-emulator"
is not a valid path for you to run. I change it to /bin/bash and the debugger now works under Ubuntu and macOS.
Great work! It's quite exciting to see what can be done to make both extensions work well with each other.
renkun-ken
on 19 May 2020
Thanks a lot for figuring that out!
I guess I'll put these paths into their own config entries and try to make the "Terminal path not valid!" message more specific :)
ManuelHentschel
on 19 May 2020
@ManuelHentschel Thanks for your nice work in the R debugger for VSCode projects. It looks like the R code in vscDebugger could be largely improved. Would you mind if I participate in your debugger projects, give suggestions and contribute code?
renkun-ken
on 22 May 2020
@renkun-ken Sure, I would gladly appreciate any help :)
I just pushed some significant changes to the development branch of the R package, so be sure to pull those before you start coding yourself.
ManuelHentschel
on 22 May 2020
Closing as there's VSCode-R-Debugger.
renkun-ken
on 24 Nov 2020
Related issues
andycraig
·
4Comments
 albert-ying
·
5Comments
renkun-ken
·
3Comments
albert-ying
·
5Comments
renkun-ken
·
3Comments
 MaTo04
·
5Comments
MaTo04
·
5Comments
 Kalaschnik
·
4Comments
Kalaschnik
·
4Comments