Vscode-powershell: VSCode stops processing 'Start Debugging'
Issue Description
I am experiencing a problem with... F5 ('Start Debugging') stopping to work very often. Last few weeks it has been stopping all the time. I am not sure if the logs are of any help thou. I have to restart PowerShell session or use F8.
Attached Logs
Follow the instructions in the README about
capturing and sending logs.
1568380290-e5000958-344d-442c-be6c-5a263b8675e61568354258606.zip
Environment Information
Visual Studio Code
| Name | Version |
| --- | --- |
| Operating System | Windows_NT x64 10.0.18362 |
| VSCode | 1.38.1|
| PowerShell Extension Version | 2019.5.0 |
PowerShell Information
|Name|Value|
|---|---|
|PSVersion|5.1.18362.145|
|PSEdition|Desktop|
|PSCompatibleVersions|1.0 2.0 3.0 4.0 5.0 5.1.18362.145|
|BuildVersion|10.0.18362.145|
|CLRVersion|4.0.30319.42000|
|WSManStackVersion|3.0|
|PSRemotingProtocolVersion|2.3|
|SerializationVersion|1.1.0.1|
Visual Studio Code Extensions
Visual Studio Code Extensions(Click to Expand)
|Extension|Author|Version|
|---|---|---|
|auto-rename-tag|formulahendry|0.1.0|
|beautify|HookyQR|1.5.0|
|bracket-pair-colorizer-2|CoenraadS|0.0.28|
|code-settings-sync|Shan|3.4.2|
|gitlens|eamodio|9.9.3|
|html-css-class-completion|Zignd|1.19.0|
|live-html-previewer|hdg|0.3.0|
|markdown-all-in-one|yzhang|2.4.2|
|markdown-preview-enhanced|shd101wyy|0.4.3|
|markdown-shortcuts|mdickin|0.11.0|
|material-icon-theme|PKief|3.9.0|
|powershell|ms-vscode|2019.5.0|
|project-manager|alefragnani|10.7.0|
|theme-monokai-pro-vscode|monokai|1.1.14|
|vscode-html-css|ecmel|0.2.3|
|vscode-wakatime|WakaTime|2.2.0|
|xml|DotJoshJohnson|2.5.0|
 PrzemyslawKlys
All 78 comments
Thanks for opening an issue @PrzemyslawKlys. Can I ask what you mean by "stopping" here? Would you be able to attach a GIF maybe of the process occurring? Is it a crash, or is debugging just ending unexpectedly? Or is it hanging?
There's a strange sequence I've observed in some logs recently where VSCode sends us a debugger shutdown message. It's likely in response to something we do, but it's a new change in VSCode and we haven't worked out what's going on there yet.
 rjmholt
on 26 Sep 2019
rjmholt
on 26 Sep 2019
Generally it works in a way where I press F5 wait for script to finish, fix something, run again and again and randomly (sometimes after 2 minutes, sometimes after 2 hours) F5 just stops responding. Nothing is happening when pressed. You have to restart session to continue. But it's not crashed. Just not responding. To me it looks like I pressed F5 and it did register it and started executing in the background but it didn't inform the GUI and at that point The debug session is running on it's own. But that’s just a noob guess.
PrzemyslawKlys
on 27 Sep 2019
To me it looks like I pressed F5 and it did register it and started executing in the background but it didn't inform the GUI and at that point The debug session is running on it's own
Yeah that sounds familiar. Well @TylerLeonhardt's been working hard on some big changes here, so we should have something new to try in the next few weeks hopefully.
rjmholt
on 27 Sep 2019
I am also getting affected by this issue again; resulting in frequent "nostalgic" use of the ISE 😯
Is there a min version of PowerShell 5 we should be using?
ame                           Value
----                           -----
PSVersion                      5.1.18362.145
PSEdition                      Desktop
PSCompatibleVersions           {1.0, 2.0, 3.0, 4.0...}
BuildVersion                   10.0.18362.145
CLRVersion                     4.0.30319.42000
WSManStackVersion              3.0
PSRemotingProtocolVersion      2.3
SerializationVersion           1.1.0.1
 westerdaled
on 8 Oct 2019
westerdaled
on 8 Oct 2019
PowerShell 5.1 should work. What version of the .NET Framework do you have installed just so we know?
The next preview extension release will have the refactor that @rjmholt mentioned. I'd love to hear what you folks have to say when that drops.
 TylerLeonhardt
on 8 Oct 2019
TylerLeonhardt
on 8 Oct 2019
I can give it a go, however if it will have problems with PSReadline it's a bit useless.
PrzemyslawKlys
on 8 Oct 2019
PowerShell 5.1 should work. What version of the .NET Framework do you have installed just so we know?
The next preview extension release will have the refactor that @rjmholt mentioned. I'd love to hear what you folks have to say when that drops.
regedit HKEY_LOCAL_MACHINE\SOFTWARE\Microsoft\NET Framework Setup\NDP\v4\Full\1033 it show for Release key: 528040 which is .NET framework 4.8 ( probably through windows update) . I am happy to test the refactor ( hopefully PSReadline support is stable) . At the end of the day I just want to get to the bottom of the debug "suspended animation" I like others seem to be experiencing
westerdaled
on 9 Oct 2019
Ok just took a look through the logs again and it's not clear just yet what the issue is. We're hoping to get the new version of debugging stack out soon as a preview release (it's just waiting on some upstream logging work so we can find bugs better) so when that's out it may well solve this issue
rjmholt
on 10 Oct 2019
Yes that will be helpful. Tried to test new ( 3 line ps script) and had to give up debugging it in VScode because of this issue. Odd the issue occurs randomly.
Note sure if this is related but even after closing and restartng VScode, I am seeing this:

westerdaled
on 11 Oct 2019
Just to add a new version, preview one didn't fix the issue. I still press F5 and nothing happens. What's worse is that there's no progress anymore on PowerShell script (as in the bottom information that script is running is not there in preview - or at least it doesn't show very often).
PrzemyslawKlys
on 4 Nov 2019
@PrzemyslawKlys you prompted me to test out PowerShell Preview 2019.110 and for the first time
@rjmholt is the purpose of this release to instrument more granular logging within the extension rather than fix the "F5 freezing" issue?
westerdaled
on 4 Nov 2019
Purpose of the release is explained here.
@westerdaled are you experiencing the issue you describe here, or is it that you have completions and the integrated console but F5 doesn't work?
I still press F5 and nothing happens.
@PrzemyslawKlys do you mean F5 never works, or that it stops working after some time (as you reported initially).
Can you both please load the preview extension, try F5 and send through the logs?
rjmholt
on 4 Nov 2019
It works, randomly stops. But it didnt change at all.
PrzemyslawKlys
on 4 Nov 2019
But it didnt change at all
Ok good to know. I think I just managed to reproduce this as well, so we are a step closer fixing it (if I can hit it again).
rjmholt
on 4 Nov 2019
Ok, I think my repro of this only happens when I artificially stop PSES in the debugger, get the PS extension to stop debugging, and resume PSES. I'm not sure how this would occur in a normal scenario, but I can't reproduce it without the debugger.
When I did get it into that state, we don't even get to the point of handling the initialize message. So this might be something we need to fix in Omnisharp.
rjmholt
on 4 Nov 2019
@westerdaled when you describe something showing the script running in the footer bar (VSCode's status bar) what do you mean?
rjmholt
on 5 Nov 2019
@rjmholt In stable there's a spinning arrow when a script is running:

but preview doesn't show this:

Interestingly it doesn't show that in 2019.9.0 either and apparently I never noticed it was missing.
 corbob
on 5 Nov 2019
corbob
on 5 Nov 2019
That's what I was thinking but wanted to be sure. I looked into this and from what I can tell we're sending the notifications properly and still have a handler registered. Need to investigate further.
rjmholt
on 5 Nov 2019
@rjmholt
What I mean is when I press F5 the debugger launches but doesn't move to first breakpoint and the top toolbar displays a limited number of menu items.
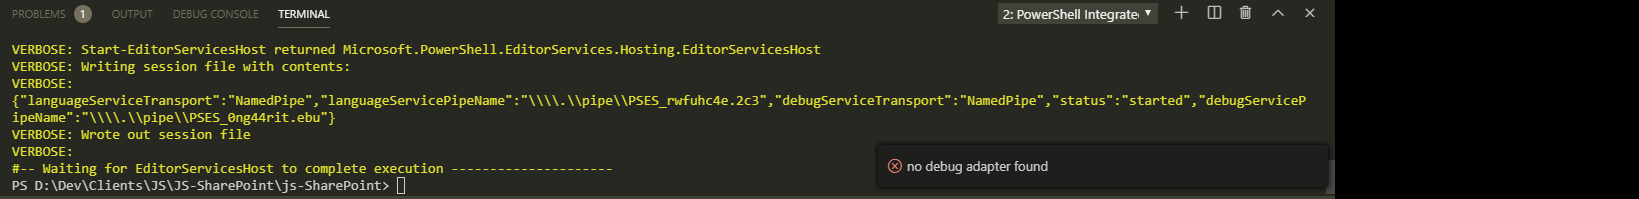
Prior to this state, I did notice this error message

Readline support works fine so no issues there.
Sorry about the confusing message re the toolbar , please ignore that. Also, I have set diagnostic level logging.
westerdaled
on 5 Nov 2019
Having the same issue in interactive mode. When pressing F5 nothing happens. The status bar gets orange but the file is not executed it appears and it stays like this forever.
Usually a restart of vscode or using the trash bin on the terminal and have it restarted fixes issues like these. But that doesn't seem to be the case now. I have no valid workaround to use the interactive mode of vscode at the moment.
This is only happening since the last update (of the PowerShell Preview extension 2019.11.0 and/or vscode-insders).
Version: 1.40.0-insider (user setup)
Commit: d39e6b396c3ea364584126316a0fcf30f9cb378e
Date: 2019-11-05T02:01:04.347Z
Electron: 6.1.2
Chrome: 76.0.3809.146
Node.js: 12.4.0
V8: 7.6.303.31-electron.0
OS: Windows_NT x64 6.2.9200
Log files added:
logs.zip
 DarkLite1
on 5 Nov 2019
DarkLite1
on 5 Nov 2019
Having the same issue in interactive mode
You mean the PowerShell Interactive Mode launch configuration? If so, that's the expected behavior. For interactive mode, we give you the ability to run your script in the console and then breakpoints will be hit.
TylerLeonhardt
on 5 Nov 2019
I mean when pressing F5, that's how I usually launch the current pester test file. I didn't thinker with config files... The thing is, this way of working was not an issue before and now it doesn't function anymore.
DarkLite1
on 5 Nov 2019
@TylerLeonhardt Surely the aim is replicate the user experience in ISE where I can edit and debug the script in the editor pane. This is great for building and testing private helper functions. Agreed, calling the same script from the console is handy , say when passing in parameter values. Therefore, I would hope both scenarios will have the same level of support going forward.
westerdaled
on 5 Nov 2019
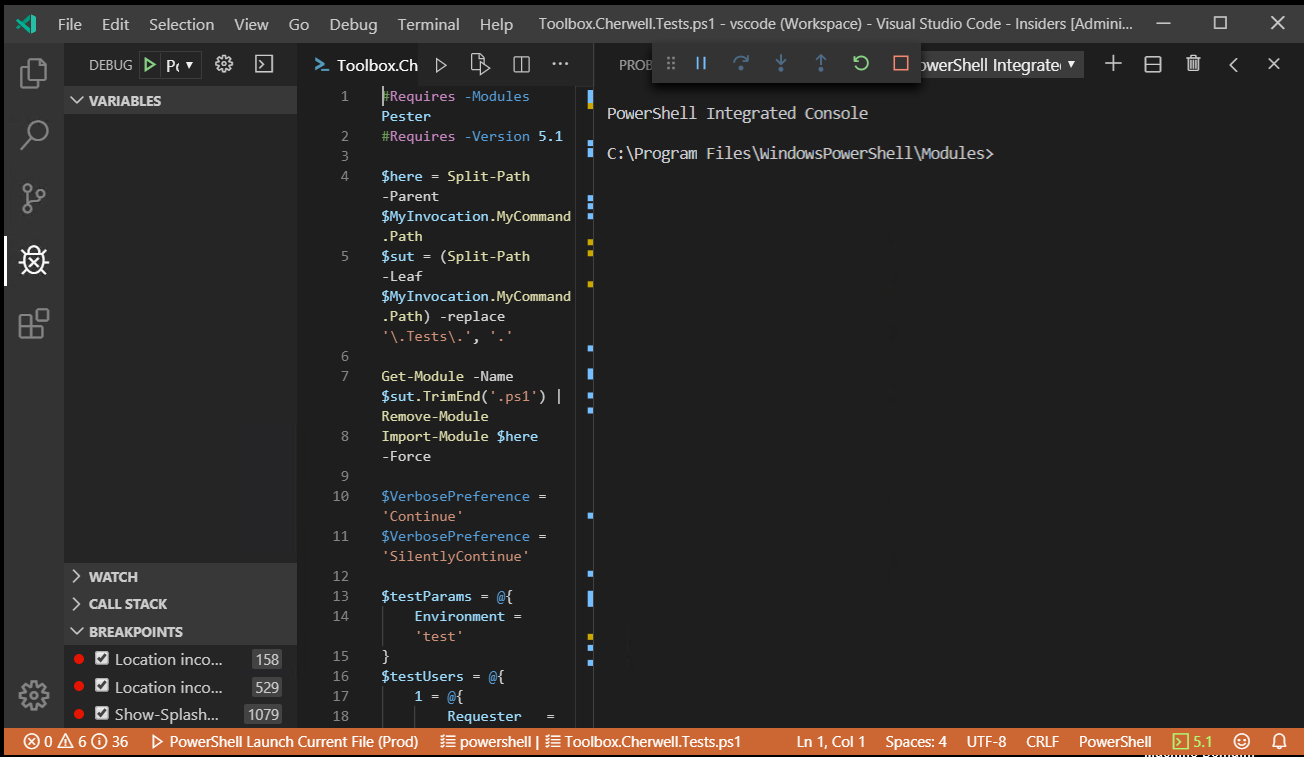
@DarkLite1 can you share your debug pane in vscode?
TylerLeonhardt
on 5 Nov 2019
@westerdaled yes both experiences are there, but the "PowerShell Interactive Mode" launch config is typically used for debugging _modules_ and typically isn't used for launching scripts.
You would use the "PowerShell Launch Current File" launch config which will launch the file you're looking at. This is the default behavior.
TylerLeonhardt
on 5 Nov 2019
@TylerLeonhardt Agreed I have just been looking a the debug configurations. Maybe VSCode is not able load this
westerdaled
on 5 Nov 2019
@DarkLite1 can you share your debug pane in vscode?
It says PowerShell Launch Current File (Prod), the same as is displayed in the status bar in orange in my initial screenshot. Here is the content of launch.json if it might help:
{
    "version": "0.2.0",
    "configurations": [
        {
            "type": "PowerShell",
            "request": "launch",
            "name": "PowerShell Launch Current File",
            "script": "${file}",
            "args": [],
            "cwd": "${file}"
        },
        {
            "type": "PowerShell",
            "request": "launch",
            "name": "PowerShell Launch Current File in Temporary Console",
            "script": "${file}",
            "args": [],
            "cwd": "${file}",
            "createTemporaryIntegratedConsole": true
        },
        {
            "type": "PowerShell",
            "request": "launch",
            "name": "PowerShell Launch Current File w/Args Prompt",
            "script": "${file}",
            "args": [
                "${command:SpecifyScriptArgs}"
            ],
            "cwd": "${file}"
        },
        {
            "type": "PowerShell",
            "request": "attach",
            "name": "PowerShell Attach to Host Process",
            "processId": "${command:PickPSHostProcess}",
            "runspaceId": 1
        },
        {
            "type": "PowerShell",
            "request": "launch",
            "name": "PowerShell Interactive Session",
            "cwd": "${workspaceRoot}"
        }
    ]
}
I develop on a daily basis PowerShell scripts for our company and I almost never call a script from the console. Usually I just press F5 to launch the accompanying Pester test file I wrote. This will immediately find all issues and is a really neat and fast way of running/debugging the scripts.
Thank you for not removing this feature.
DarkLite1
on 6 Nov 2019
@DarkLite1 it looks like there's nothing special in your launch.json. Can you delete it and try debugging again?
Also, you said you use this to debug a Pester file? Can you elaborate on how you do that?
TylerLeonhardt
on 6 Nov 2019
As described in #2289 you can try to reproduce it with:
for ($i = 0; $i -lt 10; $i++) {
    'test'
}
and setting breakpoint to test. I have 90% success right on hanging VSCode with this one.
PrzemyslawKlys
on 6 Nov 2019
@PrzemyslawKlys are you launching with F5? Any breakpoints set?
rjmholt
on 6 Nov 2019
In PowerShell 5.1?
rjmholt
on 6 Nov 2019
Yes, 5.1, a breakpoint set at 2nd line (as shown and described in other thread). But was using Preview version. Haven't tested in standard yet.
PrzemyslawKlys
on 6 Nov 2019
Thanks! Preview's where I'm hoping to fix it.
rjmholt
on 6 Nov 2019
Still not able to put the debugger into the hang state it seems. Both repeatedly starting and stopping (pressing F5 constantly) and stepping over/in. Hopefully this isn't something that depends on machine state or OS version.
rjmholt
on 6 Nov 2019
Are you testing it straight after starting vscode? It seems to work fine if I run other code and then run this one.
Any way I can help with debugging this? I can basically reproduce it now on work computer each time.
PrzemyslawKlys
on 6 Nov 2019
Maybe a remote session?
PrzemyslawKlys
on 6 Nov 2019
@DarkLite1 it looks like there's nothing special in your launch.json. Can you delete it and try debugging again?
Also, you said you use this to debug a Pester file? Can you elaborate on how you do that?
The weird thing is, after the weekend vscode-insiders updated itself and the problem seems to be gone. When I press F5 now the script is ran correctly. So it seems this must have been an issue in one of the previous vscode-insiders releases.
Currently perfect working version:
Version: 1.41.0-insider (user setup)
Commit: 0d728c31ebdf03869d2687d9be0b017667c9ff37
Date: 2019-11-12T05:39:58.193Z
Electron: 6.1.4
Chrome: 76.0.3809.146
Node.js: 12.4.0
V8: 7.6.303.31-electron.0
OS: Windows_NT x64 6.2.9200
What I mean with Pester is that I have one pester test file and one script file. The test file contains all the tests needed to verify if the script is doing what I want it to do. Sometimes, especially in the beginning, the test is written first in the pester test file and will fail. To remediate this I put a breakpoint in the production script, aka $sut and verify the code.
DarkLite1
on 12 Nov 2019
I have just upgraded to VSCode Version: 1.4.0 so in theory, I may still have this issue. Is there a public test script and pester test we should all be using to verify that issue does, or doesn't exist on our version of VSCode
Test script
for ($i = 0; $i -lt 10; $i++) {
    'test'
}
Pester script ?
westerdaled
on 12 Nov 2019
@PrzemyslawKlys if you're able to upgrade your version of VSCode, can you see if this issue reproduces in the latest VSCode version? It's possible the issue lies with VSCode's debugging client. I'll see if I can reproduce it with VSCode 1.38.
rjmholt
on 12 Nov 2019
I always run current version (not insiders). Last few days got only 3 “crashes” but I am working mostly on home pc.
It happens so randomly...
If you can provide any tips what we can do to catch logs/issue when it happens I will be happy to provide.
PrzemyslawKlys
on 13 Nov 2019
For me this happened consistently on Version: 1.40.0-insider (user setup), the later version Version: 1.41.0-insider (user setup) fixed it.
To reproduce the issue it was sufficient to press F5 on an active PowerShell script in the editor pane. Usually this would be one Pester test file calling another .ps1 file.
DarkLite1
on 13 Nov 2019
Just tried this with VSCode 1.35, 1.39 and 1.40 and can't reproduce anywhere... Want to keep trying to investigate since this issue concerns me.
@PrzemyslawKlys for the logging, if you capture diagnostic logs, we might be able to work out where the messages are going bad. To get the message logs, see here.
rjmholt
on 13 Nov 2019
OMG, I finally found a consistent way of reproducing this issue. At least I hope it's the same issue you guys have in this thread. So, here's the process to reproduce it:
- Create 3 files:
File1.ps1contains code with no breakpoint (Ex.Get-Process)
File2.ps1contains code with a breakpoint (Ex.Start-Sleep -Seconds 1, breakpoint line 1)
File3.ps1contains code with a breakpoint (Ex.Start-Sleep -Seconds 1, breakpoint line 1) - When all 3 files are open in the editor pane and
File1.ps1is focused pressF5
Notice thatGet-Processis executed correctly and all processes are retrieved - Press
F5again and notice thatGet-Processis not executed, an orange bar is displayed at the bottom and the debug panel to stop debugging is floating at the top but doesn't respond to any clicks and stays there.
The only workarounds are:
- Close and reopen
vscode-insidersto have one other successful run - Remove all breakpoints in all other files
@rjmholt I hope you can simulate this properly now. I'm currently on:
Version: 1.41.0-insider (user setup)
Commit: eccf417b72fc0a632ec2cbd7855a681cdb8c81fa
Date: 2019-11-14T09:50:04.822Z
Electron: 6.1.4
Chrome: 76.0.3809.146
Node.js: 12.4.0
V8: 7.6.303.31-electron.0
OS: Windows_NT x64 6.2.9200
Thanks for that! Will have a play with that next week
rjmholt
on 15 Nov 2019
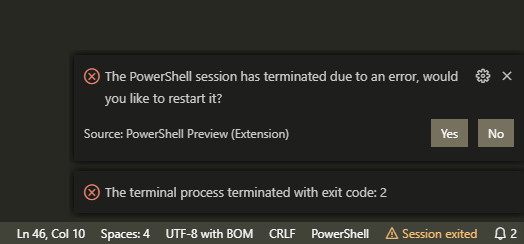
I'm not sure if this is the same issue I'm seeing, but all day today I've been running into an issue where it looks like it's started debugging, but nothing happens. If I focus PSIC and hit any key, I usually get an @ which might just be because I'm running preview. Then after a few seconds PSES crashes and I'm prompted to restart it. It happened most often when I had a breakpoint set, but also when I didn't.
I've captured the logs from the last time it happened, and there is a stack trace in there.
Here are my lightly sanitized logs.
EditorServices.log
vscode-powershell.log
Start-EditorServices-EditorServices.log
corbob
on 15 Nov 2019
1573857372-d90509aa-21ce-4490-9984-6615499b941e1573857370506.zip
Here's my new log. Standard - pressed F5 - saw Powershell running for like 1 second and died out.
PrzemyslawKlys
on 15 Nov 2019
1573858209-d85dbb5b-1411-4b11-ae7f-cc14081c55a91573858207873.zip
Another log from different session - debug stopped.
PrzemyslawKlys
on 16 Nov 2019
@PrzemyslawKlys it would seem that both of those logs are from the PowerShell stable extension.
TylerLeonhardt
on 20 Nov 2019
@DarkLite1 I can repro that behavior more often than not so at least I have something to dig into! Thanks!
TylerLeonhardt
on 20 Nov 2019
Looking over this again - the original issue was for the stable extension... Let's do this. Keep this focused on @PrzemyslawKlys's issue... and @DarkLite1 if you don't mind making a new issue with that info, it'd help figure all this out.
I will say that @PrzemyslawKlys our primary focus is getting the Preview extension to a point where it will replace the stable extension so this issue is second to the issues you're having in Preview.
TylerLeonhardt
on 20 Nov 2019
@TylerLeonhardt yes, after working for a while with preview and hitting problems with things as simple as this
for ($i = 0; $i -lt 10; $i++) {
    'test'
}
I gave up and returned to PS Stable. I can go back to preview when you give me a working version with a fix for "@". The one in the thread is broken. That's why i requested for more frequent preview updates so I can actually provide new logs as they happen.
PrzemyslawKlys
on 20 Nov 2019
I'm experiencing something similar:
- Open a powershell file in a shared network drive.
- Start debugging.
- Do a
Invoke-WebRequestthat throws an error that we catch and have a breakpoint in the catch. - Stop debugging.
- Try and start debugging again. The debug controls in VSCode will show up and then go away without running/debugging the code.
 elonmallin
on 4 Dec 2019
elonmallin
on 4 Dec 2019
1575719398-3a9ac46c-aee5-49cb-b24a-b823387c5c811575713299571.zip
Here is newest log from Preview. Using vsix from https://github.com/PowerShell/vscode-powershell/issues/2292
I was debugging and it was stopped in the middle. I was copy pasting some stuff and suddnely noticed that debug is stuck and F5 doesn't work anymore.
PrzemyslawKlys
on 7 Dec 2019
During debugging F5 stopped working, vscode kinda freezed. After 30 seconds or so it crashed:
1575761206-b3aab8c0-1514-4065-969c-a8c020d06f321575761204714.zip
PrzemyslawKlys
on 8 Dec 2019
1576057499-3bbd4831-3ecb-48c6-9ea9-2447e387b8d71576057497288.zip
Another log from a recent crash. It appears to run with F5, stops, subsequent F5 not responding, finally crashes. Not sure if it's the same issue as the one in production version tho.
PrzemyslawKlys
on 12 Dec 2019
1576519162-8448b6cb-624d-4d0a-ab72-dd36de1bf0401576519160159.zip
And another. This time after less than 5 minutes.
PrzemyslawKlys
on 16 Dec 2019
@PrzemyslawKlys it would be good if it could be consistently reproduced. If there would be a way to do so it would be great to share that. It might help the devs to find a solution. Unless it;s happening totally at random of course.
DarkLite1
on 17 Dec 2019
It's random. Sometimes I can work for hours without this issue, sometimes right after start. I have no clue how to trigger this.
PrzemyslawKlys
on 17 Dec 2019
Could it be related to:
- Available resources on your system?
When the CPU is peaking? Or the RAM is getting above a threshold? - Does it happen when there are breakpoints set? Or only when there are none set? Or in both cases?
- Is it only happening when pressing
F5? Or also when you click the play icon?
What is your debug config? - Is it only happening in the
Previewversion? Or also in theStableversion? - Can you add a screenshot of the issue when it freezes? Is the small debug panel on top still there?
- Is it only with long running scripts that it crashes? Are you working with
WPFor any other kind of forms? - Is it happening when
vscode-insidersis losing focus and you are working in another app in the meantime? - What version of
vscodeorvscode-insdiersare you currently running?
These are just some thoughts that might help you narrow it down. It would be good to maybe make a big post answering all these as in the meantime a lot of updates happened and things became maybe a bit unclear.
DarkLite1
on 17 Dec 2019
- I have I9 9900K, 32GB of RAM, NVME drive and Nvidia 2070. I doubt it's coming from my setup. I had this issue for months even before I upgraded i7 6700K.
- Both cases
- On F5 - dunno with play button because I never use the play button. F8 works after things stop working.
- It's happening on both stable and preview. In the preview, it's even worse because when it hangs it goes often now into a state where whole VSCode is frozen to the point where it crashes.
- Sure, if I'll get one. I don't use the debug pane on top. I'll try to catch some screenshots.
- It happens randomly with 1 line scripts, 50 lines scripts, and large modules. I don't do GUI. I do work with .NET libraries, Exchange Online, Azure, Azure AD, Active Directory, Exchange, WMI/CIM - it happens on all occasions.
- I don't use VSCode-Insiders, only VSCode stable. It happens on all versions since I can remember. Currently on
DEBUG: Logging started
DEBUG: Beginning EndProcessing block
VERBOSE: Removing PSReadLine
DEBUG: Creating host configuration
DEBUG: Determining REPL kind
DEBUG: REPL configured as PSReadLine
DEBUG: Configuring LSP transport
DEBUG: Configuring debug transport
DEBUG: Session file writer created
VERBOSE: Adding AssemblyResolve event handler for dependency loading
VERBOSE: Loading EditorServices
DEBUG: Assembly resolve event fired for Microsoft.PowerShell.EditorServices, Version=2.0.0.0, Culture=neutral, PublicKeyToken=null
DEBUG: Loading Microsoft.PowerShell.EditorServices, Version=2.0.0.0, Culture=neutral, PublicKeyToken=null from PSES dependency dir into LoadFrom context
DEBUG: Loaded Microsoft.PowerShell.EditorServices, Version=2.0.0.0, Culture=neutral, PublicKeyToken=null
DEBUG: Loaded netstandard, Version=2.0.0.0, Culture=neutral, PublicKeyToken=cc7b13ffcd2ddd51
DEBUG: Checking that .NET Framework version is at least 4.6.1
DEBUG: Checking that PSES is running in FullLanguage mode
DEBUG: Loaded Microsoft.PowerShell.Commands.Diagnostics, Version=3.0.0.0, Culture=neutral, PublicKeyToken=31bf3856ad364e35
DEBUG: Loaded System.Configuration.Install, Version=4.0.0.0, Culture=neutral, PublicKeyToken=b03f5f7f11d50a3a
DEBUG: Loaded Microsoft.PowerShell.Commands.Utility, Version=3.0.0.0, Culture=neutral, PublicKeyToken=31bf3856ad364e35
DEBUG: Loaded Microsoft.PowerShell.Commands.Management, Version=3.0.0.0, Culture=neutral, PublicKeyToken=31bf3856ad364e35
DEBUG: Loaded Microsoft.WSMan.Management, Version=3.0.0.0, Culture=neutral, PublicKeyToken=31bf3856ad364e35
DEBUG: Assembly resolve event fired for Microsoft.PowerShell.Security.resources, Version=3.0.0.0, Culture=en-US, PublicKeyToken=31bf3856ad364e35
DEBUG: Assembly resolve event fired for Microsoft.PowerShell.Security.resources, Version=3.0.0.0, Culture=en-US, PublicKeyToken=31bf3856ad364e35
DEBUG: Assembly resolve event fired for Microsoft.WSMan.Management.resources, Version=3.0.0.0, Culture=en-US, PublicKeyToken=31bf3856ad364e35
DEBUG: Assembly resolve event fired for Microsoft.WSMan.Management.resources, Version=3.0.0.0, Culture=en-US, PublicKeyToken=31bf3856ad364e35
VERBOSE: Updated PSModulePath to: 'C:\Users\przemyslaw.klys\Documents\WindowsPowerShell\Modules;C:\Program
Files\WindowsPowerShell\Modules;C:\WINDOWS\system32\WindowsPowerShell\v1.0\Modules;C:\Program Files (x86)\Microsoft SQL
Server\140\Tools\PowerShell\Modules\;C:\Users\przemyslaw.klys\Documents\WindowsPowerShell\Modules;C:\Program Files (x86)\AutoIt3\AutoItX;C:\Program Files\Common Files\Skype for
Business Online\Modules\;c:\Users\przemyslaw.klys\.vscode\extensions\ms-vscode.powershell-preview-2019.11.0\modules'
DEBUG: Logging host information
VERBOSE:
== Host Startup Configuration Details ==
 - Host name:                 Visual Studio Code Host
 - Host version:              2019.11.0
 - Host profile ID:           Microsoft.VSCode
 - PowerShell host type:      System.Management.Automation.Internal.Host.InternalHost

 - REPL setting:              PSReadLine
 - Session details path:      c:\Users\przemyslaw.klys\.vscode\extensions\ms-vscode.powershell-preview-2019.11.0\sessions\PSES-VSCode-25772-840071
 - Bundled modules path:      c:\Users\przemyslaw.klys\.vscode\extensions\ms-vscode.powershell-preview-2019.11.0\modules
 - Additional modules:        PowerShellEditorServices.VSCode
 - Feature flags:

 - Log path:
c:\Users\przemyslaw.klys\.vscode\extensions\ms-vscode.powershell-preview-2019.11.0\logs\1576568830-4c269451-fe51-474e-b031-1ed78ed0f0141576568827770\EditorServices.log
 - Minimum log level:         Diagnostic

 - Profile paths:
   + AllUsersAllHosts:       C:\Windows\System32\WindowsPowerShell\v1.0\profile.ps1
   + AllUsersCurrentHost:    C:\Windows\System32\WindowsPowerShell\v1.0\Microsoft.VSCode_profile.ps1
   + CurrentUserAllHosts:    C:\Users\przemyslaw.klys\Documents\WindowsPowerShell\profile.ps1
   + CurrentUserCurrentHost: C:\Users\przemyslaw.klys\Documents\WindowsPowerShell\Microsoft.VSCode_profile.ps1
DEBUG: Assembly resolve event fired for Microsoft.WSMan.Management.resources, Version=3.0.0.0, Culture=en-US, PublicKeyToken=31bf3856ad364e35
DEBUG: Assembly resolve event fired for Microsoft.WSMan.Management.resources, Version=3.0.0.0, Culture=en-US, PublicKeyToken=31bf3856ad364e35
VERBOSE:
== Console Details ==
 - Console input encoding: OEM United States
 - Console output encoding: OEM United States
 - PowerShell output encoding: US-ASCII
DEBUG: Assembly resolve event fired for Microsoft.WSMan.Management.resources, Version=3.0.0.0, Culture=en-US, PublicKeyToken=31bf3856ad364e35
DEBUG: Assembly resolve event fired for Microsoft.WSMan.Management.resources, Version=3.0.0.0, Culture=en-US, PublicKeyToken=31bf3856ad364e35
DEBUG: Assembly resolve event fired for System.Management.Automation.resources, Version=3.0.0.0, Culture=en-US, PublicKeyToken=31bf3856ad364e35
DEBUG: Assembly resolve event fired for System.Management.Automation.resources, Version=3.0.0.0, Culture=en-US, PublicKeyToken=31bf3856ad364e35
VERBOSE:
== PowerShell Details ==
 - PowerShell version: 5.1.18362.145
DEBUG: Loaded System.Runtime.InteropServices.RuntimeInformation, Version=4.0.0.0, Culture=neutral, PublicKeyToken=b03f5f7f11d50a3a
VERBOSE:
== Environment Details ==
 - OS description: Microsoft Windows 10.0.18363
 - OS architecture: X64
 - Process bitness: 64
DEBUG: Validating configuration
VERBOSE: Loading PSES assemblies
VERBOSE: Starting EditorServices
DEBUG: Loaded Microsoft.Extensions.Logging.Abstractions, Version=3.0.1.0, Culture=neutral, PublicKeyToken=adb9793829ddae60
DEBUG: Loaded Serilog, Version=2.0.0.0, Culture=neutral, PublicKeyToken=24c2f752a8e58a10
DEBUG: Loaded Serilog.Sinks.Async, Version=1.4.0.0, Culture=neutral, PublicKeyToken=24c2f752a8e58a10
DEBUG: Loaded Microsoft.Extensions.Logging, Version=3.0.1.0, Culture=neutral, PublicKeyToken=adb9793829ddae60
DEBUG: Loaded Serilog.Extensions.Logging, Version=2.0.0.0, Culture=neutral, PublicKeyToken=24c2f752a8e58a10
DEBUG: Assembly resolve event fired for Microsoft.Extensions.Logging.Abstractions, Version=2.0.0.0, Culture=neutral, PublicKeyToken=adb9793829ddae60
DEBUG: Loading Microsoft.Extensions.Logging.Abstractions, Version=2.0.0.0, Culture=neutral, PublicKeyToken=adb9793829ddae60 from PSES dependency dir into LoadFrom context
DEBUG: Loaded Serilog.Sinks.File, Version=2.0.0.0, Culture=neutral, PublicKeyToken=24c2f752a8e58a10
DEBUG: Loaded System.Runtime, Version=4.0.0.0, Culture=neutral, PublicKeyToken=b03f5f7f11d50a3a
DEBUG: Loaded System.Text.Encoding, Version=4.0.0.0, Culture=neutral, PublicKeyToken=b03f5f7f11d50a3a
DEBUG: Loaded System.IO, Version=4.0.0.0, Culture=neutral, PublicKeyToken=b03f5f7f11d50a3a
DEBUG: Loaded System.IO.FileSystem, Version=4.0.0.0, Culture=neutral, PublicKeyToken=b03f5f7f11d50a3a
DEBUG: Loaded System.Runtime.Extensions, Version=4.0.0.0, Culture=neutral, PublicKeyToken=b03f5f7f11d50a3a
DEBUG: Loaded System.IO.FileSystem.Primitives, Version=4.0.0.0, Culture=neutral, PublicKeyToken=b03f5f7f11d50a3a
DEBUG: Loaded System.Text.Encoding.Extensions, Version=4.0.0.0, Culture=neutral, PublicKeyToken=b03f5f7f11d50a3a
DEBUG: Loaded Microsoft.Extensions.Options, Version=3.0.1.0, Culture=neutral, PublicKeyToken=adb9793829ddae60
DEBUG: Assembly resolve event fired for Microsoft.Extensions.Logging, Version=2.0.0.0, Culture=neutral, PublicKeyToken=adb9793829ddae60
DEBUG: Loading Microsoft.Extensions.Logging, Version=2.0.0.0, Culture=neutral, PublicKeyToken=adb9793829ddae60 from PSES dependency dir into LoadFrom context
DEBUG: Loaded System.Threading, Version=4.0.0.0, Culture=neutral, PublicKeyToken=b03f5f7f11d50a3a
DEBUG: Creating startup info object
VERBOSE: Starting server, deregistering host logger and registering shutdown listener
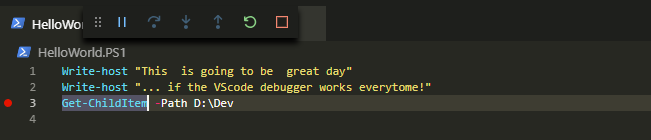
Ok, here are possible reproduction steps. Keep in mind it can be just one of many cases:
- Create a new file called
Test.ps1
function Get-myTest {
    [alias('Get-WinADGPOSysvol')]
    [cmdletBinding()]
    param(
        $Test
    )

    Write-Host $Test
    Write-Host $Test
}
- Set a breakpoint on line 9 (2nd Write-Host)
- Run the script with F5
- Nothing will happen except it will register Get-mytest as a command in PowerShell (of course file name will show up in console)
- In console type
Get-myTest -test 'test' - It should stop on breakpoint
- Press F5 to let it go
- Press up arrow to bring back get-myTest from history
- Run with Enter
- Press F5 to let it go
- Try pressing F5 to reregister the file. It won't work
Actually it won't work after 1st try. It seems that F5 "looses" it's binding from the Window and is only usable during debugging. Maybe it's related to all my problems?
And here's GIF from it. I was able to reproduce it on 2 machines in two different windows

Issue Description
I am experiencing a problem with...
Attached Logs
Follow the instructions in the README about
capturing and sending logs.
Environment Information
Visual Studio Code
| Name | Version |
| --- | --- |
| Operating System | Windows_NT x64 10.0.18363 |
| VSCode | 1.41.1|
| PowerShell Extension Version | 2019.12.0 |
PowerShell Information
|Name|Value|
|---|---|
|PSVersion|5.1.18362.145|
|PSEdition|Desktop|
|PSCompatibleVersions|1.0 2.0 3.0 4.0 5.0 5.1.18362.145|
|BuildVersion|10.0.18362.145|
|CLRVersion|4.0.30319.42000|
|WSManStackVersion|3.0|
|PSRemotingProtocolVersion|2.3|
|SerializationVersion|1.1.0.1|
Visual Studio Code Extensions
Visual Studio Code Extensions(Click to Expand)
|Extension|Author|Version|
|---|---|---|
|auto-rename-tag|formulahendry|0.1.1|
|azure-dark-theme|eddyw|0.2.0|
|beautify|HookyQR|1.5.0|
|bracket-pair-colorizer-2|CoenraadS|0.0.29|
|code-settings-sync|Shan|3.4.3|
|codesnap|adpyke|1.0.26|
|dark-plus-material|vangware|2.2.2|
|excel-to-markdown-table|csholmq|1.1.0|
|gistfs|vsls-contrib|0.0.43|
|github-linker|gimenete|0.2.3|
|gitlens|eamodio|10.2.0|
|html-preview-vscode|george-alisson|0.2.5|
|markdown-all-in-one|yzhang|2.6.1|
|markdown-preview-enhanced|shd101wyy|0.5.1|
|markdown-shortcuts|mdickin|0.12.0|
|material-icon-theme|PKief|3.9.2|
|moonlight|atomiks|0.10.0|
|nebula-theme|ChirtleLovesDolls|1.3.2|
|pdf|tomoki1207|0.5.1|
|powershell-preview|ms-vscode|2019.12.0|
|project-manager|alefragnani|10.9.1|
|reg|ionutvmi|1.0.1|
|synthwave-x-fluoromachine|webrender|0.0.9|
|theme-monokai-pro-vscode|monokai|1.1.14|
|vscode-html-css|ecmel|0.2.3|
|vscode-markdownlint|DavidAnson|0.33.0|
|vscode-power-mode|hoovercj|2.2.0|
|vscode-pull-request-github|GitHub|0.14.0|
|vscode-wakatime|WakaTime|2.2.1|
|vscode-yaml|redhat|0.6.1|
|xml|DotJoshJohnson|2.5.0|
PrzemyslawKlys
on 10 Jan 2020
Btw. during debugging if you do some longer running code (press F9 on first Write-Host) and you let it go... it will not show running PowerShell progress anymore. It will silently continue.
function Get-myTest {
    [alias('Get-WinADGPOSysvol')]
    [cmdletBinding()]
    param(
        $Test
    )

    Write-Host $Test
    Start-Sleep -Seconds 15
    Write-Host $Test
}
When there is hanging session (so F5 stops working) when you press F6 (I did it by accident) you get this:

PrzemyslawKlys
on 12 Jan 2020
@PrzemyslawKlys I'm pretty sure this is because the debugger is currently active... it's not clear with your theme and I'm guessing you disable the little pop up that shows up...
Can you try with like the ISE theme or something? There's no way for us to really know when you've "stopped executing" so the experience is that you're dropped into the debugger and are in the debugger until you stop the debugger.
TylerLeonhardt
on 15 Jan 2020
Have you tried my reproduction steps?
PrzemyslawKlys
on 15 Jan 2020
Yep. That's why I ask. I ran through the steps and the reason F5 didn't work was because the debugger was already on.
TylerLeonhardt
on 15 Jan 2020
Ok, I think we have a misunderstanding here.
- I use F5 to run script and F5 to continue (as in going to next breakpoint)
I'm basically only using:
- Continue / Pause F5
- Step Over F10
- Step Into F11
- Step Out Shift+F11
- Restart Ctrl+Shift+F5
- Stop Shift+F5
Nothing else.

I understand now what you mean with colors (I always check for the progress bar in my theme - and missing during debugging).
I also look at [DBG] in cmdline to see whether I'm during debugging or not. Not sure why would you get orange color after I press continue on Write-Host and than it waits for a long time until I actually use SHIFT+F5.
PrzemyslawKlys
on 15 Jan 2020
If I'm reading new "colors" correctly is that when I press F5 the code enters debug. Then I press F5 it seems like console says "ok we're done), yet the orange color stays on and when I execute something again it's basically Debug within Debug within Debug at some point. So it would seem like Debugger doesn't detach properly when it's done and VScode is lost.
PrzemyslawKlys
on 15 Jan 2020
Yeah this has been the case for the Interactive Session debugging for as long as I've been working on this project and it's not a perfect experience... Let me chat with @rjmholt and @SydneyhSmith about this behavior... but it's not a new problem.
TylerLeonhardt
on 16 Jan 2020
To be honest I don't really understand why would this behavior be like that. If I run code interactively it never goes out of debugging, yet the [DBG] is gone and the console acts as if it's done. Although the status bar still is orange. My understanding was that it will act like normal. If I press F5 and there are no more breakpoints it should finish up and stop. I have now changed color for my current theme to the orange status bar for debugging just to make sure it's visible what is happening.
Hopefully, this will allow me to have fewer frustrations as I've been restarting PowerShell 50 times a day not knowing what is happening. Not sure if this is the only cause of my problems but this one I was able to pinpoint.
PrzemyslawKlys
on 16 Jan 2020
I have to admit, the only way I debug and/or develop code is interactive. I never launch a script from the terminal. Maybe that's a result from being spoiled by the PowerShell ISE. However, I think many users are developing the same way.
DarkLite1
on 16 Jan 2020
But I believe I have hit these errors also when developing in script pane only. I can't be really sure because I couldn't pinpoint it, but now that I know what to look for it may be a bit easier to spot & recover if possible.
PrzemyslawKlys
on 16 Jan 2020
To step out of my maintainer boots for a moment...
I always use Launch Current File and it behaves the way I expect a debugger would. Interactive Session isn't really my wheelhouse, so I don't know what the expectations are (and in my experience, expectations with a lot of PowerShell IDE features vary).
rjmholt
on 16 Jan 2020
My expectations would be:
- When I press F5 it executes the file as it does now
- If it hits breakpoint debugger is still there
- If I continue with F5 and it reaches the end of the file/script it should detach the debugger
There is inconsistency right now:
- Orange bar stays on (if you use a proper theme that shows that appropriately).
- [DBG] in a console is removed
- Progress icon is gone
This makes it hard to understand what's going on.
Why would debugger stay on if the command is finished? It's not like I did enter debugging manually and then run the script and wanted to stay within the debug session.
Hopefully, I am not the only one complaining about this. Maybe I'm just misusing the tool 🤷♀️
PrzemyslawKlys
on 16 Jan 2020
Ok @TylerLeonhardt has explained this to me and I'll try my best to explain my understanding of the situation.
It comes down to:
- VSCode sends no notification when you're not debugging and set breakpoints, instead it sends all set breakpoints when you start debugging
- When you're in debug mode, it continues to update breakpoints (it sends the full list of breakpoints each time you set or remove a breakpoint)
- Once you drop out of debug mode, it no longer sends breakpoint updates, even though it shows set breakpoints in the sidebar. Instead it saves them up for when you next launch the debugger.
Users from the ISE expect the following scenario to work:
- Set breakpoints in my script
- Launch the debugger
- Hit the breakpoint
- Let the script continue to completion
- Set another breakpoint (or remove breakpoints)
- Rerun script
- Hit the new breakpoint (or don't hit removed breakpoint)
But once we drop out of debug mode, we never get an update from VSCode about breakpoints (since we don't control VSCode, that means we're blind to breakpoints set in it). That means any changes you make in breakpoints at that time won't get hit if you run something from the console.
But even though F5 has become synonymous with "Run script", it really means "Run current debug configuration". When VSCode gets told this, it says "But I'm already in debug mode".
See also: https://github.com/PowerShell/vscode-powershell/issues/2371, https://github.com/PowerShell/PowerShellEditorServices/issues/1091
In reference to @PrzemyslawKlys's particular issues:
- Orange bar stays on (if you use a proper theme that shows that appropriately).
That means VSCode in debug mode and will send updates about breakpoints.
- [DBG] in a console is removed
That's because you're not stopped in the debugger. You're in debug mode, but you're not currently in a nested debug prompt. When you see [DBG], debugger console commands like continue or list apply.
- Progress icon is gone
This is likely because there's no script executing, the same reason for (2). You're in debug mode, but there's no script running.
Ideally we could progress on this issue by either coming up with a clever workaround to the VSCode problem, or possibly coming up with a configuration where users can pick what behaviour they want. I suspect the two options are:
- [Current behaviour] Remain in the debugger after script has finished running, breakpoints set in the VSCode sidebar will be hit when scripts are run from the terminal, breakpoints persist throughout session. This means you get "shadow" breakpoints (ones set in PowerShell that VSCode doesn't know about) and F5 won't rerun a script.
- Drop out of the debugger when current debug execution finishes, remove all PSBreakpoints (breakpoints set in VSCode will remain showing). Running scripts at this point will never launch the debugger; that must be done from VSCode. This means that debugging cmdlets like
Set-PSBreakpointandWait-Debuggerwon't work.
There's probably a bit of extra engineering we can do here, but I think the rest is best done with configuration so that everyone can have the experience they prefer with whatever compromises that might entail.
rjmholt
on 16 Jan 2020
Just to be clear - does it cover both scenarios I am using or just one of them?
- Running script from script pane
- Running script from script pane (to "activate" function) and finally typing the function in the console?
PrzemyslawKlys
on 16 Jan 2020
Running script from script pane
This would work if we deactivate debugging after script completion. Pressing F5 a second time would run the script again.
Running script from script pane (to "activate" function) and finally typing the function in the console?
That won't work if we deactivate debugging after a script completes. The breakpoints set in the function will be washed away.
rjmholt
on 16 Jan 2020
So,after a long read, just for my understanding of the problem I did a small test on the latest vscode-insiders. What I did:
- Write a new function in a file that is not found in any module
- Press
F5to execute the currentscript paneorscript file - Go to the
PSICterminal and try to use the new function - The function is properly executed and in the session

@PrzemyslawKlys does this not cover your case? Maybe I misunderstood and you can write a simple test case.
DarkLite1
on 17 Jan 2020
Related issues
 GQnzo
·
3Comments
GQnzo
·
3Comments
 daviwil
·
4Comments
daviwil
·
4Comments
 Line40
·
3Comments
Line40
·
3Comments
 itfranck
·
3Comments
itfranck
·
3Comments
 TheDanishDynamo
·
3Comments
TheDanishDynamo
·
3Comments