Vscode-powershell: debugger won't focus on files that are not under the current file's directory in vscode 1.31
Unexpected behaviour in vscode 1.31:
- start debug session on a .ps1 file
- step into a .ps1 file on a path that is not below the current file, i.e. whose relative path has .. in it
- observe that focus stays on the original file, even though execution has now paused in the called file
- observe that switching focus to the called file and single stepping switches back to the original file
Downgrade back to vscode 1.30.2 to see desired behaviour:
- start debug session on a ps1 file
- step into the same script file
- observe the focus switches to the called file
- observe that single stepping keeps focus on the called file
What changed between 1.30.2 and 1.31? Is this just a powershell issue or does it occur in other languages? It looks like it's trying to implement 'just my code' but I can find no way to turn it off except to stay on 1.30.2.
 AndyP2
All 55 comments
I started seeing this near the end of January, but couldn't describe it this well. I suspect as there were no changes to the extension at the time it started to occur to me that it's a vscode issue, but I have no idea where to start looking.
Another thing I noticed is that the debug sidebar doesn't list any variables while it's not in the current file.
 corbob
on 8 Feb 2019
corbob
on 8 Feb 2019
I'm having the same issue with VS Code 1.31. When I debug a Pester test, and step through the code into a function defined in a different file, the focus stays in the Pester file. When I switch back to VS Code 1.30.2, the step through works fine and VS Code switches into the file holding the function.
I get the same behaviour with the PowerShell extension versions: 1.11.0 and 2..0.0 preview.
 mrboring
on 9 Feb 2019
mrboring
on 9 Feb 2019
Part of me is wondering if this is related to vscode bug: https://github.com/Microsoft/vscode/issues/67895 unfortuantely I don't know enough about the inner workings of the debugger in vscode to know if they're related ☹️
corbob
on 9 Feb 2019
having this problem as well. exactly as described.
 exactmike
on 12 Feb 2019
exactmike
on 12 Feb 2019
If the same version of the PowerShell extension does or doesn't have this across different VSCode versions, it's likely this is a VSCode issue.
We'll need to work out if it's something they intended to break or not.
 rjmholt
on 12 Feb 2019
rjmholt
on 12 Feb 2019
Thanks guys, we are able to repro this. We will need to investigate further what changed in the release to have caused this.
 SydneyhSmith
on 12 Feb 2019
SydneyhSmith
on 12 Feb 2019
@SydneyhSmith please see issue https://github.com/Microsoft/vscode/issues/68616 that might be related (and my comment https://github.com/Microsoft/vscode/issues/68616#issuecomment-463248717).
Do you set the "deemphasized" hint on the top stack frames?
If yes, do you have an option to turn "deemphasizing top frames" off?
This helped for Node.js debug.
 weinand
on 14 Feb 2019
weinand
on 14 Feb 2019
Yes, I installed yesterday's 1.32.0-insider to test this, and it also de-emphasises the stack frames.
If I add "smartStep": false to launch.json the hover text says "Property smartStep is not allowed" and the debug behaviour is unchanged.
AndyP2
on 14 Feb 2019
Yes, the "smartStep" feature is specific to Node.js debugging.
That's the reason why I've asked whether the PowerShell debugger has an option to turn "deemphasizing top frames" off.
weinand
on 14 Feb 2019
I did sort of expect that. I couldn't find anything else that seemed relevant though, so I thought I'd try it anyway :-)
AndyP2
on 14 Feb 2019
@weinand I am not aware of a deemphasizing top frames option, are there any plans to address this on the VSCode side?
SydneyhSmith
on 15 Feb 2019
Please read my comment from above.
weinand
on 16 Feb 2019
We do support deemphasize but there isn't a setting to turn it off. But I can test it with that support disabled.
 rkeithhill
on 16 Feb 2019
rkeithhill
on 16 Feb 2019
This issue is so painful that I had to move back to VSCode 1.30.2.
 Glober777
on 21 Feb 2019
Glober777
on 21 Feb 2019
@isidorn #68616 is a show stopper!
weinand
on 21 Feb 2019
This is fixed in latest vscode insiders.
Can someone from this thread please verify that everything is ok for powershell now?
Thanks!
 isidorn
on 25 Feb 2019
isidorn
on 25 Feb 2019
I tested with the latest insider today I still have the worry 🙄
 LaurentLienhard
on 25 Feb 2019
LaurentLienhard
on 25 Feb 2019
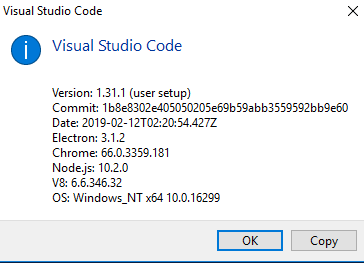
Version: 1.32.0-insider (user setup)
Commit: 393b48d4a5de85b6fa1d2ad0a59588d6715e12ea
Date: 2019-02-25T01:34:48.785Z
Electron: 3.1.3
Chrome: 66.0.3359.181
Node.js: 10.2.0
V8: 6.6.346.32
OS: Windows_NT x64 10.0.18343
it's confirmed, when I run the debug with F11 it does not go into the function
LaurentLienhard
on 25 Feb 2019
Can someone from the powershell team please investigate more and let us know if there is still an issue on the vscode side since we fixed #68616 Thanks!
@LaurentLienhard thanks for trying out latest insiders.
isidorn
on 26 Feb 2019
With latest insiders I still see issues with stepping into code - the stepped into source doesn't open. It appears we are still showing the top stack frame as deemphasized:
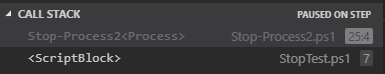
I'll look into this further this evening. It appears we might have an issue with how we are determining if a stack frame is "external" or not. Still, our original intent wasn't to prevent folks from stepping into such code. Our intent was to deemphasize infrastructure (test infrastructure) code in the call stack.
rkeithhill
on 26 Feb 2019
@isidorn OK, I believe VSCode Insiders has this fixed for PowerShell. And this is fixed when the source being stepped into is in the same directory (or under) as the script that was started under the debugger.
However, a bug in the PowerShell extension is surfaced when the source file is in a directory above the initial script's dir. This is because in our launch config we set "cwd:" : "${file}" so that if the file relies on pulling in other files from the current dir it will be set to something that is "close" to being right. In the end, the "right" value is hard to predict but the user can change.
Inside the debugger, we try to determine if the stack frame is external by looking at the associated script path and seeing if it is under the workspace path. Unfortunately, I don't think we have the workspace path in the debugger so we are cheating by using the cwd value.
WORKAROUND: set your debug (.vscode\launch.json) config cwd like so: "cwd": "${workspaceFolder}". @AndyP2 @LaurentLienhard @corbob @exactmike - can you verify this workaround works for you? This should get you by until the next update to the extension.
I'm going to look into fixing this correctly by poking into the language server and seeing if I can grab the workspace path from there.
rkeithhill
on 27 Feb 2019
@rkeithhill thanks for looking into this!
isidorn
on 27 Feb 2019
@rkeithhill Your workaround does not work for Pester tests when Debug tests is clicked. However, it does work if F5 is pressed. I use Debug tests a lot when creating tests.
OS Name Microsoft Windows 10 Pro
Version 10.0.17763 Build 17763

### VSCode version: 1.32.0-insider ce073b0076ac2f69faf2c609af72f9b81506c791 x64

### VSCode extensions:
[email protected]


### PSES version: 1.11.0.0

### PowerShell version:

Name                           Value
----                           -----
PSVersion                      5.1.17763.316
PSEdition                      Desktop
PSCompatibleVersions           {1.0, 2.0, 3.0, 4.0...}
BuildVersion                   10.0.17763.316
CLRVersion                     4.0.30319.42000
WSManStackVersion              3.0
PSRemotingProtocolVersion      2.3
SerializationVersion           1.1.0.1
I've created a sample Github repository:.
Here are the steps I followed:
- Open Tests/Debug-Problem-Module.Tests.ps1
- Added a breakpoint on line 13
- Clicked
Debug tests. When breakpoint is hit, pressedF11. Does not step into file - Pressed
F5. When breakpoint is hit, pressedF11. Does step into file
mrboring
on 27 Feb 2019
In my case it does not change anything to put "cwd": "$ {workspaceFolder}" in the file launch.json.
When I put a breakpoint in my script I do:
- start debuging => same behavior
- Press F5 then F11 => same behavior
I never go into detail about the function I call
LaurentLienhard
on 27 Feb 2019
I am not on insiders, but I work on version:
I am facing the same issue, so as all my coworkers. (Seems like everyone is hit this bug).
This is pretty big blocker for us.
 Stephanevg
on 27 Feb 2019
Stephanevg
on 27 Feb 2019
@LaurentLienhard You tried this on the latest VSCode Insiders build? @mrboring that makes sense. The Pester test debug configuration is hardwired in the the extension. @Stephanevg as @isidorn mentions above, the "first" bug - which happens to be in VSCode - has been fixed in the latest VSCode Insiders build. Unless you install that version, you won't see that fix until the next VSCode release. The second bug - not being able to step into source above the launched script in the directory structure - is in the PowerShell extension. It should be fixed (one way or another) in the next drop of the extension. The "workaround" is just a temporary way to avoid the issue in some cases.
rkeithhill
on 27 Feb 2019
@rjmholt
Version: 1.32.0-insider (user setup)
Commit: ce073b0076ac2f69faf2c609af72f9b81506c791
Date: 2019-02-27T06:17:47.743Z
Electron: 3.1.3
Chrome: 66.0.3359.181
Node.js: 10.2.0
V8: 6.6.346.32
OS: Windows_NT x64 10.0.18343
in my file test i only have 2 lines with 1 breakpoint (last line)
Import-Module PSitSupport
Remove-RdsProfil -Surname "lienhard" -GivenName "laurent" -Company CH -ProfilePath C:\temp
in my launch.json i have
{
"type": "PowerShell",
"request": "launch",
"name": "PowerShell Launch Current File",
"script": "${file}",
"args": [],
"cwd": "${workspaceFolder}"
},
When i run with debug menu i have this

same thing when i run with F5 and F11
LaurentLienhard
on 27 Feb 2019
[...] Still, our original intent wasn't to prevent folks from stepping into such code. Our intent was to deemphasize infrastructure (test infrastructure) code in the call stack.
Is this something that can have a flag to disable it? My team regularly wants to step into code that is outside the current workspace directory, and this behavior (at least the way I understand the intended behavior) would mean that stepping into our psm1's from the current workspace would be deprioritized, for example? If that is the case, an off switch would be nice :)
 EklipZgit
on 27 Feb 2019
EklipZgit
on 27 Feb 2019
@LaurentLienhard what happens if you set it to "cwd": "C:\\"?
rkeithhill
on 28 Feb 2019
Even when calling the full path of a PS1 file, it's not opening the file when there's a breakpoint set on the call to the script.
Example.ps1
& 'S:\Prod\Mail manager\Mail manager user expiring.ps1' -Mode 'Prod'
Latest insiders:
Version: 1.32.0-insider (user setup)
Commit: 69249882e8717cf111e04330390107282e337559
Date: 2019-02-27T21:19:19.351Z
Electron: 3.1.3
Chrome: 66.0.3359.181
Node.js: 10.2.0
V8: 6.6.346.32
OS: Windows_NT x64 6.2.9200
Using extension PowerShell Preview 2.0.0
 DarkLite1
on 28 Feb 2019
DarkLite1
on 28 Feb 2019
@rkeithhill with "cwd": "C:\" is ok :-)
When I press F11 => jump to my fonction
LaurentLienhard
on 28 Feb 2019
@rkeithhill
@mrboring that makes sense. The Pester test debug configuration is hardwired in the the extension.
Could a setting be added to override the default?
mrboring
on 28 Feb 2019
Yes. I'm looking at either ripping out the feature altogether (not my first choice) or adding a debug config setting that defaults to:
"smartStep": {
    enabled: true,
    sourceDirs: [ "${workspaceFolder}" ]
}
@isidorn @weinand Any input on this approach? We basically look at the script path of each stack frame and if rooted in one of the sourceDirs, then it's a normal stack frame otherwise we deemphasize it. BTW it would be nice if we had an optional way to "force" step into "external" code.
rkeithhill
on 28 Feb 2019
@DarkLite1 can you try the setting "cwd": ""?
rkeithhill
on 28 Feb 2019
@rkeithhill that didn't work I'm afraid. Still the same issue when hitting F5 and executing
"configurations": [
        {
            "type": "PowerShell",
            "request": "launch",
            "name": "PowerShell Launch Current File",
            "script": "${file}",
            "args": [],
            "cwd": ""
        },
I need this fixed badly too. Refactoring code across different modules kills the ability to debug it.
 MarkKharitonov
on 6 Mar 2019
MarkKharitonov
on 6 Mar 2019
OK, initially I'm going to disable this de-emphasize and then come back when I have some more time to implement this with settings to control it. Perhap @rjmholt could push out a bug fix update early next week? We have a few other bug fixes teed up for release.
rkeithhill
on 7 Mar 2019
OK, initially I'm going to disable this de-emphasize and then come back when I have some more time to implement this with settings to control it.
@rkeithhill Hopefully these will be global settings and not per project.
mrboring
on 7 Mar 2019
Considering the following, I think the setting to _have_ de-emphasized stack frames will probably be an opt-in setting:
- When you hit the issue, it's confusing as to what happened.
- the learning curve with debug configurations for PowerShell customers is too high (we've gotten a lot of negativity from customers about the concept of the debug configs)
- Some PowerShell customers are not use to debuggers all-together
- People running scripts in other places is not an edge case IMO
Does anyone feel otherwise?
 TylerLeonhardt
on 8 Mar 2019
TylerLeonhardt
on 8 Mar 2019
That's good data. I wasn't sure what was better - using debug config or extension settings. The Node debugger uses debug config for enabling/disabling smartStep. But it sounds like we'd prefer this be a workspace setting. Works for me.
rkeithhill
on 8 Mar 2019
Keep it KISS guys. I've only worked with the PowerShell ISE, before I started using VS Code. So as @TylerLeonhardt stated, I've never worked with a debugger before. The more the window on the left pops-up, the more I try to close it every time as it takes up too much space (but this is another issue).
When I want to see values of variables, I usually hover over them or type it in the console with some other commands to test things out after a breakpoint. I know it's maybe not best practice, but it's what I've learned by using the ISE.
So IMHO, please try to make the config KISS or even unneeded to mimic the PowerShell ISE behavior. But that's just my 2 cents of course. It all depends on the target audience and what they'd expect.
DarkLite1
on 8 Mar 2019
@rkeithhill I'm not apposed to making this a debug config setting, but the point I wanted to drive home was that it should be opt-in not opt-out.
Also, Keith can you open a new issue to track creating the setting so we don't forget?
TylerLeonhardt
on 8 Mar 2019
Since the issue is closed I understand there is a workaround. From this discussion I did not understand what it is - could you give detailed instructions how to apply it?
Thank you.
MarkKharitonov
on 8 Mar 2019
@MarkKharitonov a workaround has been applied. There's no work that needs to be done from the user's perspective. However, you must wait for the next release.
TylerLeonhardt
on 8 Mar 2019
Got it. Thank you very much.
MarkKharitonov
on 8 Mar 2019
@TylerLeonhardt Issue submitted - https://github.com/PowerShell/vscode-powershell/issues/1783
rkeithhill
on 8 Mar 2019
@TylerLeonhardt / @rkeithhill
Could we have information in which version number this bug would be fixed? 1.32.3 ? If so, I am still impacted, and then this issue should be re-opened.

Not having the debugger is something that really impacted our productivity, and I have 20 engineers that were cursing at Vscode each time they need to debug some code these last 2 weeks.
Stephanevg
on 18 Mar 2019
@TylerLeonhardt / @rkeithhill
Could we have information in which version number this bug would be fixed? 1.32.3 ? If so, I am still impacted, and then this issue should be re-opened.
Not having the debugger is something that really impacted our productivity, and I have 20 engineers that were cursing at Vscode each time they need to debug some code these last 2 weeks.
In this version, in my case, it works only if I replace "cwd": "$ {file}" by "cwd": "C: \\" in the file launch.json
LaurentLienhard
on 18 Mar 2019
@MarkKharitonov a workaround has been applied. There's no work that needs to be done from the user's perspective. However, you must wait for the next release.
@LaurentLienhard should it not work without making changes in debug configs?
DarkLite1
on 18 Mar 2019
I believe what Tyler is saying is that it's fixed in the repository for the extension, but you need to wait for a release to be built for it to be fixed in the marketplace version of the PowerShell extension.
corbob
on 18 Mar 2019
without making changes in debug configs?
That is just a "workaround" until the next release hits the marketplace. The fix in that release will not require any changes to your debug config.
rkeithhill
on 18 Mar 2019
@rkeithhill Has a fix been made for the clicking Debug tests in Pester tests having a hardwired debug configuration?
https://github.com/PowerShell/vscode-powershell/issues/1750#issuecomment-467828230
@mrboring that makes sense. The Pester test debug configuration is hardwired in the the extension.
If not, does a new issue need creating?
mrboring
on 19 Mar 2019
Thanks guys, let's hope it gets fixed in the preview extension too. As we're using that one for the PSReadLine support.
DarkLite1
on 19 Mar 2019
The workaround will also be there :)
TylerLeonhardt
on 20 Mar 2019
For those curious about which version of vscode-powershell this issue was fixed in, it was included in release v1.12.0 and v2.0.0-preview.2
 DecoyJoe
on 13 Apr 2019
DecoyJoe
on 13 Apr 2019
Related issues
 inthemedium
·
3Comments
inthemedium
·
3Comments
 nathan-alden-hp
·
3Comments
nathan-alden-hp
·
3Comments
 pcgeek86
·
4Comments
pcgeek86
·
4Comments
 bgelens
·
3Comments
rkeithhill
·
3Comments
bgelens
·
3Comments
rkeithhill
·
3Comments
Most helpful comment
For those curious about which version of vscode-powershell this issue was fixed in, it was included in release v1.12.0 and v2.0.0-preview.2