Vscode-php-debug: Breakpoints not working when performing remote debugging
Everithing seems to be working ok. Adapter connects and detects scripts running but it NEVER stops on set breakpoints. Details:
- When setting a breakpoint it always states "unverified".
- Next, after a script is executed the log indicates that it's working (started, exited) but it seems that any breakpoint is actually set/reached.
- Mapped routes seems to be OK too.
- Nothing is logged on XDEBUG logs
- XDdebug / Webserver running under a Vagrant VM
- Server is running on port 8081 (http://127.0.0.1:8081)
Has somebody an idea of what to try next? I've been fighting this for two days, I'm a little frustrated :(
Thank you in advance!
PHP version: 7.0.22-0ubuntu0.16.04.1
XDebug version: 2.4.0
Adapter version: 1.12.1
Your launch.json:
{
    "version": "0.2.0",
    "configurations": [
        {
            "name": "Listen for XDebug",
            "type": "php",
            "request": "launch",
            "pathMappings": {
              "/var/www/html": "{workspaceRoot}/repo/html",
            },
            "port": 9000,
            "log": true
        },
    ]
}
XDebug php.ini config:
xdebug support  enabled
Version 2.4.0
IDE Key vscode
Supported protocols Revision
DBGp - Common DeBuGger Protocol $Revision: 1.145 $
Directive   Local Value Master Value
xdebug.auto_trace   Off Off
xdebug.cli_color    0   0
xdebug.collect_assignments  Off Off
xdebug.collect_includes On  On
xdebug.collect_params   0   0
xdebug.collect_return   Off Off
xdebug.collect_vars Off Off
xdebug.coverage_enable  On  On
xdebug.default_enable   On  On
xdebug.dump.COOKIE  no value    no value
xdebug.dump.ENV no value    no value
xdebug.dump.FILES   no value    no value
xdebug.dump.GET no value    no value
xdebug.dump.POST    no value    no value
xdebug.dump.REQUEST no value    no value
xdebug.dump.SERVER  no value    no value
xdebug.dump.SESSION no value    no value
xdebug.dump_globals On  On
xdebug.dump_once    On  On
xdebug.dump_undefined   Off Off
xdebug.extended_info    On  On
xdebug.file_link_format no value    no value
xdebug.force_display_errors Off Off
xdebug.force_error_reporting    0   0
xdebug.halt_level   0   0
xdebug.idekey   no value    no value
xdebug.max_nesting_level    1000    1000
xdebug.max_stack_frames -1  -1
xdebug.overload_var_dump    On  On
xdebug.profiler_aggregate   Off Off
xdebug.profiler_append  Off Off
xdebug.profiler_enable  Off Off
xdebug.profiler_enable_trigger  Off Off
xdebug.profiler_enable_trigger_value    no value    no value
xdebug.profiler_output_dir  /tmp    /tmp
xdebug.profiler_output_name cachegrind.out.%p   cachegrind.out.%p
xdebug.remote_addr_header   no value    no value
xdebug.remote_autostart On  On
xdebug.remote_connect_back  Off Off
xdebug.remote_cookie_expire_time    3600    3600
xdebug.remote_enable    On  On
xdebug.remote_handler   dbgp    dbgp
xdebug.remote_host  10.0.2.2    10.0.2.2
xdebug.remote_log   /var/log/xdebug.log /var/log/xdebug.log
xdebug.remote_mode  req req
xdebug.remote_port  9000    9000
xdebug.scream   Off Off
xdebug.show_error_trace Off Off
xdebug.show_exception_trace Off Off
xdebug.show_local_vars  Off Off
xdebug.show_mem_delta   Off Off
xdebug.trace_enable_trigger Off Off
xdebug.trace_enable_trigger_value   no value    no value
xdebug.trace_format 0   0
xdebug.trace_options    0   0
xdebug.trace_output_dir /tmp    /tmp
xdebug.trace_output_name    trace.%c    trace.%c
xdebug.var_display_max_children 128 128
xdebug.var_display_max_data 512 512
xdebug.var_display_max_depth    3   3
XDebug logfile (from setting xdebug.remote_log in php.ini):
Log opened at 2018-01-18 15:09:01
I: Connecting to configured address/port: 10.0.2.2:9000.
E: Time-out connecting to client. :-(
Log closed at 2018-01-18 15:09:01
Adapter logfile (from setting "log": true in launch.json):
<- launchResponse
Response {
  seq: 0,
  type: 'response',
  request_seq: 2,
  command: 'launch',
  success: true }

new connection 1
<- threadEvent
ThreadEvent {
  seq: 0,
  type: 'event',
  event: 'thread',
  body: { reason: 'started', threadId: 1 } }

<- initializedEvent
InitializedEvent { seq: 0, type: 'event', event: 'initialized' }

-> threadsRequest
{ command: 'threads', type: 'request', seq: 3 }

<- threadsResponse
Response {
  seq: 0,
  type: 'response',
  request_seq: 3,
  command: 'threads',
  success: true,
  body: { threads: [ Thread { id: 1, name: 'Request 1 (11:59:58 AM)' } ] } }

-> setFunctionBreakpointsRequest
{ command: 'setFunctionBreakpoints',
  arguments: { breakpoints: [] },
  type: 'request',
  seq: 4 }

<- setFunctionBreakpointsResponse
Response {
  seq: 0,
  type: 'response',
  request_seq: 4,
  command: 'setFunctionBreakpoints',
  success: true,
  body: { breakpoints: [] } }

-> setExceptionBreakpointsRequest
{ command: 'setExceptionBreakpoints',
  arguments: { filters: [ '*' ] },
  type: 'request',
  seq: 5 }

<- setExceptionBreakpointsResponse
Response {
  seq: 0,
  type: 'response',
  request_seq: 5,
  command: 'setExceptionBreakpoints',
  success: true }

-> configurationDoneRequest
{ command: 'configurationDone', type: 'request', seq: 6 }

-> threadsRequest
{ command: 'threads', type: 'request', seq: 7 }

<- threadsResponse
Response {
  seq: 0,
  type: 'response',
  request_seq: 7,
  command: 'threads',
  success: true,
  body: { threads: [ Thread { id: 1, name: 'Request 1 (11:59:58 AM)' } ] } }

<- configurationDoneResponse
Response {
  seq: 0,
  type: 'response',
  request_seq: 6,
  command: 'configurationDone',
  success: true }

<- threadEvent
ThreadEvent {
  seq: 0,
  type: 'event',
  event: 'thread',
  body: { reason: 'exited', threadId: 1 } }

-> setBreakpointsRequest
{ command: 'setBreakpoints',
  arguments:
   { source:
      { name: 'phpinfo.php',
        path: 'c:\\Users\\s.veggiani\\Work\\projects\\yog18\\repo\\html\\phpinfo.php' },
     lines: [ 3 ],
     breakpoints: [ { line: 3 } ],
     sourceModified: false },
  type: 'request',
  seq: 8 }

<- setBreakpointsResponse
Response {
  seq: 0,
  type: 'response',
  request_seq: 8,
  command: 'setBreakpoints',
  success: true,
  body: { breakpoints: [ { verified: false, line: 3 } ] } }

new connection 2
<- threadEvent
ThreadEvent {
  seq: 0,
  type: 'event',
  event: 'thread',
  body: { reason: 'started', threadId: 2 } }

<- initializedEvent
InitializedEvent { seq: 0, type: 'event', event: 'initialized' }

-> threadsRequest
{ command: 'threads', type: 'request', seq: 9 }

<- threadsResponse
Response {
  seq: 0,
  type: 'response',
  request_seq: 9,
  command: 'threads',
  success: true,
  body: { threads: [ Thread { id: 2, name: 'Request 2 (12:01:14 PM)' } ] } }

-> setBreakpointsRequest
{ command: 'setBreakpoints',
  arguments:
   { source:
      { name: 'phpinfo.php',
        path: 'c:\\Users\\s.veggiani\\Work\\projects\\yog18\\repo\\html\\phpinfo.php' },
     lines: [ 3 ],
     breakpoints: [ { line: 3 } ],
     sourceModified: false },
  type: 'request',
  seq: 10 }

<- setBreakpointsResponse
Response {
  seq: 0,
  type: 'response',
  request_seq: 10,
  command: 'setBreakpoints',
  success: true,
  body: { breakpoints: [ { verified: true, line: 3 } ] } }

-> setFunctionBreakpointsRequest
{ command: 'setFunctionBreakpoints',
  arguments: { breakpoints: [] },
  type: 'request',
  seq: 11 }

<- setFunctionBreakpointsResponse
Response {
  seq: 0,
  type: 'response',
  request_seq: 11,
  command: 'setFunctionBreakpoints',
  success: true,
  body: { breakpoints: [] } }

-> setExceptionBreakpointsRequest
{ command: 'setExceptionBreakpoints',
  arguments: { filters: [ '*' ] },
  type: 'request',
  seq: 12 }

<- setExceptionBreakpointsResponse
Response {
  seq: 0,
  type: 'response',
  request_seq: 12,
  command: 'setExceptionBreakpoints',
  success: true }

-> configurationDoneRequest
{ command: 'configurationDone', type: 'request', seq: 13 }

-> threadsRequest
{ command: 'threads', type: 'request', seq: 14 }

<- threadsResponse
Response {
  seq: 0,
  type: 'response',
  request_seq: 14,
  command: 'threads',
  success: true,
  body: { threads: [ Thread { id: 2, name: 'Request 2 (12:01:14 PM)' } ] } }

<- configurationDoneResponse
Response {
  seq: 0,
  type: 'response',
  request_seq: 13,
  command: 'configurationDone',
  success: true }

<- threadEvent
ThreadEvent {
  seq: 0,
  type: 'event',
  event: 'thread',
  body: { reason: 'exited', threadId: 2 } }
Code snippet to reproduce:
<?php
$foo = 'hey!';
$bar = 'hou!';
echo '<h1>Hello!</h1>';
 sveggiani
All 27 comments
xdebug.remote_connect_back Off Off
this seems bad.
try settings in your php.ini
xdebug.remote_enable=1
xdebug.remote_autostart=1
xdebug.remote_connect_back=1
and fix pathMappings in your launch.json
{
"version": "0.2.0",
"configurations": [
{
"name": "Listen for XDebug",
"type": "php",
"request": "launch",
"pathMappings": {
- "/var/www/html": "{workspaceRoot}/repo/html",
+ "/var/www/html": "${workspaceRoot}/repo/html",
},
"port": 9000,
"log": true
},
]
}
if you using Vagrant. you also need port-forwarding in your Vagrantfile.
config.vm.network "forwarded_port", guest: 9000, host: 9000
 hidekuro
on 30 Jan 2018
hidekuro
on 30 Jan 2018
Hi, after a couple more of test along these days, I've come with a configuration that works for me. I've detailed as much as possible in this gist:
https://gist.github.com/sveggiani/10b6edd899412d6bdadd23c20607cf79
sveggiani
on 6 Feb 2018
I am having a very similar issue, except I get the xdebug logging to work. Everything is working fine, except it just won't stop at breakpoints, errors, warnings, etc. What's also weird is that this config was working a few weeks ago.
Vagrantfile:
Vagrant.configure("2") do |config|
config.vm.box = "goodfolk/gf-lamp-5.6"
config.vm.box_version = "1.0.1"
config.vm.network "private_network", ip: "192.168.33.17"
config.vm.network "forwarded_port", guest: 9000, host: 9000
config.vm.hostname = "ybc.gfdev"
config.vm.synced_folder ".", "/var/www", :mount_options => ["dmode=777", "fmode=755"]
config.vm.provision "shell", path: "setupcron.sh"
end
Debug Console (after starting and manually stopping debug)
<- launchResponse
Response {
seq: 0,
type: 'response',
request_seq: 2,
command: 'launch',
success: true }
-> disconnectRequest
{ command: 'disconnect',
arguments: { restart: false },
type: 'request',
seq: 3 }
<- disconnectResponse
Response {
seq: 0,
type: 'response',
request_seq: 3,
command: 'disconnect',
success: true }
launch.json
{
// Use IntelliSense to learn about possible attributes.
// Hover to view descriptions of existing attributes.
// For more information, visit: https://go.microsoft.com/fwlink/?linkid=830387
"version": "0.2.0",
"configurations": [
{
"name": "Listen for XDebug",
"type": "php",
"request": "launch",
"log": true,
"port": 9000,
"pathMappings": {
"/var/www/public": "${workspaceRoot}/public"
}
}
]
}
php.ini, xdebug related lines:
[xdebug]
zend_extension="/usr/lib/php/20131226/xdebug.so"
xdebug.remote_enable=1
xdebug.remote_autostart=1
xdebug.remote_connect_back=1
xdebug.remote_host=10.0.2.2
xdebug.remote_log = /var/www/xdebug.log
I know there was an issue with VS Code a few weeks ago, could this be related? Everything seems to be working, except that it won't stop execution no matter what. I tried @sveggiani's fix but it didn't work for me.
 42pe
on 18 Apr 2018
42pe
on 18 Apr 2018
@42pe ${workspaceRoot} is deprecated in VSCode1.20.x. Use ${workspaceFolder} instead of it.
hidekuro
on 23 Apr 2018
- When setting a breakpoint it always states "unverified".
- Next, after a script is executed the log indicates that it's working (started, exited) but it seems that any breakpoint is actually set/reached.
- Nothing is logged on XDEBUG logs
Same
 ktmn
on 2 May 2018
ktmn
on 2 May 2018
Same
 juninhodeluca
on 13 May 2018
juninhodeluca
on 13 May 2018
Has there been any progress made here? I'm in the same boat; PHP running in vagrant. I can see xdebug connecting via the extension in vscode when I execute my script from vagrant, but I can't get breakpoints to be hit to save my life. It's really frustrating.
 BlacKCaT27
on 31 Aug 2018
BlacKCaT27
on 31 Aug 2018
@BlacKCaT27 I have this issue on some projects and not on some others and it always ends up being that the pathMappings are screwed (if you have verified that it is connecting).
42pe
on 31 Aug 2018
I met the same problem on Mac OSX Mojave, But I sloved it by adding these code like below:
[Xdebug]
zend_extension="xdebug.so"
xdebug.remote_autorestart=1
xdebug.remote_autostart=1
xdebug.remote_enable=1
xdebug.remote_port=9000
xdebug.profiler_enable=1
xdebug.remote_connect_back=1
Before I only add xdebug.remote_autorestart=1 line, the debug not working .
When I both add the two line
xdebug.remote_autostart=1
xdebug.remote_autorestart=1
It's work for me . I dont know why , but it can works now .
 chinaestone
on 17 Oct 2018
chinaestone
on 17 Oct 2018
Same problem with W10 & WSL -combo.
See another issue about this
Using fixed paths made BPs work on my setup.
 wex
on 24 Oct 2018
wex
on 24 Oct 2018
I'm developing locally and adding all the lines you posted (I only had zend_extension="xdebug.so") solved it for me.
I met the same problem on Mac OSX Mojave, But I sloved it by adding these code like below:
[Xdebug] zend_extension="xdebug.so" xdebug.remote_autorestart=1 xdebug.remote_autostart=1 xdebug.remote_enable=1 xdebug.remote_port=9000 xdebug.profiler_enable=1 xdebug.remote_connect_back=1Before I only add
xdebug.remote_autorestart=1line, the debug not working .
When I both add the two linexdebug.remote_autostart=1 xdebug.remote_autorestart=1It's work for me . I dont know why , but it can works now .
 EvanGoss
on 29 Oct 2018
EvanGoss
on 29 Oct 2018
I met the same problem on Mac OSX Mojave, But I sloved it by adding these code like below:
[Xdebug] zend_extension="xdebug.so" xdebug.remote_autorestart=1 xdebug.remote_autostart=1 xdebug.remote_enable=1 xdebug.remote_port=9000 xdebug.profiler_enable=1 xdebug.remote_connect_back=1Before I only add
xdebug.remote_autorestart=1line, the debug not working .
When I both add the two linexdebug.remote_autostart=1 xdebug.remote_autorestart=1It's work for me . I dont know why , but it can works now .
I don't think there is such a thing as xdebug.remote_autorestart
 mcshaman
on 6 Nov 2018
mcshaman
on 6 Nov 2018
I am having a very similar issue, except I get the xdebug logging to work. Everything is working fine, except it just won't stop at breakpoints, errors, warnings, etc. What's also weird is that this config was working a few weeks ago.
Vagrantfile:
Vagrant.configure("2") do |config|
    config.vm.box = "goodfolk/gf-lamp-5.6"
    config.vm.box_version = "1.0.1"
    config.vm.network "private_network", ip: "192.168.33.17"
    config.vm.network "forwarded_port", guest: 9000, host: 9000
    config.vm.hostname = "ybc.gfdev"
    config.vm.synced_folder ".", "/var/www", :mount_options => ["dmode=777", "fmode=755"]
    config.vm.provision "shell", path: "setupcron.sh"
end
Debug Console (after starting and manually stopping debug)
<- launchResponse
Response {
  seq: 0,
  type: 'response',
  request_seq: 2,
  command: 'launch',
  success: true }
-> disconnectRequest
{ command: 'disconnect',
  arguments: { restart: false },
  type: 'request',
  seq: 3 }
<- disconnectResponse
Response {
  seq: 0,
  type: 'response',
  request_seq: 3,
  command: 'disconnect',
  success: true }
launch.json
{
  // Use IntelliSense to learn about possible attributes.
  // Hover to view descriptions of existing attributes.
  // For more information, visit: https://go.microsoft.com/fwlink/?linkid=830387
  "version": "0.2.0",
  "configurations": [
    {
      "name": "Listen for XDebug",
      "type": "php",
      "request": "launch",
      "log": true,
      "port": 9000,
      "pathMappings": {
        "/var/www/public": "${workspaceRoot}/public"
      }
    }
  ]
}
php.ini, xdebug related lines:
[xdebug]
zend_extension="/usr/lib/php/20131226/xdebug.so"
xdebug.remote_enable=1
xdebug.remote_autostart=1
xdebug.remote_connect_back=1
xdebug.remote_host=10.0.2.2
xdebug.remote_log = /var/www/xdebug.log
I know there was an issue with VS Code a few weeks ago, could this be related? Everything seems to be working, except that it won't stop execution no matter what. I tried @sveggiani's fix but it didn't work for me.
I have tried to add config.vm.network "forwarded_port", guest: 9000, host: 9000 in the vagrantfile, but it gave me
Vagrant cannot forward the specified ports on this VM
while l look it up, nothing is running on port 9000.
these are all the port running for VM
homestead: 80 (guest) => 8000 (host) (adapter 1)
homestead: 443 (guest) => 44300 (host) (adapter 1)
homestead: 3306 (guest) => 2200 (host) (adapter 1)
homestead: 4040 (guest) => 2201 (host) (adapter 1)
homestead: 5432 (guest) => 54320 (host) (adapter 1)
homestead: 8025 (guest) => 8025 (host) (adapter 1)
homestead: 9600 (guest) => 9600 (host) (adapter 1)
homestead: 27017 (guest) => 27017 (host) (adapter 1)
homestead: 22 (guest) => 2222 (host) (adapter 1)
 aerilxx
on 4 Sep 2019
aerilxx
on 4 Sep 2019
I was having the same problem as other recent posters with Vagrant. This is what worked for me.
AFAIK, I don't have any special port forwarding.
First, I confirmed that the extension was working for remote debugging at all by enabling xdebug for cli and running a cli script within the VM. The script stopped at the breakpoint as expected.
The clue for the webserver problem was in the xdebug log:
[8710] Log opened at 2020-05-16 04:43:00
[8710] I: Checking remote connect back address.
[8710] I: Checking header 'HTTP_X_FORWARDED_FOR'.
[8710] I: Checking header 'REMOTE_ADDR'.
[8710] I: Remote address found, connecting to 10.20.1.1:9000.
[8710] E: Time-out connecting to client (Waited: 200 ms). :-(
[8710] Log closed at 2020-05-16 04:43:00
What stood out to me was that xdebug was trying to connect to the address 10.20.1.1 instead of 10.0.2.2.
xdebug.remote_connect_back was enabled at the time, so apparently xdebug was trying to connect back to the "remote" at the address it was getting from the host. Since the guest actually sees the host as 10.0.2.2, it must have been unable to reach the "remote".
The fix was disabling xdebug.remote_connect_back (and restarting apache).
Here's my xdebug config:
[XDebug]
zend_extension="/usr/lib/php/7.3/modules/xdebug-2.9.5.so"

xdebug.coverage_enable=0
xdebug.default_enable=1

xdebug.remote_enable=1
xdebug.remote_connect_back=0
xdebug.remote_host=10.0.2.2
xdebug.remote_port=9000
xdebug.remote_log=/vagrant/log/xdebug.log
xdebug.remote_autostart=1

xdebug.idekey="vscode"

xdebug.max_nesting_level=256
 kentr
on 16 May 2020
kentr
on 16 May 2020
Same here
 allaniftrue
on 24 Mar 2021
allaniftrue
on 24 Mar 2021
Hello @allaniftrue. Is the problem for you a recent one? Can you provide your launch.json, xdebug.log and extension log as per instructions?
 zobo
on 24 Mar 2021
zobo
on 24 Mar 2021
* launch.json*
{
    // Use IntelliSense to learn about possible attributes.
    // Hover to view descriptions of existing attributes.
    // For more information, visit: https://go.microsoft.com/fwlink/?linkid=830387
    "version": "0.2.0",
    "configurations": [
        {
            "name": "Listen for XDebug",
            "type": "php",
            "request": "launch",
            "port": 9000
        },
        {
            "name": "Launch currently open script",
            "type": "php",
            "request": "launch",
            "program": "${file}",
            "cwd": "${fileDirname}",
            "port": 9000
        }
    ]
}
xdebug log
[88413] Log opened at 2021-03-24 04:35:54.490573
[88413] [Step Debug] INFO: Connecting to configured address/port: localhost:9000.
[88413] [Step Debug] WARN: Creating socket for 'localhost:9000', poll success, but error: Operation now in progress (19).
[88413] [Step Debug] WARN: Creating socket for 'localhost:9000', poll success, but error: Operation now in progress (19).
[88413] [Step Debug] ERR: Could not connect to debugging client. Tried: localhost:9000 (through xdebug.client_host/xdebug.client_port) :-(
[88413] Log closed at 2021-03-24 04:35:54.498451

[88420] Log opened at 2021-03-24 04:35:56.288101
[88420] [Step Debug] INFO: Connecting to configured address/port: localhost:9000.
[88420] [Step Debug] WARN: Creating socket for 'localhost:9000', poll success, but error: Operation now in progress (19).
[88420] [Step Debug] WARN: Creating socket for 'localhost:9000', poll success, but error: Operation now in progress (19).
[88420] [Step Debug] ERR: Could not connect to debugging client. Tried: localhost:9000 (through xdebug.client_host/xdebug.client_port) :-(
[88420] Log closed at 2021-03-24 04:35:56.293285

[88421] Log opened at 2021-03-24 04:35:56.346765
[88421] [Step Debug] INFO: Connecting to configured address/port: localhost:9000.
[88421] [Step Debug] WARN: Creating socket for 'localhost:9000', poll success, but error: Operation now in progress (19).
[88421] [Step Debug] WARN: Creating socket for 'localhost:9000', poll success, but error: Operation now in progress (19).
[88421] [Step Debug] ERR: Could not connect to debugging client. Tried: localhost:9000 (through xdebug.client_host/xdebug.client_port) :-(
[88421] Log closed at 2021-03-24 04:36:15.921205
xdebug config
xdebug.mode=debug
xdebug.start_with_request=yes
zend_extension="xdebug.so"
I have tried different configurations but this is the latest config I have. Read some article that v3.x has simplified it to this config
```
allaniftrue
on 24 Mar 2021
Xdebug cant connect to the IDE on localhost. The error message is a bit strange tho.
can you describe your setup? Are you using Vagrant? Docker? Do you have your whole setup on Linux? Php and VSCode?
zobo
on 24 Mar 2021
I am using MacOS Bigsur and running Laravel Valet for my dev environment.
allaniftrue
on 24 Mar 2021
In this case there should no issues regards to remote host.
I'm currently not able to reproduce your setup as my Air is not playing along.
What I'd test is:
- when you run the debugger (F5 - Listen for Xdebug) is there actually a LISTENING entry in netstat or lsof (
sudo lsof -i -P | grep LISTEN) ? - if there is and php/Xdebug still can't connect to it, could there be a local firewall?
- can you connect to it via
telnetorncand does it show up on DEBUG CONSOLE? It should readnew connection.
zobo
on 29 Mar 2021
In this case there should no issues regards to remote host.
I'm currently not able to reproduce your setup as my Air is not playing along.
What I'd test is:
- when you run the debugger (F5 - Listen for Xdebug) is there actually a LISTENING entry in netstat or lsof (
sudo lsof -i -P | grep LISTEN) ?- if there is and php/Xdebug still can't connect to it, could there be a local firewall?
- can you connect to it via
telnetorncand does it show up on DEBUG CONSOLE? It should readnew connection.

Yes there is a port listening. Firewall is disabled and yes I can connect with telnet :c
allaniftrue
on 5 Apr 2021
I got my Air working and I can debug PHP on it. I'll drop the configs here a bit later and you can compare them.
Ah. I already see something: VSCode is listening on port 9003 your Xdebug connects to port 9000.
Port 9000 was default for Xdebug 2, port 9003 is for Xdebug 3. Here's the rationale for the change: https://bugs.xdebug.org/view.php?id=1848
It is strange, because the launch.json you posted back up says port: 9000. Is that the right config?
Either try to change you launch config to listen on port 9000 or your php.ini to connect to port 9003.
If you still have Xdebug 2 then the directive is xdebug.remote_port=9003.
I hope this helps.
zobo
on 6 Apr 2021
Thank you @zobo for helping. Unfortunately, I can't still make it to work :c
Sorry, I was doing some trial and error and sticked to 9003.
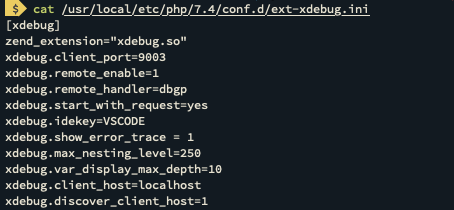
I am using version xdebug v3
php > echo phpversion('xdebug');
3.0.3
My launch.json was also updated
{
    // Use IntelliSense to learn about possible attributes.
    // Hover to view descriptions of existing attributes.
    // For more information, visit: https://go.microsoft.com/fwlink/?linkid=830387
    "version": "0.2.0",
    "configurations": [
        {
            "name": "Listen for XDebug",
            "type": "php",
            "request": "launch",
            "port": 9003
        },
        {
            "name": "Launch currently open script",
            "type": "php",
            "request": "launch",
            "program": "${file}",
            "cwd": "${fileDirname}",
            "port": 9003
        }
    ]
}
This is quite crazy. One more thing I see. It used to be, that zend_extension required an absolute path not relative. I'm not sure if this is still the case...
Also try to add "stopOnEntry": true to your launch.json just in case if Xdebug can connect to vscode...
There are some obsolete and unneeded directives in the ini file... Try to remove discover_client_host as the host is fixed. Remove remote_handler and remote_enable as they are obsolete (Xdebug 2). Add back xdebug.mode=debug.
Try to make a simple test.php and add a phpinfo() in there to check that Xdebug is loaded and all the defines are ok. Try it with php cli and web... Maybe you have a conflicting ini somewhere.
Try to read this page if you see something I don't: https://xdebug.org/docs/step_debug
zobo
on 7 Apr 2021
Thank you @zobo it's now working.
allaniftrue
on 13 Apr 2021
Great! Was the cause zend_extension path?
I'll close this issue.
zobo
on 13 Apr 2021
Great! Was the cause
zend_extensionpath?
I'll close this issue.
I just followed your instructions and it worked! Thank you once again. ^(_ _)^
Also try to add "stopOnEntry": true to your launch.json just in case if Xdebug can connect to vscode...
There are some obsolete and unneeded directives in the ini file... Try to remove discover_client_host as the host is fixed. Remove remote_handler and remote_enable as they are obsolete (Xdebug 2). Add back xdebug.mode=debug.
Related issues
 jplew
·
12Comments
jplew
·
12Comments
 mitchellnemitz
·
11Comments
mitchellnemitz
·
11Comments
 Didel
·
4Comments
Didel
·
4Comments
 evs-xsarus
·
5Comments
evs-xsarus
·
5Comments
 andrews05
·
10Comments
andrews05
·
10Comments
Most helpful comment
I met the same problem on Mac OSX Mojave, But I sloved it by adding these code like below:
Before I only add
xdebug.remote_autorestart=1line, the debug not working .When I both add the two line
It's work for me . I dont know why , but it can works now .