Vscode-php-debug: Unable to continue if breakpoint is reached and cannot access variable in watched expresion
PHP version: 7.0.15-0ubuntu0.16.10.4
XDebug version: Xdebug v2.4.0
Adapter version: 1.10.0
Steps:
- press F5 on the code below
- set breakpoint to the line
echo "Hello"; - add the expression
self::ato the section Watch (it's a variable nowhere used in the script) - load the PHP script in web browser - redirect to VScode is done
- press Continue in VScode
Expected result:
- script finishes
Actual result:
- nothing happens, no GUI response
Code snippet to reproduce:
<?php
echo "Hello";
echo "World";
?>
Your launch.json:
{
    "version": "0.2.0",
    "configurations": [
        {
            "name": "Listen for XDebug",
            "type": "php",
            "request": "launch",
            "port": 9000
        },
        {
            "name": "Launch currently open script",
            "type": "php",
            "request": "launch",
            "program": "${file}",
            "cwd": "${fileDirname}",
            "port": 9000
        }
    ]
}
XDebug php.ini config:
xdebug.remote_enable=1
xdebug.remote_autostart = 1
xdebug.remote_handler=dbgp
xdebug.remote_mode=req
xdebug.remote_host=127.0.0.1
xdebug.remote_port=9000
xdebug.max_nesting_level=300
xdebug.remote_log=/tmp/xdebug.log
XDebug logfile - after you click on Continue in debugger:
<- run -i 28
-> <response xmlns="urn:debugger_protocol_v1" xmlns:xdebug="http://xdebug.org/dbgp/xdebug" command="eval" transaction_id="12" status="running" reason="ok"><error code="206"><message><![CDATA[error evaluating code]]></message></error></response>
Adapter logfile - after you click on Continue in debugger:
-> continueRequest
{ command: 'continue',
  arguments: { threadId: 1 },
  type: 'request',
  seq: 25 }
 mirao
mirao
All 28 comments
I need full logs, one request isn't helpful
 felixfbecker
on 8 Mar 2017
felixfbecker
on 8 Mar 2017
Here you are: xdebug.txt
Unfortunately full log from debug console in vscode cannot be copied.
mirao
on 8 Mar 2017
I know it's hard to copy the logs from VS Code, but I need at least the evalRequest + response and the response to the continueRequest
felixfbecker
on 8 Mar 2017
When debugger is starting:
<- launchResponse
Response {
  seq: 0,
  type: 'response',
  request_seq: 2,
  command: 'launch',
  success: true }
-> evaluateRequest
{ command: 'evaluate',
  arguments: { expression: 'self::a', context: 'watch' },
  type: 'request',
  seq: 3 }
<- evaluateResponse
Response {
  seq: 0,
  type: 'response',
  request_seq: 3,
  command: 'evaluate',
  success: false,
  message: 'Cannot evaluate code without a connection',
  body:
   { error:
      { id: 0,
        format: 'Cannot evaluate code without a connection',
        showUser: true } } }
and after reload of browser:
-> evaluateRequest
{ command: 'evaluate',
  arguments: { expression: 'self::a', frameId: 1, context: 'watch' },
  type: 'request',
  seq: 13 }
<- evaluateResponse
Response {
  seq: 0,
  type: 'response',
  request_seq: 13,
  command: 'evaluate',
  success: true,
  body:
   { result: 'Cannot access self:: when no class scope is active',
     variablesReference: 0 } }
continueRequest has no response, in log there is only the request
-> continueRequest
{ command: 'continue',
  arguments: { threadId: 1 },
  type: 'request',
  seq: 16 }
Anything logged in the dev tools?
felixfbecker
on 8 Mar 2017
There is one thing in dev tools when I start debugger (F5):
[Extension Host] Error: certificate has expired
    at Error (native)
    at TLSSocket.<anonymous> (_tls_wrap.js:1060:38)
    at emitNone (events.js:86:13)
    at TLSSocket.emit (events.js:185:7)
    at TLSSocket._finishInit (_tls_wrap.js:584:8)
    at TLSWrap.ssl.onhandshakedone (_tls_wrap.js:416:38)
https://ticino.blob.core.windows.net/sourcemaps/653f8733dd5a5c43d66d7168b4701f94d72b62e5/core/vs/workbench/electron-browser/vs/workbench/electron-browser/file:/Users/code/vsoagent/_work/2/s/src/vs/workbench/electron-browser/extensionHost.ts
But nothing appended when I click on Continue in the mentioned case.
mirao
on 8 Mar 2017
Same happening here :(
 fmmarmello
on 29 Jun 2017
fmmarmello
on 29 Jun 2017
This was working nice for quite sometime, but in the last few months I have this issue. Cannot do anything when it stops in the breakpoint.
The only thing I can think was a VS Code/Extension update. I don't think I updated anything else. PHP and XDebug are untouched.
 pcostarg
on 12 Sep 2017
pcostarg
on 12 Sep 2017
Same problem here ... :/
xdebug and vscode driver worked beautifully untill yesterday (vscode update) xdebug was from xenial package.
Something seen to be stuck in the pipe ... right now.
And this is quite a blocking situation.
XDebug seems to operate fine until a breakpoint is reached and it is requested a stepIn/Out or next or continue, in which case no answer seems to be received, debugger is still operational though (evaluteRequest is answered ok).
providing some log data :
xdbgvscode.log
and install details :
Linux 4.4.0-96-generic #119-Ubuntu x86_64 GNU/Linux
Xdebug v2.6.0-dev (now compiled/installed from github head)
DBGp - Common DeBuGger Protocol Revision : 1.145 (from phpInfo())
VSCode : Version 1.16.1 Commit 27492b6bf3acb0775d82d2f87b25a93490673c6d
.vscode/extensions/felixfbecker.php-debug-1.11.1
.vscode/extensions/felixfbecker.php-intellisense-1.5.1
Thanks for any info on this ...
Lorenzo
 oxomoxo
on 28 Sep 2017
oxomoxo
on 28 Sep 2017
The tip in #150 helped me solve the issue!
 datenzar
on 18 Oct 2017
datenzar
on 18 Oct 2017
Same problem here.
Adapter version: 1.12.6,
local PHP: PHP 7.0.32-0ubuntu0.16.04.1 (cli) ( NTS )
remote PHP: PHP 7.2.11 (cli) (built: Oct 24 2018 04:09:49) ( NTS )
XDebug: 2.6.1
Was this issue confirmed? Are there any details missing? Watch is unusable with this issue.
 anatoli26
on 13 Dec 2018
anatoli26
on 13 Dec 2018
I'm getting the same issue, and the test case given by mirao in the original post reproduces the issue 100% of the time. It's actually hard totell on my end whether this would be an issue on xdebug's side of things or on the extension.
The message returned when the bad watched expression is evaluated makes sense :
-> evaluateRequest
{ command: 'evaluate',
  arguments: { expression: 'self::a', frameId: 1, context: 'watch' },
  type: 'request',
  seq: 9 }

<- evaluateResponse
Response {
  seq: 0,
  type: 'response',
  request_seq: 9,
  command: 'evaluate',
  success: true,
  body:
   { result: 'Undefined class constant \'a\'',
     variablesReference: 0 } }
<- eval -i 6 -- c2VsZjo6YQ==
<response xmlns="urn:debugger_protocol_v1" xmlns:xdebug="http://xdebug.org/dbgp/xdebug" command="eval" transaction_id="6" status="break" reason="ok"><xdebug:message filename="file://C:/Apache24/xdebug:/debug-eval" lineno="1" exception="Error"><![CDATA[Undefined class constant 'a']]></xdebug:message></response>
But then, as soon as someone tries to step through the code any further, xdebug throws an error 206 which isn't caught (or at least logged) by vscode-php-debug.
-> continueRequest
{ command: 'continue',
  arguments: { threadId: 1 },
  type: 'request',
  seq: 13 }
<- run -i 9
<response xmlns="urn:debugger_protocol_v1" xmlns:xdebug="http://xdebug.org/dbgp/xdebug" command="eval" transaction_id="6" status="running" reason="ok"><error code="206"><message><![CDATA[error evaluating code]]></message></error></response>
XDebug then stops logging any queries made to it through VSCode, short of attempting to shut it down.
I'm not familiar enough with the xdebug protocol to really tell which side is causing issues here, but the issue is pretty significant (you can trigger this issue by simply having a variable going out of scope!) and is preventing me from using this extension pretty much at all.
 sm-Fifteen
on 15 Jan 2019
sm-Fifteen
on 15 Jan 2019
Here's a minimal test case to show how easy that bug is to trigger in what can easily be a real-life test scenario:
<?php

class MyClass {
    const A = 'A';

    function print_a() {
        // Try setting a watch expression on self::A
        xdebug_break();
        echo(self::A); // self::A is in scope, everything is fine
    }
}

$obj = new MyClass();
$obj->print_a();
xdebug_break(); // self::A is out of scope, evaluation fails
// XDebug/VSCode debugger becomes unresponsive and needs to be terminated
Reproduces the issue 100% of the time on the following configuration :
- Windows 7
- PHP 7.0.30
- XDebug 2.6.0
- VSCode 1.30.2
- PHP Debug 1.12.6
EDIT: Full execution logs for the adapter (vscode debug console) and
XDebug for the test case specified above.
sm-Fifteen
on 15 Jan 2019
Same problem: having an out-of-scope variable in watch list causes failure of the protocol (continue, step over, step into, step out no longer respond).
Easy to replicate issue: set a watch item for $this->something, but set a breakpoint outside of a class.
At minimum can you bubble up the error from the protocol to alert the user when <error> is seen?
<response xmlns="urn:debugger_protocol_v1" xmlns:xdebug="https://xdebug.org/dbgp/xdebug" command="eval" transaction_id="21" status="running" reason="ok"><error code="206"><message><![CDATA[error evaluating code]]></message></error></response>
 robert-n-cristof
on 20 Dec 2019
robert-n-cristof
on 20 Dec 2019
The tip in #150 helped me solve the issue!
This also solved my issue. Clean variables in the watch part of the screen
 Lovor01
on 21 Dec 2019
Lovor01
on 21 Dec 2019
I cannot reproduce this with latest Xdebug. Perhaps other fixes solved this.
 zobo
on 10 May 2021
zobo
on 10 May 2021
I'm using the latest Xdebug for PHP 7.4 and I can confirm it is still an issue.
And if this can't be fixed you really ought to include a note on the troubleshooting section of the VSCode store page to clear watch variables, would have saved me a lot of time.
 hedgehog90
on 7 Jul 2021
hedgehog90
on 7 Jul 2021
I tried it with two combinations:
PHP 7.4.13 (cli) (built: Nov 24 2020 12:43:32) ( ZTS Visual C++ 2017 x64 )
Copyright (c) The PHP Group
Zend Engine v3.4.0, Copyright (c) Zend Technologies
    with Xdebug v2.9.5, Copyright (c) 2002-2020, by Derick Rethans
and
PHP 7.4.13 (cli) (built: Nov 24 2020 12:43:32) ( ZTS Visual C++ 2017 x64 )
Copyright (c) The PHP Group
Zend Engine v3.4.0, Copyright (c) Zend Technologies
    with Xdebug v3.0.4, Copyright (c) 2002-2021, by Derick Rethans
The code I used is
<?php

class MyClass {
    const A = 'A';

    function print_a() {
        // Try setting a watch expression on self::A
        xdebug_break();
        echo(self::A); // self::A is in scope, everything is fine
    }
}

$obj = new MyClass();
$obj->print_a();
xdebug_break(); // self::A is out of scope, evaluation fails
// XDebug/VSCode debugger becomes unresponsive and needs to be terminated
echo "1\n";
echo "2\n";
echo "3\n";
echo "4\n";
What I get is:
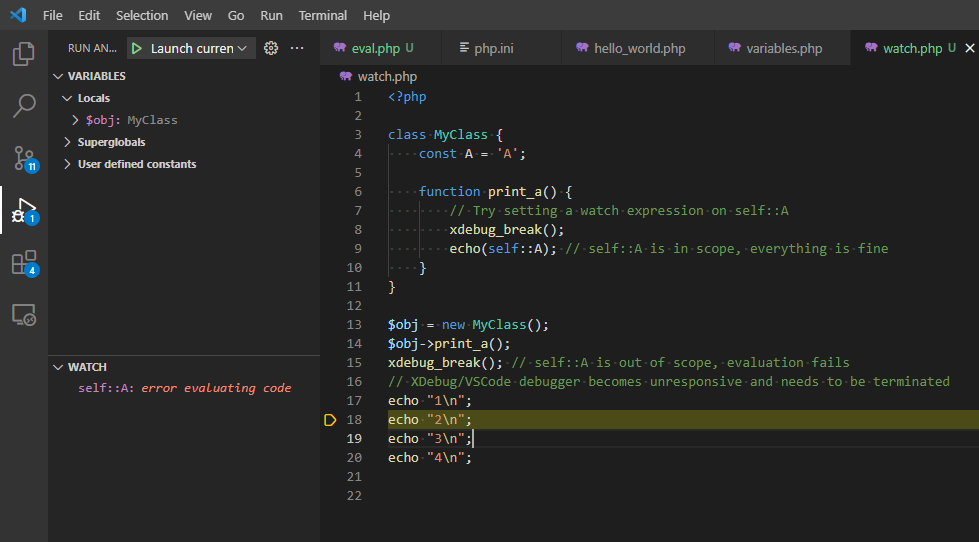
But the debugger keeps working normally.
Can you provide source code to reproduce along with the log from Debug Console.
Best!
zobo
on 7 Jul 2021
How odd.
So I removed the watch variables and it worked.
I've now tried adding some nonsense variables to the watch list and it still worked.
I then added some watch variables with bad syntax and that broke the stepping functionality...
I don't recall having bad syntax in my watch list before though so I am confused, and I can't see what they were to verify that.
hedgehog90
on 7 Jul 2021
Can you give me a specific example? I’d like to be able to reproduce it. Thanks!
zobo
on 7 Jul 2021
Try adding 123() to the watch list.
hedgehog90
on 7 Jul 2021
Also here's a log I made when I had the bad watch variables, I couldn't make any sense of it myself:
xdebug_remote.log
hedgehog90
on 7 Jul 2021
Thanks! Will look at it later today and will ket you know. Thanks!
zobo
on 7 Jul 2021
If I read the dump correctly you have in your watch pane the following variables:
$datacabtv_versionthis.$.player.deinterlacethis.$["stream-file"]
Is that correct?
I don't think the last two are valid PHP and would cause a syntax error in normal code. Now, I could not reproduce VSCode hanging, but I could see the "broken stepping" case. This comes from PHP/Xdebug, since watch variables are being EVALuated this breaks the PHP VM - if @derickr has time he can shed some light on such case.
What I could perhaps do is use property_get instead of eval. But I'd need to try all contexts for it (Local, Supr globals, constants). So if the user adds a lot of watches and all are somehow out of scope, each step could become slower...
I'll do some tests and see what comes of it.
zobo
on 8 Jul 2021
Ahh, those variables are from some javascript in the same workspace. It all makes sense now.
Considering the age of this reported issue, I'm curious how more people haven't run into this problem tbh.
Anyway thanks for looking into it, it'd be great to see some improvement here as I'm constantly testing javascript and php in the same workspace.
hedgehog90
on 8 Jul 2021
I've fixed several bugs in Xdebug related to this since 2.6.1. Xdebug should not break in these weird evals, but if it does - > https://bugs.xdebug.org
 derickr
on 8 Jul 2021
derickr
on 8 Jul 2021
Here we go: https://bugs.xdebug.org/view.php?id=1993
zobo
on 11 Jul 2021
Good news: https://github.com/xdebug/xdebug/pull/759 hopefully to be released soon. I also tried to use property_get instead of eval and it could work, but there's some internal structure challenges here. I'm also not sure if people use watch to run functions...
zobo
on 17 Jul 2021
Related issues
 lirondu
·
11Comments
lirondu
·
11Comments
 johnbillion
·
11Comments
johnbillion
·
11Comments
 bilogic
·
7Comments
bilogic
·
7Comments
 mitchellnemitz
·
11Comments
mitchellnemitz
·
11Comments
 leslieeilsel
·
7Comments
leslieeilsel
·
7Comments
Most helpful comment
The tip in #150 helped me solve the issue!