Vscode-ng-language-service: Intellisense starts up very slowly for large projects
Original: https://github.com/angular/vscode-ng-language-service/issues/318
Description:
Well i've tried now and for me the problems stay the same. Intellisense in a class to own property does take too long to pop up. With disabled language service it just works fine. Even though it is a reference on a class property itself.
But when i hover or force the intellisense it takes always ~ 20 and above seconds to load. Thats horrible. The only way to get it back is disabling the vs-code plugin.


Extension-Log:
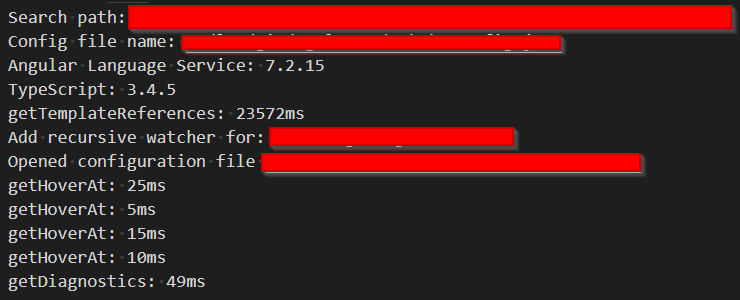
My setup:
- Big project with a lot of modules per lazy loading
- Some libraries like DevExtreme, ng-bootstrap, lodash, moment, etc
- Our own internal angular library
- Angular Version 7.2.15
- Angular Language Service Plugin 0.800.0
Reproduction:
I did take a look at the extensions log and played a bit around and the following i can say:
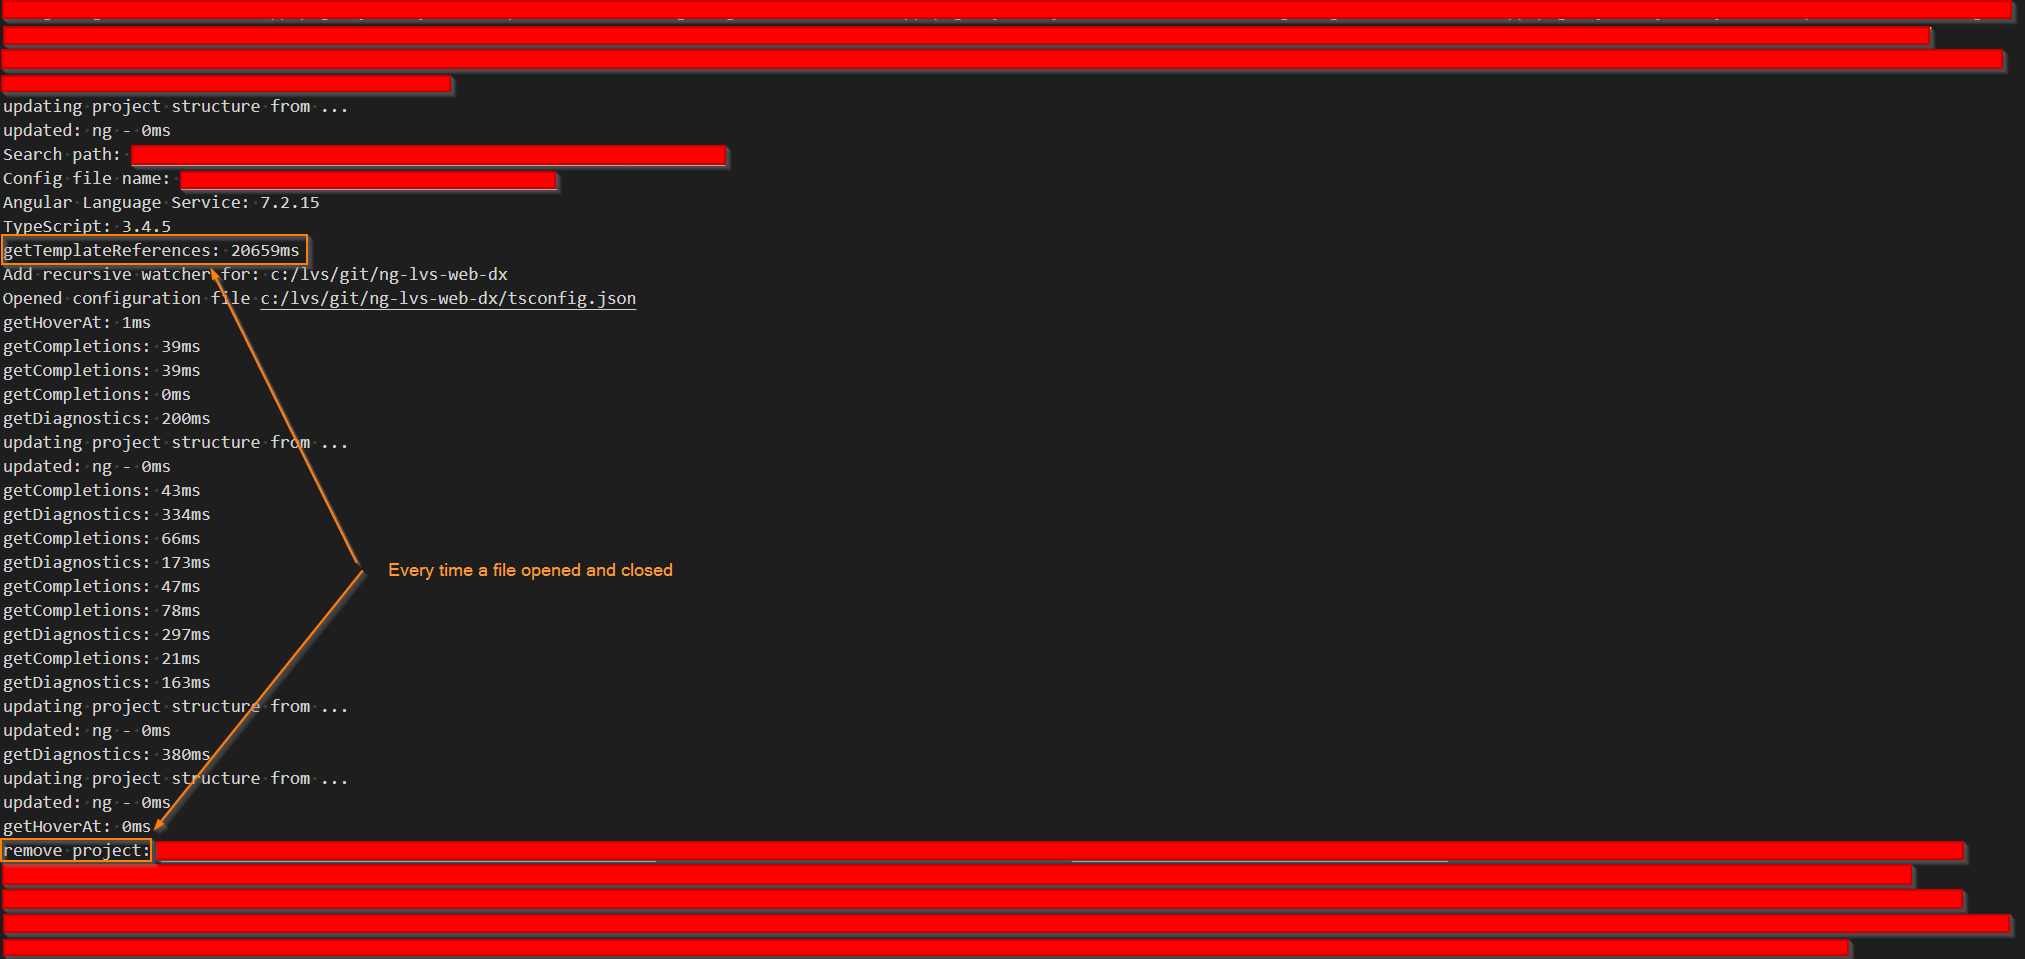
- open only 1 file, e.g. any component.ts
- take a look at the plugins debug output
- wait until getTemplateReferences comes in
- close the actual file and reopen it
- take a look at the plugins debug console, you should now see that everything has to be loaded again because of the remove project section
- it takes the same time as the first getTemplateReferences
Possible reason:
I think the problem is, that the extension always initialize the complete project stack on each file open/close not as the default vscode behaviour the first time a file gets opened. This happens only when only one single file opend and directly closed. As long as other files stay opened the plugin keeps the data, but if you close also the last open file (editor) then the project remove section appears in the log and the plugin remove the loaded references. Now next time you open a new file it has to complete reinitialize the references.

Possible solution:
- Keep the references also when the last editor is closed and reinitialize only on window reload or startup or split it in small and complete reload. The small could be a reload of only changed/new/moved files and the complete on first file opened.
- Add a loading spinner like the default JS/TS initializing do, so that the developer get a response from the plugin that it's loading, if that is possible...
 JohnnyDevNull
All 19 comments
@JohnnyDevNull I think you might have the wrong version.
 JonWallsten
on 3 Jun 2019
JonWallsten
on 3 Jun 2019
@JonWallsten may it be, but does it also reinitalize on each open/close action with the new one?
VSCode does it only once a file gets opened. The angular plugin on each open/close action.
Edit:
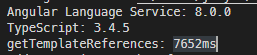
After update of the language service...

The problem stay the same... each file open/close the minimum wait time is the getTemplateReferences time. What i can say is, that the output from the remove project section is heavily long. I use the DevExtreme Library, our own internal Library and some others so the Plugin has a lot to load and remove...
The Solution
The solution for this problem can be to load the projects references and cache them as the default vscode service does. Only once the first file gets opened and not every open/close cycle of a file, so that the next file has to initialize everything again and again...
JohnnyDevNull
on 3 Jun 2019
I takes 7 seconds for me the first time, and then 0ms for the subsequent files.
Edit: I see, you're using a lot more stuff then we do. Maybe that's what differs.
JonWallsten
on 3 Jun 2019
Well, how big is your project?
I have here a pretty big project with ~ 50 modules loaded per lazy loading and some angular libraries. DevExtreme, ng-bootstrap, lodash, moment and oauth...
The process to reproduce...
- open any component.ts
- take a look at the plugins debug output
- wait until getTemplateReferences comes in
- close the actual file and reopen it
- take a look at the plugins debug console, you should now see that everything has to be loaded again because of the "remove project"
- it takes the same time as the first getTemplateReferences
I've edited my above post with a possible solution...
JohnnyDevNull
on 3 Jun 2019
Let's just say ours is tiny compared to yours.
I checked my log again. I don't have those "remove project" at all.
And I can't reproduce with your steps. I also installed the old plugin again to check the log.
It actually looks fine in the log, it's just super slow. I guess someone with better knowledge about this need to help you.
JonWallsten
on 3 Jun 2019
It is important to know that you have to run VSCode in Administrator mode on Windows to get more detail and i use the system setup instead of the users.
Also one thing is importand... as long as you have other files open the cleanup won't happen. Only when you close all open files (editors) the remove project section appears and from that moment it has to initalize complete again.
So when you are a developer who like a clean editor with not that much open files then you run devinitly in this problem with the described initializing/cleanup loop from the angular plugin.
In my case i mostly have a maximum of 1 to 3 open files.
JohnnyDevNull
on 3 Jun 2019
Ignore, I just saw the other repo deprecate. Hopefully I won't have the same issues... ill let you guys know if I do
 jpike88
on 3 Jun 2019
jpike88
on 3 Jun 2019
@JohnnyDevNull I have replicated the issue per your description (I also have a large number of components, DevExtreme, etc). Opened a single ts file. Long delay. Opened a second one. Instant. Closed both files. Reopened single file. Long delay. Great find. At least a quick work around is..never close all files 8).
 nhustak
on 3 Jun 2019
nhustak
on 3 Jun 2019
@JohnnyDevNull That explains it. I usually just close all the files if there's some issue or something is slow. So it didn't affect me when I tried.
JonWallsten
on 3 Jun 2019
@JohnnyDevNull thank you for the feedback! I'm curious, has the language service ever worked for you?
As far as I know, the architecture of the language service has been this way since the first release.
Once I have the tsserver plugin working, I'd like to investigate if this issue could be solved by caching TS programs.
 kyliau
on 3 Jun 2019
kyliau
on 3 Jun 2019
In large projects not really. I'am a fan of having not much open editors so i often walking in this reinitializing loop. In our smaller projects i haven't recognized this issue, but since i'am on a migration project from migrating a old Java Swing ADF application to Angular this is a huge problem for me and my colleagues and you won't see any loading spinner that the plugin is loading. So for the enduser it seems that the IntelliSense is broken. It would be nice if there is a way to hang in a loading animation like the JS/TS Language Service does in the footer on the bottom left.
JohnnyDevNull
on 4 Jun 2019
Would be great if google dedicated more resources to this, angular and TS go hand in hand, and vscode is pretty much what everyone uses for it...
jpike88
on 4 Jun 2019
Just letting you all know, I'm definitely noticing much larger processing times using this plugin than the one (now deprecated) which used the built in tsserver.
jpike88
on 4 Jun 2019
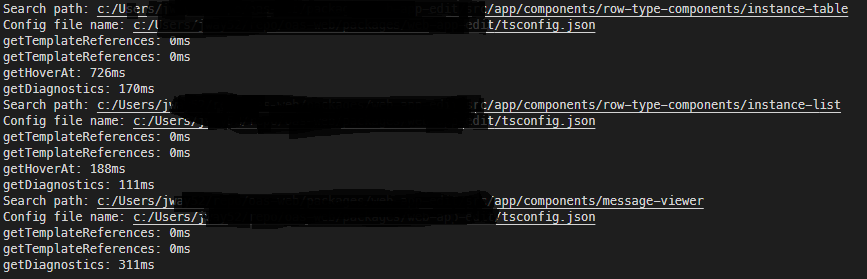
I think the most problems coming from the duplicate tsserver running. I also recognize performance problems from jump to source or displaying library informations on hovering types and displaying inline docs with pressed CTRL and hovering. While here the debug output from the plugin looks smooth there is invisible blocking time between the Search Path step and the Config file name
Reproduction:
- define something like this:
  public gridEditingOptions: DevExpress.ui.dxDataGridOptions['editing'] = {
    mode: 'batch',
    allowUpdating: true,
    allowAdding: true,
    allowDeleting: true,
    startEditAction: 'dblClick',
    selectTextOnEditStart: true,
    useIcons: true
  };
hovering the type goes mostly fast:

now move away hover it again and press and hold CTRL:

Some times it works fast when only hovering, but mostly especially with pressed CTRL it takes some time, but the debug console looks clean.
- hover, press CTRL and click to jump to source or press F12: same as 3. sometimes with long blocking time.
EDIT:
After trying to find out where this comes i can only say that i can push the ram and cpu consumption up with a hovering and moveaway loop
- No file open and waited some time so that vscode calmed down:
- after hovering i think 20 times... with each step the loading takes a bit longer...

EDIT 2:
With disabled language service it opens up instantly every time, no slow down, no memory or cpu load.
Notice:
I move this to a new issue, because this is no startup problem...
JohnnyDevNull
on 4 Jun 2019
Update: v0.900.0 should have solved most performance issues. It's a complete rewrite of the underlying language service, and much improvements have been made to speed up initial load time and incremental parsing.
kyliau
on 12 Nov 2019
That is awesome to hear.
nhustak
on 12 Nov 2019
Here's some highlights on what we did to improve performance:
- Project management is now completely managed by TypeScript.
The code was forked from TypeScript before, but now it has been completely removed. - Cache module resolution at startup
Earlier versions do not cache this data, and it's why performance suffered. We saw improvements in terms of number of filesystem operations by as much as 100x. - Better incremental parsing by carefully invalidating part of the Program.
For example, changes to an external template will not change the Program, thus no extra computation. - Reuse single instance of StaticReflector and Resolver
These were thrown away whenever the Program changes, but now a single instance is used throughout the lifetime of the service.
All these changes are in version 9 of the language service. An RC version has been released and could be downloaded from the Release page. The new extension will be published to the marketplace in a few weeks time.
kyliau
on 12 Nov 2019
The new extension is now live. Please download it from https://marketplace.visualstudio.com/items?itemName=Angular.ng-template
I'd like to close this issue for now. If there's any performance bugs that remain, please open a new issue. Thank you!
kyliau
on 25 Nov 2019
This issue has been automatically locked due to inactivity.
Please file a new issue if you are encountering a similar or related problem.
Read more about our automatic conversation locking policy.
_This action has been performed automatically by a bot._
![angular-automatic-lock-bot[bot] picture](https://avatars.githubusercontent.com/in/40213?v=4&s=40) angular-automatic-lock-bot[bot]
on 17 Feb 2020
angular-automatic-lock-bot[bot]
on 17 Feb 2020
Related issues
 yjaaidi
·
5Comments
yjaaidi
·
5Comments
 fxck
·
6Comments
fxck
·
6Comments
 mafredri
·
5Comments
mafredri
·
5Comments
 daveriedstra
·
3Comments
daveriedstra
·
3Comments
 seangwright
·
4Comments
seangwright
·
4Comments
Most helpful comment
Here's some highlights on what we did to improve performance:
The code was forked from TypeScript before, but now it has been completely removed.
Earlier versions do not cache this data, and it's why performance suffered. We saw improvements in terms of number of filesystem operations by as much as 100x.
For example, changes to an external template will not change the Program, thus no extra computation.
These were thrown away whenever the Program changes, but now a single instance is used throughout the lifetime of the service.
All these changes are in version 9 of the language service. An RC version has been released and could be downloaded from the Release page. The new extension will be published to the marketplace in a few weeks time.