Vscode-js-debug: Unbound Breaking point.
Hi Team,
Whenever I start my debugger, my breakpoints goes to Unbound Breakpoint.
I am using Node Version 12.18.2
VS Code Version: 1.49.3
NOTE: Although I can see the console.log , Just the breakpoints are not working as expected.
Below is my laaunch.json
{
// Use IntelliSense to learn about possible attributes.
// Hover to view descriptions of existing attributes.
// For more information, visit: https://go.microsoft.com/fwlink/?linkid=830387
"version": "0.2.0",
"configurations": [
{
"type": "node",
"request": "launch",
"name": "wskdebug lead2loyaltyaio/dispatcher",
"runtimeExecutable": "wskdebug",
"args": [ "namespace/dispatcher", "C:/Users/name/Documents/cif/NodeCodeRepo/Node_code_Repo/lead2loyaltyaio-nodejs/src/remote/cartResolver.js", "-l" ],
"localRoot": "C:/Users/name/Documents/cif/NodeCodeRepo",
"remoteRoot": "/code",
"outputCapture": "std"
}
]
}
I have tried using pwa-node as well, but didn't worked out.
 nikhilkumar24dev
All 14 comments
Please collect a trace log using the instructions in the issue template
 connor4312
on 4 Oct 2020
connor4312
on 4 Oct 2020
How do I provide tracelog ?
nikhilkumar24dev
on 5 Oct 2020
If you're able to, add
"trace": trueto yourlaunch.jsonand reproduce the issue. The location of the log file on your disk will be written to the Debug Console. Share that with us.⚠️ This log file will not contain source code, but will contain file paths. You can drop it into https://microsoft.github.io/vscode-pwa-analyzer/index.html to see what it contains. If you'd rather not share the log publicly, you can email it to [email protected]
connor4312
on 5 Oct 2020
Hope this helps. my vs code version:
Version: 1.49.3
Commit: 2af051012b66169dde0c4dfae3f5ef48f787ff69
Date: 2020-10-02T17:54:06.165Z (4 days ago)
Electron: 9.2.1
Chrome: 83.0.4103.122
Node.js: 12.14.1
V8: 8.3.110.13-electron.0
OS: Darwin x64 19.6.0
 dsp1589
on 7 Oct 2020
dsp1589
on 7 Oct 2020
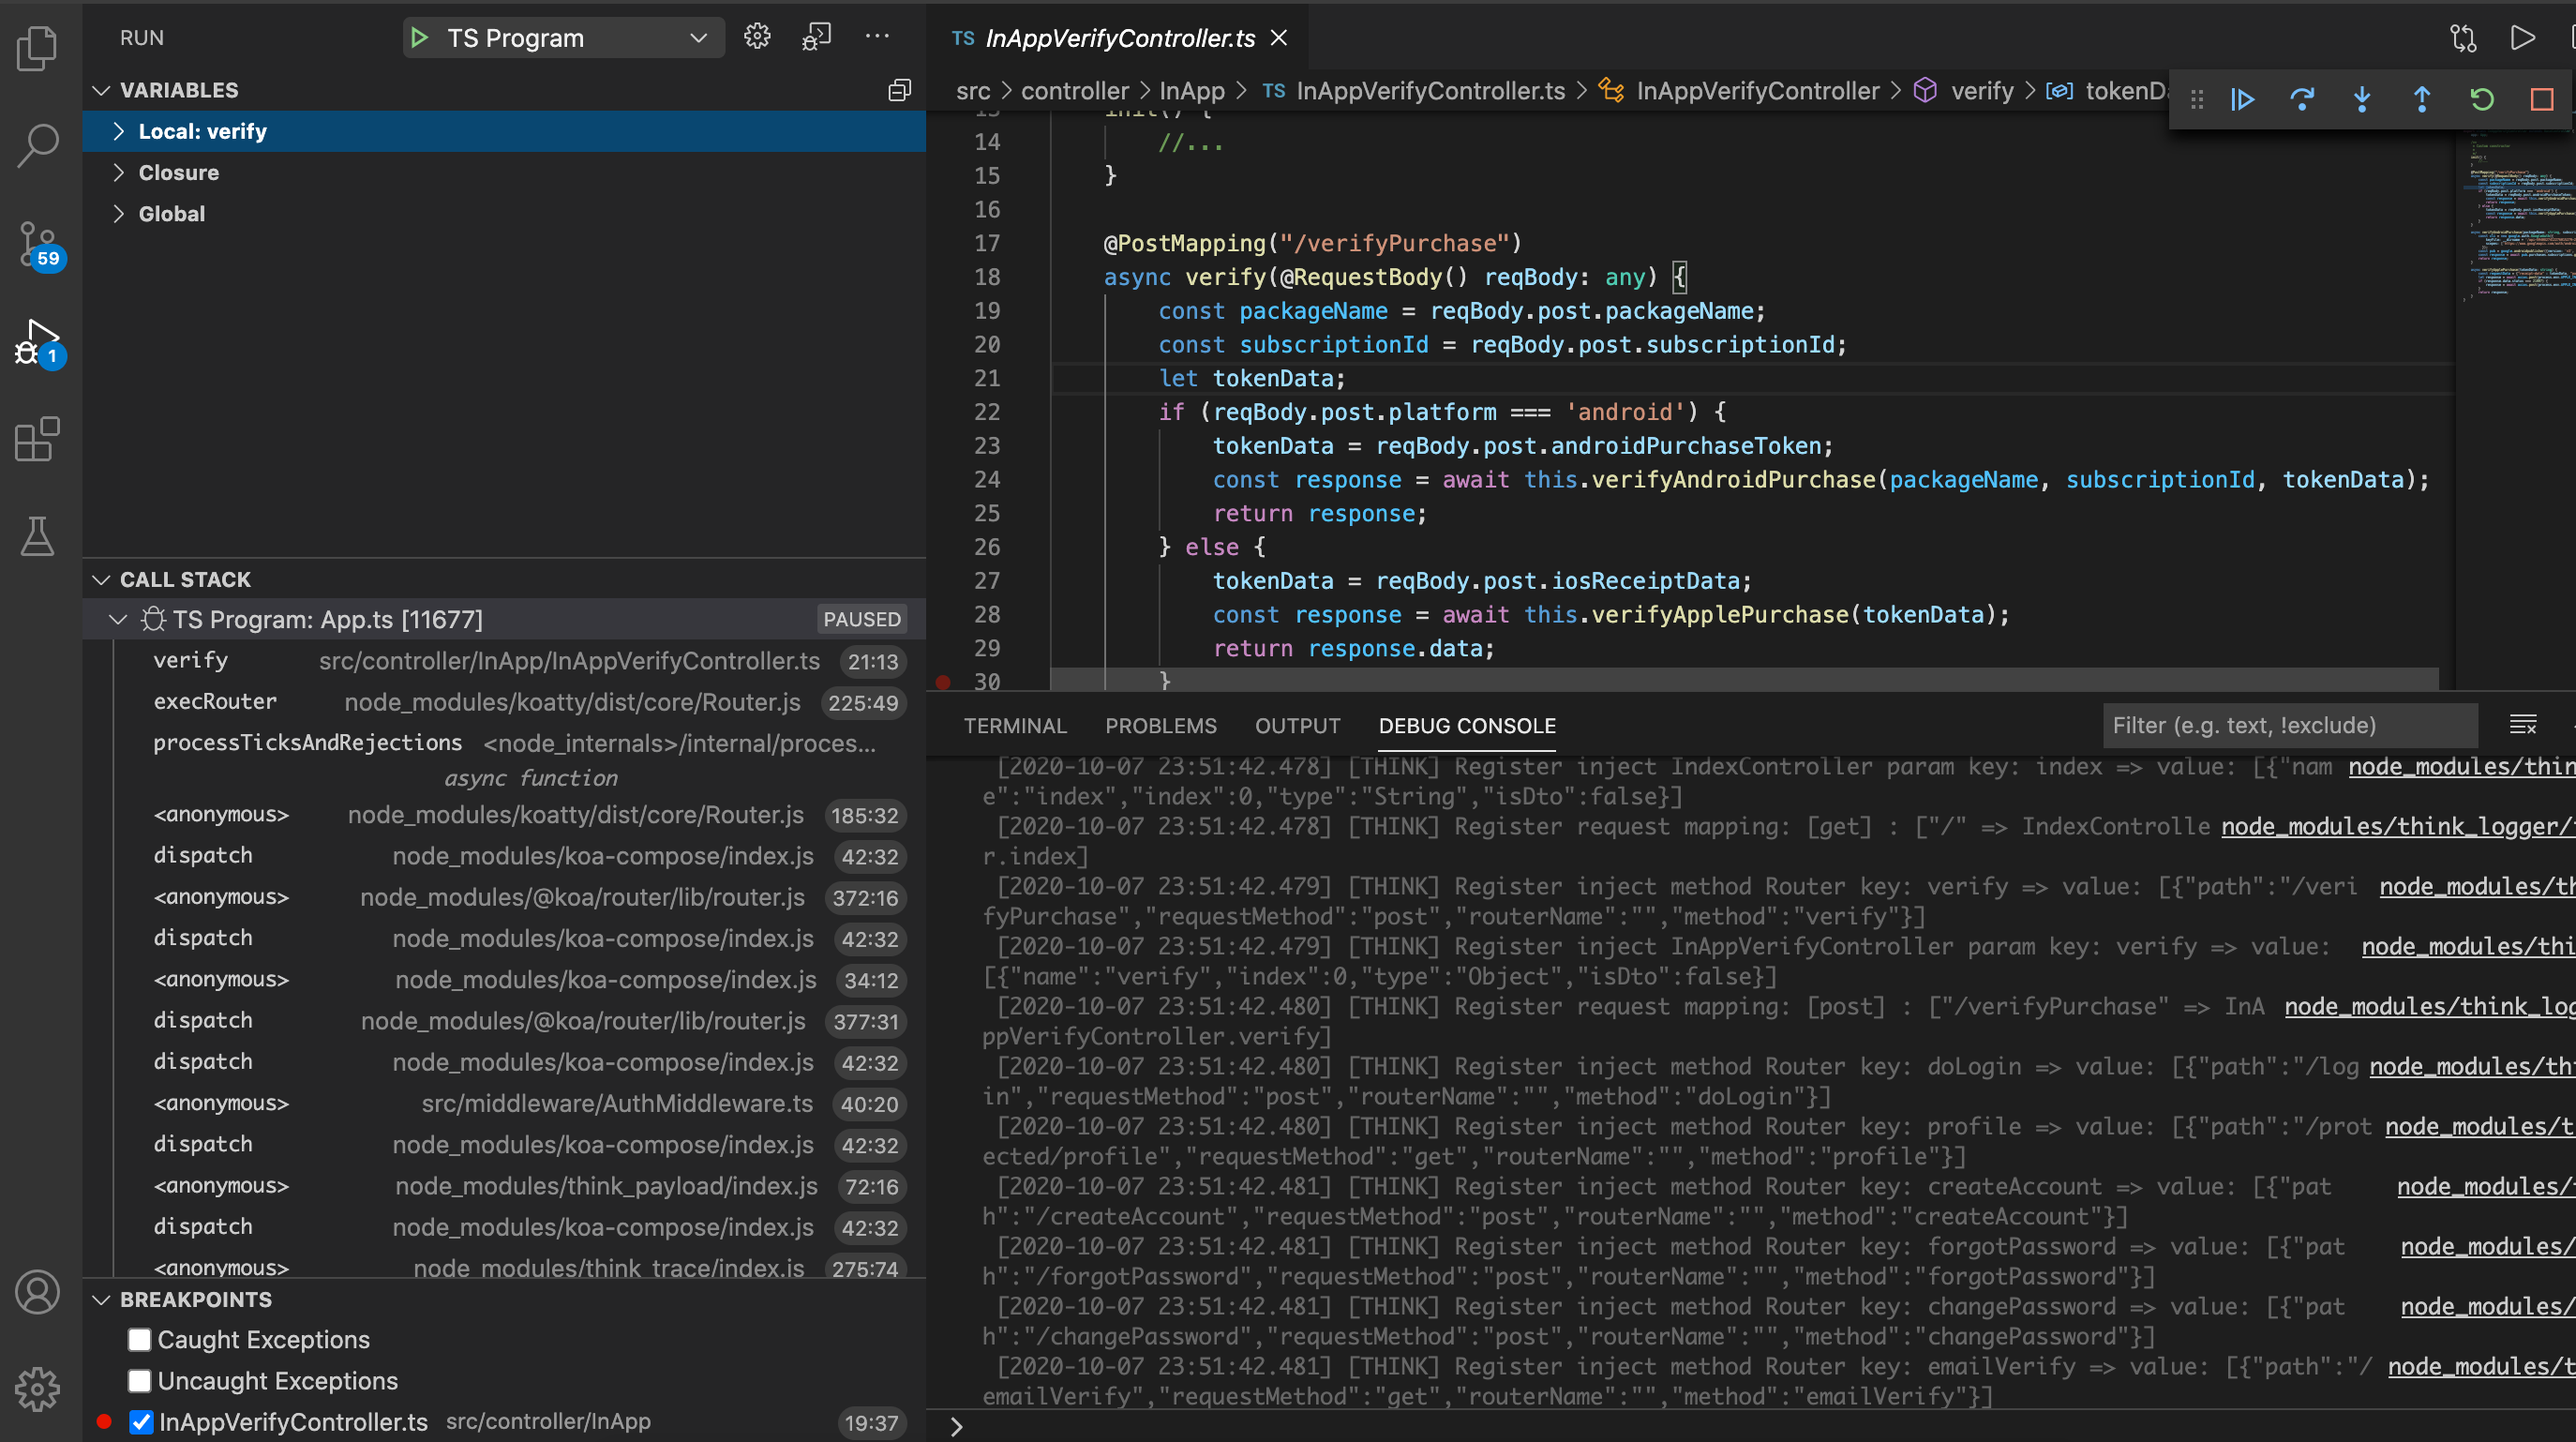
@dsp1589 you have a case sensitivity issue -- your breakpoint is set in (/the file you have open in VS Code is) InAppVerifycontroller, but the sourcemap that your app has is InAppVerifyController. This prevents the file path from matching up.
connor4312
on 7 Oct 2020
interesting, I deleted the file and recreated, the breakpoints are working. but the visual breakpoint(red dot) and highlighting(green) is not working.
dsp1589
on 7 Oct 2020
Please share logs again for that :)
connor4312
on 7 Oct 2020
@connor4312 [attached] I was able to make it work now. your other comment helped I believe. I deleted "dist" folder, toggled JS-debug use in-preview JS debugger off and on in settings, restarted vs code. The only issue I still see is "two break points" in breakpoints list in left bottom panel.

vscode-debugadapter-0.json.gz
vscode-debugadapter-1.json.gz
vscode-debugadapter-2.json.gz
dsp1589
on 7 Oct 2020
I deleted "dist" folder, toggled JS-debug use in-preview JS debugger off and on in settings, restarted vs code. The only issue I still see is "two break points" in breakpoints list in left bottom panel.
Ah, yea, that could be an issue. If we see you're trying to run a non-.js file and there's a compiled file present, we'll run the compiled version instead (this was a common stumbling block from beginners where they pointed their launch.json at their source rather than compiled files.) So in that case the file you though you were running and the actual file were different. You can fix this by setting outFiles: [] in your launch.json, so that we don't look for sourcemaps anywhere.
In this state it looks like you were able to set breakpoints at the same line in two files... you can fix this by right clicking and hitting "remove breaakpoint" on one of them.
connor4312
on 7 Oct 2020
@connor4312 I am having problems setting breakpoints. I have an src dir with TypeScript and a public dir. Snowpack is being used in Dev mode. There does not appear to be any sourcemaps generated. I am running Chromium, which seems to work without having to point to the executable:
  "version": "0.2.0",
  "configurations": [
    {
      "type": "pwa-chrome",
      "request": "launch",
      "runtimeExecutable": "custom",
      "name": "Launch Chrome against localhost",
      "url": "http://localhost:8080",
      "webRoot": "${workspaceFolder}"
    }
  ]
}
I can't click on any line in the .ts file without getting unbound breakpoint. Is this a bug? Are my settings wrong? Thanks!
 David-Else
on 12 Oct 2020
David-Else
on 12 Oct 2020
Please capture logs using the instructions I sent above!
connor4312
on 12 Oct 2020
Closing this as it seems like we've found a solution. Happy coding ⌨️
connor4312
on 22 Oct 2020
@connor4312 Im having same issue as @David-Else which is getting unbound breakpoint, it worked for me before, but it looks like when I upgraded chrome to version Version 86.0.4240.111 (Official Build) (x86_64) then I was not able to reach checkpoint anymore.

Here is my launch.json
"configurations": [
    {
      "name": "Chrome",
      "type": "chrome",
      "request": "launch",
      "url": "http://localhost:3000",
      "webRoot": "${workspaceRoot}/example/src",
      "userDataDir": "${workspaceRoot}/.vscode/chrome",
      "sourceMapPathOverrides": {
        "webpack:///src/*": "${webRoot}/*"
      },
      "trace": true
    }
  ]
My VSCode info
Version: 1.50.1
Commit: d2e414d9e4239a252d1ab117bd7067f125afd80a
Date: 2020-10-13T14:53:05.704Z
Electron: 9.2.1
Chrome: 83.0.4103.122
Node.js: 12.14.1
V8: 8.3.110.13-electron.0
OS: Darwin x64 19.6.0
And here is captured logs
vscode-debugadapter-5.json.gz
Thanks in advance
 kis25791
on 25 Oct 2020
kis25791
on 25 Oct 2020
You have a breakpoint in AnimationEditorV2.tsx, which is not loaded by your application (or if it is, there's no sourcemap referencing it).
connor4312
on 25 Oct 2020
Related issues
 geirsagberg
·
5Comments
geirsagberg
·
5Comments
 roblourens
·
5Comments
roblourens
·
5Comments
 mgabeler-lee-6rs
·
4Comments
mgabeler-lee-6rs
·
4Comments
 Agamennon
·
4Comments
Agamennon
·
4Comments
 eamodio
·
5Comments
eamodio
·
5Comments