Vscode-js-debug: Should be able to step through .js code when source fails to load
Describe the bug
If loading the source from the source map fails, it should be possible to step through the underlying .js code. Instead I'm given an unhelpful window that just says something like
Could not load source '/yadda/yadda/node_modules/yadda/foo.ts': Unable to retrieve source content.
To Reproduce
Steps to reproduce the behavior:
- Make an app/script that uses a package dependency, where that dependency has source maps, but no source code to go with them (e.g. no embedded source in the source map, and delete any corresponding .ts files from the installed dependency in node_modules)
- Set a breakpoint in your app on a call into that dependency
- Step into the call
- Desired: Have some way to see the
.jscode at least and step through it. Actual: Just get to see the error message and no code.
VS Code Version: 1.49.0
Additional context
I used to be able to work around this by turning off the "new" debugger, as the "old" one didn't have this problem. But with 1.49.0, it seems the legacy debugger is gone, or at least all the settings to choose it are gone AFAICT?
 mgabeler-lee-6rs
All 13 comments
The new debugger now lets you configure where sourcemaps are resolved via the resolveSourceMapLocations property. If unset, this defaults to the outFiles, which in turn excludes node_modules by default. If a file is not included in this configuration, we will discard its sourcemap and always step through the compiled code. The general assumption is that these properties are set to only include your own code, where sources are available.
 connor4312
on 11 Sep 2020
connor4312
on 11 Sep 2020
OK, but that then means that anything I have in node_modules that does have working source maps ... won't benefit from them.
What I desire/expect is for source maps to be used where they are present and the source can be loaded, but be able to see and step through the javascript code where they are either missing _or broken_, on a per-file basis. Having one dependency with broken source maps should not require me to throw the baby out with the bath water and ignore working source maps for all my other dependencies.
mgabeler-lee-6rs
on 11 Sep 2020
That's reasonable. Though you can also configure it more precisely, e.g.
"resolveSourceMapLocations": [
  "${workspaceFolder}/**",
  "!**/node_modules/**",
  "${workspaceFolder}/node_modules/my-dependency-with-sourcemaps",
],
or
"resolveSourceMapLocations": [
  "${workspaceFolder}/**",
  "!**/node_modules/my-dependency-with-broken-sourcemaps",
],
Currently we do filesystem checks after a source loads, but we don't check before loading a sourcemap source whether its content is available.
Code pointer in the event that you or others want to PR for this:
connor4312
on 11 Sep 2020
My dependency trees commonly have over 1500 packages, so ... that is not a reasonable way to do it, esp. if that's per launch config (of which I think I have hundreds across the dozens of repos I have in my workspace).
mgabeler-lee-6rs
on 12 Sep 2020
Thought about this a little more. I don't want to make the decision automatically to not load the sourcemapped script for two reasons:
- The "cannot load source" error is often useful to help diagnose where things in your build setup are going wrong. If you're off by a folder or missing an
src, looking at the path is a good way to see that without needing to dive into log files. Particularly versus an experience where you just know that your source isn't mapping and you have no idea why. - Basically what we want to do is not show the source if both the compiled file does not exist, and we cannot request source content for it. However, the source content could be on a network share or url, where requesting it is expensive -- more so than just a file existence check.
I think the best design would be doing the behavior we do today, but then at the same time showing a notification asking the user whether they want to debug in the compiled file instead ("Always" or "In this Workspace" would be two of the options). In that case, we will remove the sourcemapped file and refresh the stacktrace. In a way this would be similar to the pretty print experience.
Interested in hearing your thoughts on this @mgabeler-lee-6rs (and @artu-ole since you gave this issue your 👍 )
connor4312
on 19 Sep 2020
The outlined solution strikes me as a reasonable compromise between the two extremes. Extra click on such notification once does not make a difference in the long run and could make others consider the potential cost of the desicion at the same time.
However, shouldn't "This time only" be one of the options in this case for the cautious users not ready to make the commitment?
 artu-ole
on 19 Sep 2020
artu-ole
on 19 Sep 2020
Yea, the options would be No / Yes / Only in this Workspace / Always
connor4312
on 19 Sep 2020
@connor4312 Your proposed solution would solve my problem nicely :grinning:
mgabeler-lee-6rs
on 19 Sep 2020

You can try this out in the next nightly build
connor4312
on 21 Sep 2020
This works for a bit and I am able to step through the compiled version. Then I continue, hit the bp a second time, step into the missing file a second time, and it doesn't show that file
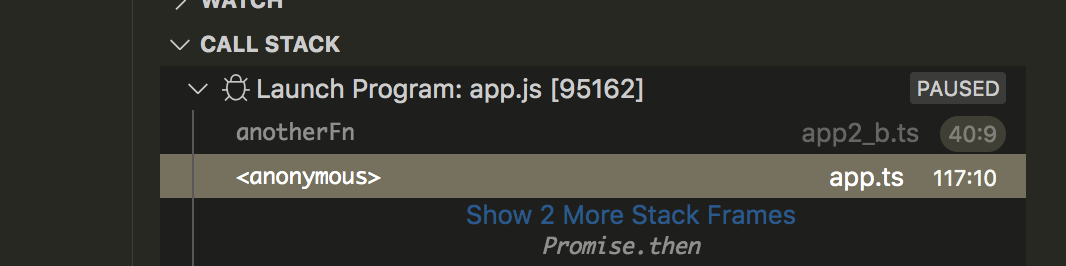
basically where app2_b.ts is the missing file, nothing happens when I click on the top stack frame, I only see the app.ts file.
 roblourens
on 30 Sep 2020
roblourens
on 30 Sep 2020
That's interesting. I think VS Code must remember that the first source request for the file failed, and not send it if it's hit again (so therefore the logic to refresh the stacktrace doesn't run). I knew that the disable would only work until you step back out of the file, but didn't know that this behavior would make it _only_ work that one time.
I'll just have js-debug remember ignored maps for the duration of the session.
connor4312
on 30 Sep 2020
Please verify in the next nightly build. I'll do a final bump for release tomorrow pending any other issues that come in.
connor4312
on 1 Oct 2020
Unclear to me how to verify, I suggest @roblourens verifies this today.
 bpasero
on 2 Oct 2020
bpasero
on 2 Oct 2020
Related issues
 FicoPrieto
·
4Comments
FicoPrieto
·
4Comments
 geirsagberg
·
5Comments
geirsagberg
·
5Comments
 auchenberg
·
3Comments
auchenberg
·
3Comments
 jtsom
·
8Comments
connor4312
·
4Comments
jtsom
·
8Comments
connor4312
·
4Comments
Most helpful comment
You can try this out in the next nightly build