Vscode-js-debug: [Feature request] Add inspectUri argument to Node debugger
Hey guys, React Native Tools team here. During migration of the extension on js-debug we found out that Node debugging scenarios doesn't support inspectUri argument for discovering debugging target websocket via debugging proxy as browser scenarios does. Is it possible to add such an argument for Node scenarios?
 SounD120
All 9 comments
Node debugging hooks up differently than Chrome, so it's not a super trivial change--there's no existing pathway where we go out and make a websocket connection to a debug target in Node. Are you trying to do something that doesn't work with the inspectUri shim present in the Chrome configs?
 connor4312
on 21 Feb 2020
connor4312
on 21 Feb 2020
@connor4312 In React Native extension there is a special debugger worker process that communicates with the application JS bridge. The whole debugging workflow is tied to this pure Node process. And since our debugging case in React Native extension is about debugging Node, I think Chrome debugging scenarios will not work for it.
Upd: you can find more information about current RNT debugger architecture here, maybe it will be useful
SounD120
on 25 Feb 2020
@connor4312, we tried to add a support of inspectUri parameter to Node Attach scenario (for now it's just a PoC). inspectUri parameter was added to Node Attach scenario configuration and handled almost the same way as for Chrome cases. The parameter was passed to watchDog process for establishing a connection with CDP proxy over Node debugger. With this configuration we can debug React Native applications, but it turned out that for some reasons breakpoints processing time increased. Now it takes a second or even longer to handle a breakpoint. Is this an expected behavior? Do you know what could cause this?
Also, we saw an update in vscode-cdp-proxy, and it seems to be very useful for us. Could you please publish a new version of that package so we could add it to the extension as a dependency? Thanks.
 RedMickey
on 2 Mar 2020
RedMickey
on 2 Mar 2020
Have you tried this with a "chrome" type config using inspectUri? Even though you are actually attaching to a Node process, since we are just attaching to some websocket using CDP, it shouldn't matter.
Do you need to attach to any child processes that are spawned by the Node process? I don't think so, you are just debugging the one process, right?
 roblourens
on 4 Mar 2020
roblourens
on 4 Mar 2020
Yes, we need to debug only one debuggerWorker Node process.
We tried to use Chrome attach scenario and found out the following:
- It seems that for now js-debug extension uses
inspectUriparameter only inLaunchscenario. But we'd like to use Chrome attach scenario to establish connection with a Node process over CDP proxy. So for now it doesn't work for us without modifications on the extension side. - We also tried to use Chrome attach scenario without
inspectUriparameter, but it didn't work. The connection todebuggerWorkerwas established successfully (acquireConnectionForBrowser method), but then the extension tried to get a page target using flat session API (e.g. BrowserTargetManager.connect and Target.attachToBrowserTarget methods). After that an unknown exception was thrown:
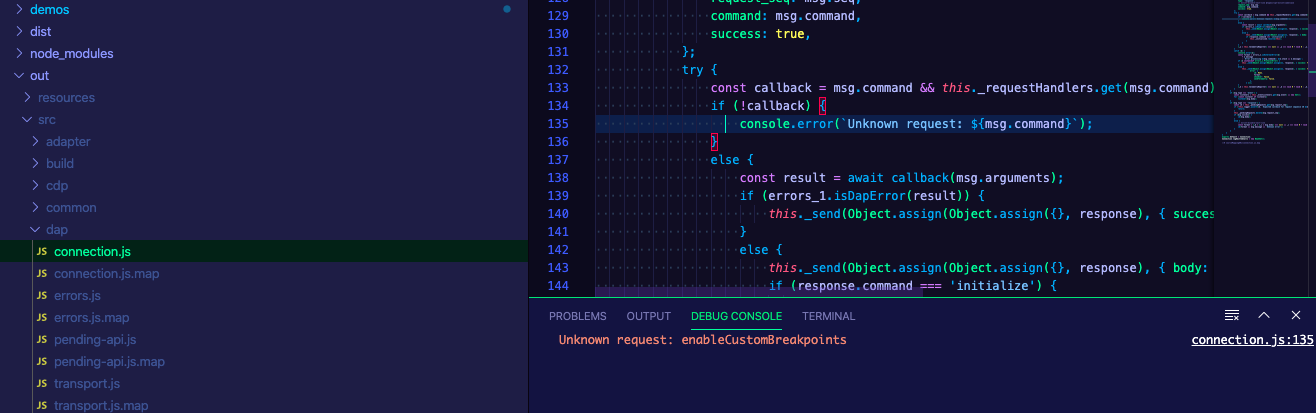
It can be caused due toattachToBrowserTargetmethod returnedundefinedresult.
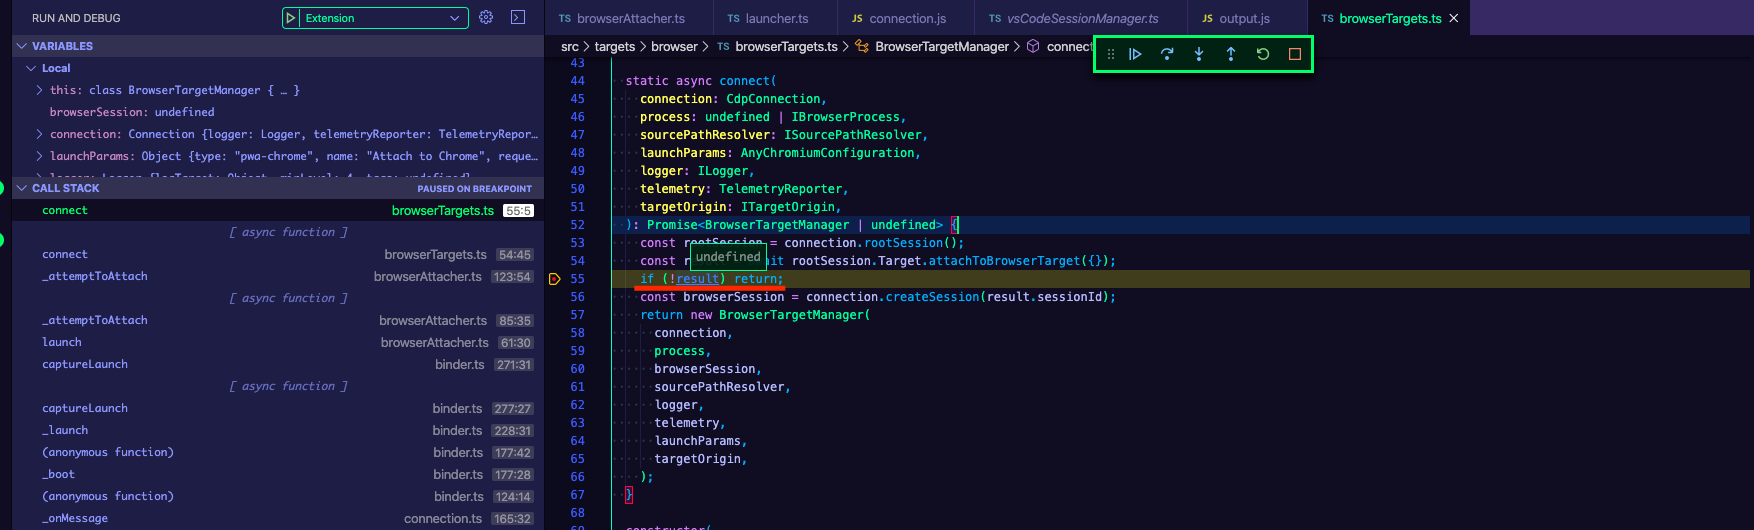
It seems that Node processes don’t support CDP Target API. - When we added
inspectUriparameter support to Chrome attach scenario, we were able to attach to CDP proxy and log requests. The CDP proxy successfully attached to debuggerWorker too. So we got the following output:

This confirmed our assumption that Node processes don't support CDP Target API (flat session API). - We also collected logs while using Node attacher. They could be helpful, so I'll attach the logFile.txt containing logs of two debug sessions. As seen from the logs Node process uses CDP Debug API.
Thus for now it seems that Chrome attach scenario doesn't suit to debug React Native applications with the React Native Tools current architecture.
RedMickey
on 6 Mar 2020
we tried to add a support of inspectUri parameter to Node Attach scenario (for now it's just a PoC). inspectUri parameter was added to Node Attach scenario configuration and handled almost the same way as for Chrome cases.
I'm not totally sure I see why you need to do that versus using the existing port and/or host that's available on the node attach configuration? That's seems like the way to do things for this scenario as far as I can see.
With this configuration we can debug React Native applications, but it turned out that for some reasons breakpoints processing time increased. Now it takes a second or even longer to handle a breakpoint
If you have a sample where I could try this out that'd be awesome. Alternately you can take an extension host profile on your machine.
Could you please publish a new version of that package so we could add it to the extension as a dependency?
Done :)
connor4312
on 10 Mar 2020
@connor4312, thanks for publishing of vscode-cdp-proxy package. It may be that I'm missing something, but I don't see the way to use port and/or host parameters to pass ws address (inspectorURL) of debuggerWorker to CDP proxy to connect to it then. We'll be able to connect to CDP Proxy this way, but we'll need to do inspector websocket lookup for debugging target from the proxy side. From our understanding inspectUri should resolve such a problem.
I prepared small demo for testing React Native Tools based on CDP Proxy and modified Node attacher so you can try to debug an RN application using the following instruction:
- Download and install from
vsixpatchedjs-debugextension - js-debug.vsix.zip. The patch is related to https://github.com/RedMickey/vscode-js-debug/pull/1/commits/bd0fb1fe671907212a393f9312c01dbfdc720993 commit. - Download and install from `vsix React Native extension - vscode-react-native-0.14.1.vsix.zip. The build commit is https://github.com/microsoft/vscode-react-native/commit/edf772c2ba727cb69fb5de45df1acb5f94ed211e.
- Configure your environment according to React Native guide
- Clone the RN demo project
git clone https://github.com/RedMickey/rn-demo-button.git && cd rn-demo-button && yarn install - Open the project in VS Code, then open
AppTestButton.jsfile and set a breakpoint on the line 10 - Run
Debug Androiddebug scenario - Enable remote debugging on an emulator by calling Dev Menu and clicking
Debugbutton
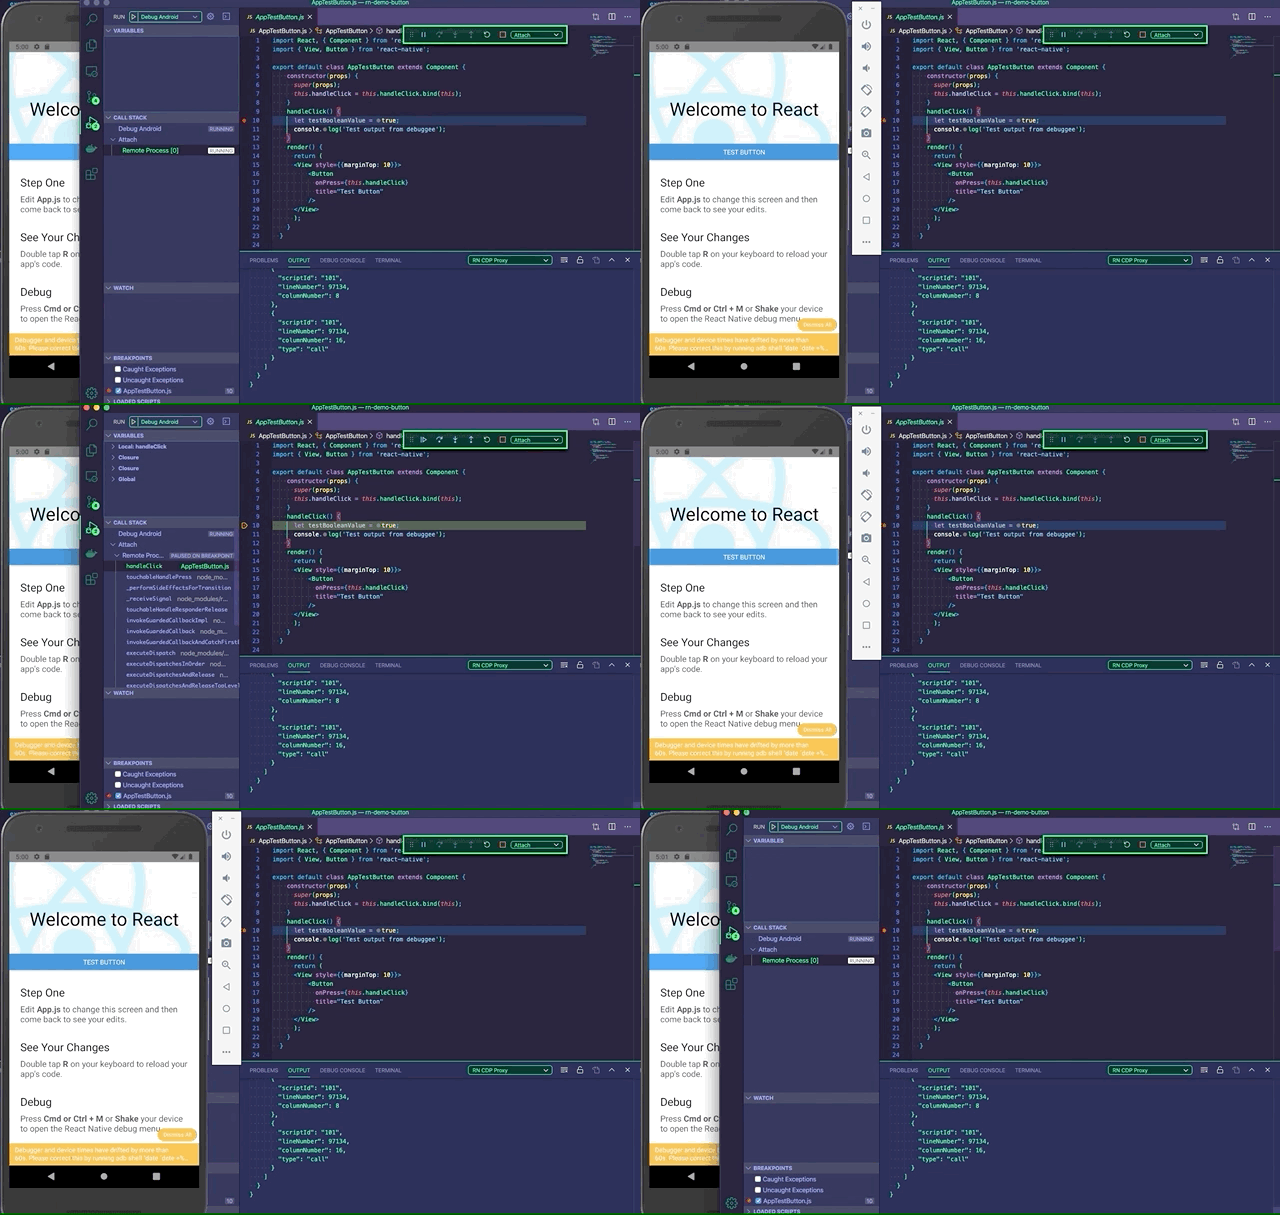
I attach a GIF to demonstrate a delay of breakpoints processing. The time of processing could be a bit longer than real due to screen recording.
RedMickey
on 11 Mar 2020
In the Node attach case, you're attaching to a process that is already started.
we'll need to do inspector websocket lookup for debugging target from the proxy side
I think this is the correct thing for you to do. The inspectUri is useful in the Chrome launch case because there's a lot of browser launching behavior that js-debug implements that would be impractical to reimplement in a the proxy. But if you already have a process running, it should be fairly trivial to do the websocket lookup there.
connor4312
on 18 Mar 2020
Thanks for clarification, it seems that implementation of inspectUri parameter won't make much sense for the extension in this case. So we are going to implement inspector socket lookup on RN extension side ourselves.
RedMickey
on 19 Mar 2020
Related issues
 Skuriles
·
5Comments
Skuriles
·
5Comments
 mgabeler-lee-6rs
·
4Comments
mgabeler-lee-6rs
·
4Comments
 michaelhyman
·
5Comments
michaelhyman
·
5Comments
 byroniac
·
6Comments
byroniac
·
6Comments
 Agamennon
·
4Comments
Agamennon
·
4Comments
Most helpful comment
Thanks for clarification, it seems that implementation of
inspectUriparameter won't make much sense for the extension in this case. So we are going to implement inspector socket lookup on RN extension side ourselves.