Vscode-js-debug: Not able to hit the breakpoints set on TS files which are present inside the node_modules folder
VSCode Version: Version: 1.40.2 (user setup)
OS Version: Win10 Enterprise x64 1903
Steps to Reproduce:
Have node_modules JS sources with mapping to TS sources present inside the node_modules folder.
Apply breakpoints in the TS file present inside node_modules folder
Breakpoints are NOT properly applied as the VSCode informs that the breakpoints are not bound.
Try to execute the code path which should hit the breakpoints
None of the breakpoints is hit
Does this issue occur when all extensions are disabled?: Yes
Note: After enabling the 'trace' option, I can see that the files are properly mapped and so does the breakpoints. Also, if I use the Chrome Debugger the breakpoints get properly hit.
Attached is the trace log file.
vscode-debugadapter.zip
This is related to https://github.com/microsoft/vscode/issues/86363
 mahtogaurav
All 34 comments
@roblourens Please find the attached log files.
mahtogaurav
on 12 Dec 2019
There were a few things we needed to tweak to allow this. I put in a PR which, once merged, should appear on the next daily build (8 AM PST). https://github.com/microsoft/vscode-js-debug/pull/172
To use this, you'll just need to tell the debug adapter that it's OK to match against source files in your node modules by adding this to your launch.json:
"resolveSourceMapLocations": ["**/*"]
(By default, this is disabled since source maps in node modules have the potential to conflict with your actual source files, depending on how they're built)
 connor4312
on 12 Dec 2019
connor4312
on 12 Dec 2019
@connor4312 I'll give it a try once the new build is available.
Also, "resolveSourceMapLocations": ["**/*"] must be added into the launch configuration? Like below?
{
  "name": "Attach to backend local",
  "type": "node",
  "request": "attach",
   "skipFiles": [
     "node_internals/**"
   ],
   "resolveSourceMapLocations": ["**/*"]
}
mahtogaurav
on 13 Dec 2019
Yep, that's right.
connor4312
on 13 Dec 2019
@connor4312 I tried the latest build but now I'm NOT even to hit the applied breakpoints in files outside the node_modules as well as inside the node_modues folder? Sometimes, I see 'unbound breakpoints' message when I try to apply the breakpoints and sometimes not.
I did add the "resolveSourceMapLocations": ["**/*"] configuration.
mahtogaurav
on 14 Dec 2019
The next build won't run until 8 AM PST today (another two hours). Please give that a spin, and if things still don't work for you then another drop of the trace logs would be much appreciated! 🙂
connor4312
on 14 Dec 2019
@connor4312 Didn't get the new build. The current build that I have is b18243. Is that the latest?
mahtogaurav
on 14 Dec 2019
It should be published now, apologies for the delay, the default CI schedule excluded weekends.
connor4312
on 14 Dec 2019
@connor4312 I grabbed the latest build but I'm still NOT able to hit the breakpoints. Now, I'm not even able to hit the breakpoints for files outside of the 'node_modules' folder. Also, after some time the VSCode crashes.
When I try to apply the breakpoints I do get 'unbound breakpoints' message in VSCode but when I remove and reapply the breakpoints, sometimes, the message disappears and the red dot glows
vscode-debugadapter.zip
.
Please find the attached log file.
mahtogaurav
on 15 Dec 2019
As part of of this debug adapter, we scan folders where breakpoints are set to discover sourcemaps, and wait until that finishes before going ahead with setting breakpoints. What I'm seeing in your logs is continuing source map parsing events even +4 minutes in, which makes me wonder if it's hanging up on some very large folders somewhere along the line.
I've added some additional logging in https://github.com/microsoft/vscode-js-debug/commit/1533f120ef167f827d1ee581cadab44c81a6cdeb that will confirm this if it's the issue, and triggered a new build of the extension. If you could update your extension then try again and upload logs, that would be super helpful.
connor4312
on 15 Dec 2019
Got the latest build and tried the above scenario. Please find the attached log.
From the logs, it looks like that your suspicion is true about the large folder.
vscode-debugadapter.zip
mahtogaurav
on 16 Dec 2019
Okay, thanks. The predictor has been a bit of a thorn. For your scenario, would letting you configure the paths in which it searches for sourcemaps fix your problem? (Along with https://github.com/microsoft/vscode-js-debug/issues/164) Like outFiles in the existing adapters. Right now it searches recursively, excluding only node_modules, in any folder where a file has a breakpoint set.
connor4312
on 16 Dec 2019
I tried using the latest build and tried limiting the search paths by providing a more restricted path. I'm still NOT able to hit the breakpoints for both files outside as well as inside the 'node_modules' folder.
Here is the config that I used:
    {
            "name": "Attach to backend local",
            "type": "pwa-node",
            "request": "attach",
            "port": 9229,
            "skipFiles": [
                "node_internals/**"
            ],
            "resolveSourceMapLocations": [
                "${workspaceFolder}\\dev-data\\**\\*",
                "${workspaceFolder}\\src\\**\\*",
                "${workspaceFolder}\\node_modules\\**\\*",
                "${workspaceFolder}\\node_modules\\@company\\**\\*",
                "!${workspaceFolder}\\node_modules\\@company\\**\\node_modules\\**\\*",
                "!${workspaceFolder}\\node_modules\\**\\*",
                "!${workspaceFolder}"
            ],
            "outFiles": [
                "${workspaceFolder}\\dev-data\\**\\*",
                "${workspaceFolder}\\src\\**\\*",
                "${workspaceFolder}\\node_modules\\**\\*",
                "${workspaceFolder}\\node_modules\\@company\\**\\*",
                "!${workspaceFolder}\\node_modules\\@company\\**\\node_modules\\**\\*",
                "!${workspaceFolder}\\node_modules\\**\\*",
                "!${workspaceFolder}"
            ],
            "trace": true
   }
Also attached is the log files.
vscode-debugadapter.zip
mahtogaurav
on 17 Dec 2019
I just now merged the PR, it'll be in tomorrow's build!
Reopening this until we can confirm it works (marking as info needed until then).
connor4312
on 17 Dec 2019
Okay .. will grab it once the latest build is available. Will check tomorrow.
mahtogaurav
on 18 Dec 2019
@connor4312 I grabbed the latest and I'm still NOT able to hit the breakpoints. I do see the new notification which informs to update "outFiles" configuration.
I tried the following configurations:
{
"resolveSourceMapLocations": [
                "${workspaceFolder}\\dev-data\\**\\*",
                "${workspaceFolder}\\src\\**\\*",
                "${workspaceFolder}\\node_modules\\**\\*",
                "${workspaceFolder}\\node_modules\\@company\\**\\*",
                "!${workspaceFolder}\\node_modules\\@company\\**\\node_modules\\**\\*",
                "!${workspaceFolder}\\node_modules\\**\\*",
                "!${workspaceFolder}"
            ],
            "outFiles": [
                "${workspaceFolder}\\dev-data\\**\\*",
                "${workspaceFolder}\\src\\**\\*",
                "${workspaceFolder}\\node_modules\\**\\*",
                "${workspaceFolder}\\node_modules\\@company\\**\\*",
                "!${workspaceFolder}\\node_modules\\@company\\**\\node_modules\\**\\*",
                "!${workspaceFolder}\\node_modules\\**\\*",
                "!${workspaceFolder}"
            ]
}
and
{
"resolveSourceMapLocations": [
                "${workspaceFolder}\\dev-data\\**\\*.js",
                "${workspaceFolder}\\node_modules\\@company\\**\\*.js"
            ]
            "outFiles": [
                "${workspaceFolder}\\dev-data\\**\\*.js",
                "${workspaceFolder}\\node_modules\\@company\\**\\*.js",
                "!${workspaceFolder}\\node_modules\\@company\\**\\node_modules\\**\\*",
                "!${workspaceFolder}\\node_modules\\**\\*"
            ],
}
Attached is the log file.
vscode-debugadapter.zip
mahtogaurav
on 19 Dec 2019
I see in your config you exclude node_modules after adding them. This will negate the previous inclusions.
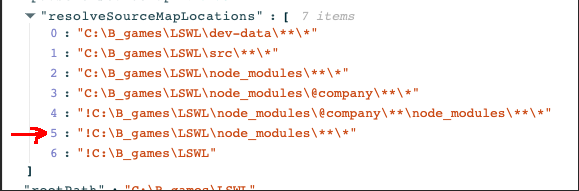
The globs are executed in order by glob-stream, here's what they have to say about negative globs:
Globbing & Negation
var stream = gs(['./**/*.js', '!./node_modules/**/*']);Globs are executed in order, so negations should follow positive globs. For example:
The following would __not__ exclude any files:
gs(['!b*.js', '*.js'])However, this would exclude all files that started with
b:gs(['*.js', '!b*.js'])
The algorithm is roughly:
def is_match(file, globs):
  matches = False
  for glob in globs:
    if is_negative(glob):
      matches = matches and not is_match(file, glob)
    else:
      matches = matches or is_match(file glob)

  return matches
Note: the last glob you have is also a negation, but because it doesn't have any wildcards * it'll only match a file named exactly C:\B_games\LSWL, so it doesn't have any effect for you.
connor4312
on 19 Dec 2019
@connor4312 I see. Now, I've tested with the below config. Still, I'm NOT able to hit the breakpoints both outside and inside the 'node_modules' folder. Also, I do see the long predictor notification.
"resolveSourceMapLocations": [
                "${workspaceFolder}\\dev-data\\**\\*",
                "${workspaceFolder}\\node_modules\\@company\\**\\*",
                "!${workspaceFolder}\\node_modules\\@company\\**\\node_modules\\**\\*"
            ],
            "outFiles": [
                "${workspaceFolder}\\dev-data\\**\\*",
                "${workspaceFolder}\\node_modules\\@company\\**\\*",
                "!${workspaceFolder}\\node_modules\\@company\\**\\node_modules\\**\\*"
            ],
Please find the attached log file.
vscode-debugadapter.zip
mahtogaurav
on 20 Dec 2019
Also, I've tested this one:
"resolveSourceMapLocations": [
                "${workspaceFolder}\\dev-data\\**\\*",
                "${workspaceFolder}\\src\\**\\*",
                "${workspaceFolder}\\node_modules\\**\\*",
                "${workspaceFolder}\\node_modules\\@company\\**\\*",
                "!${workspaceFolder}\\node_modules\\@company\\**\\node_modules\\**\\*"
            ],
            "outFiles": [
                "${workspaceFolder}\\dev-data\\**\\*",
                "${workspaceFolder}\\src\\**\\*",
                "${workspaceFolder}\\node_modules\\**\\*",
                "${workspaceFolder}\\node_modules\\@company\\**\\*",
                "!${workspaceFolder}\\node_modules\\@company\\**\\node_modules\\**\\*"
            ],
@connor4312 I see. Now, I've tested with the below config. Still, I'm NOT able to hit the breakpoints both outside and inside the 'node_modules' folder. Also, I do see the long predictor notification.
"resolveSourceMapLocations": [
                "${workspaceFolder}\\dev-data\\**\\*",
                "${workspaceFolder}\\node_modules\\@company\\**\\*",
                "!${workspaceFolder}\\node_modules\\@company\\**\\node_modules\\**\\*"
            ],
            "outFiles": [
                "${workspaceFolder}\\dev-data\\**\\*",
                "${workspaceFolder}\\node_modules\\@company\\**\\*",
                "!${workspaceFolder}\\node_modules\\@company\\**\\node_modules\\**\\*"
            ],
Please find the attached log file.
vscode-debugadapter.zip
@connor4312 Did you get a chance to look into the latest log files?
mahtogaurav
on 31 Dec 2019
I was out on winter vacation, I only just looked at your log file.
One interesting thing that I noticed is we're resolving some of your sources at the wrong path. It looks like these are coming from your webpack sources, with which we should normalize to your platform path (based on the cwd), but for some reason that isn't happening in your code and I'm having difficultly trying to get a similar reproduction to happen on my Windows machine. Because the paths are different, breakpoints set in the files won't get hit.
{
  "seq": 1065,
  "type": "event",
  "event": "loadedSource",
  "body": {
    "reason": "new",
    "source": {
      "name": "game-server.ts",
      "path": "/src/backend/game-server.ts", // <- this should be c:\games\LS_WA\src\backend\game-server.ts
      "sourceReference": 1056
    }
  }
}
I've added some additional logging in 75536db, which should be published in the usual 8 AM build.
If you're available at some point, hopping on a call/screenshare would be helpfil. ~20-30 minutes to debug on your machine would speed things up over probing around with logs 🙂
connor4312
on 3 Jan 2020
@connor4312 I've attached the latest log from after grabbing the latest. PFA log file.
vscode-debugadapter.zip
Let me know and we can set up a good time to schedule a call/screen-share.
mahtogaurav
on 6 Jan 2020
Okay, great! How about 8 PM PST today? That should be tomorrow morning for you, going off your Github profile location.
Can you shoot me an email so I can send a meeting invite? My address is [email protected]
connor4312
on 6 Jan 2020
It would be 9:30 AM IST ... same day .. my time. I already have a meeting schedule so, could we schedule it for Wednesday, 8th, 8 AM PST?
Mine email address is gaurav.[email protected]
mahtogaurav
on 6 Jan 2020
That works for me.
connor4312
on 6 Jan 2020
@connor4312
Hi ... One weird thing I noticed today was that if I remove the 'resolveSourceMapLocations' and 'outFiles' configurations and set the 'type': 'node' instead of 'type': 'pwa-node' in the launch.json config file along with VSCode setting "debug.node.useV3": true ... the debugging started working fine for me. The other weird thing I noticed is that if I remove the set breakpoints ... VSCode was still hitting them. Also, looks like that the logging also adds some significant delay.
Please find the attached log file.
vscode-debugadapter.zip
Should we cancel the meeting? Or it is still required?
mahtogaurav
on 8 Jan 2020
That's interesting, I'll take a look at the logs.
Yesterday I found one bug in some handling that might seems to have the same symptoms of the problem you had, in your last logs. Can you try the latest nightly build and see if it works for you with your previous configuration? If so we're good to cancel the meeting.
connor4312
on 8 Jan 2020
@connor4312 Ok, let me try with the latest nightly. Is the latest nightly available?
mahtogaurav
on 8 Jan 2020
yep, it's built now
connor4312
on 8 Jan 2020
@connor4312 I tried the latest build but still the same problem. Do you want to connect?
mahtogaurav
on 8 Jan 2020
Let's skip for now. I'll take a look at your mode recent logs, thanks for providing them, that should help narrow it down.
connor4312
on 8 Jan 2020
Let's skip for now. I'll take a look at your mode recent logs, thanks for providing them, that should help narrow it down.
Let me know if you need more info or logs.
mahtogaurav
on 8 Jan 2020
Hi @connor4312,
Started to get the same problem when using the latest built-in debugger.
Also, I see that a similar issue is reported here.
I've followed the steps you mentioned here. I guess we can close this one. Also, if you want, I can share the logs at [email protected].
Using the nightly build, I'm able to hit the breakpoints.
mahtogaurav
on 31 Jul 2020
Okay, thanks for confirming that the nightly works for you. This will be updated in the upcoming VS Code stable release set for next week.
connor4312
on 3 Aug 2020
Related issues
 mgabeler-lee-6rs
·
4Comments
mgabeler-lee-6rs
·
4Comments
 geirsagberg
·
5Comments
geirsagberg
·
5Comments
 jaadh
·
3Comments
jaadh
·
3Comments
 roblourens
·
7Comments
roblourens
·
7Comments
 isidorn
·
6Comments
isidorn
·
6Comments