Vscode-jest: Debug Jest with current test file doesn't stop at correct breakpoint in VSCode
_From @trivikr on August 30, 2018 6:48_
🐛 Bug Report
Debug Jest with current test file doesn't stop at correct breakpoint in VSCode
To Reproduce
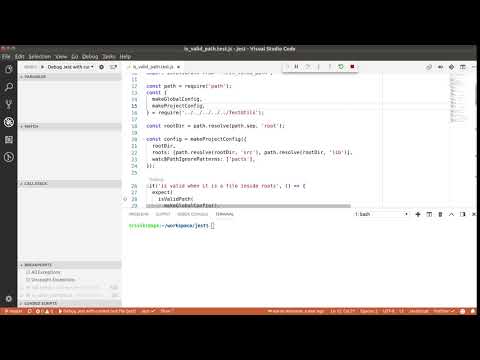
- Open Jest source code in VSCode (tested in VSCode 1.26.1 on Ubuntu 18.04.1)
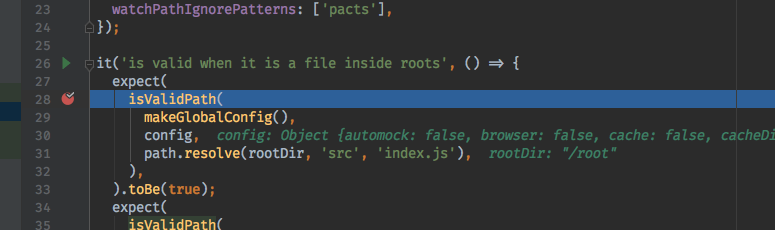
- Open any test file (tested with putting breakpoint at on line 28 of is_valid_path.test.js)
- Go to debug mode in VSCode, and click "Debug Jest with current test file"
- Notice that debugger stops at line 22 instead
Screen Recording
Expected behavior
Debugger stops at Line 28
_Copied from original issue: facebook/jest#6918_
 trivikr
All 8 comments
_From @SimenB on August 30, 2018 10:22_
This works in Chrome and IntelliJ, so it's an issue with vs code, not Jest (maybe https://github.com/jest-community/vscode-jest?).

trivikr
on 30 Aug 2018
Having the exact same issue. Works with Chrome, but not VScode
 ahanriat
on 3 Sep 2018
ahanriat
on 3 Sep 2018
jest uses flow, and vscode uses sourcemaps to debug these transpiled codes. There are a few suggestions on how to debug flow in vscode, such as here.
But for your use case, I found a simple line in .babelrc worked just fine without the full sourcemaps support:
"retainLines": true
 connectdotz
on 4 Sep 2018
connectdotz
on 4 Sep 2018
I fixed it by setting "sourceMaps": false, in launch.json
 Morikko
on 13 Sep 2018
Morikko
on 13 Sep 2018
Thank you @connectdotz, I've posted fix in Jest repo at https://github.com/facebook/jest/pull/6985
Thank you @Morikko for sharing another option. I tried it, but it didn't work in some situations (like with file notify-reporter.test.js)
trivikr
on 16 Sep 2018
The fix was merged in https://github.com/facebook/jest/commit/68eb9a232dcbd4ecf85bb1f0bdad5cb850dff81a
trivikr
on 25 Sep 2018
Yes, I also had trouble with the previous solution. Breakpoints were in the right place but actually executing code at another place.
I added "runtimeArgs": ["-r", "flow-remove-types/register"], to my project configuration (launch.json) but it still doesn't work. My project is not using flow but standard javascript.
I am calling jest from ./node_modules/jest/bin/jest.js.
Did you do other things ?
Morikko
on 26 Sep 2018
This issue was raised in Jest's code base, and it was fixed with adding "runtimeArgs": ["-r", "flow-remove-types/register"] in launch.json in commit https://github.com/facebook/jest/commit/68eb9a232dcbd4ecf85bb1f0bdad5cb850dff81a
trivikr
on 26 Sep 2018
Related issues
 DaniGTA
·
3Comments
DaniGTA
·
3Comments
 FDiskas
·
3Comments
FDiskas
·
3Comments
 distante
·
3Comments
distante
·
3Comments
 offero
·
4Comments
offero
·
4Comments
 orta
·
5Comments
orta
·
5Comments
Most helpful comment
I fixed it by setting
"sourceMaps": false,inlaunch.json