Vscode-cpptools: cpptools sometimes isn't terminated on VS Code shutdown and maintains a database lock, breaking functionality
Type: LanguageService
Describe the bug
- OS and Version: WIndows 10 1809
- VS Code Version: 1.44.1
- C/C++ Extension Version: 0.27.0 (but this issue isn't new)
- Only Remote extensions enabled for Workspace
- Using Remote WSL
Sometimes, the IntelliSense engine can get stuck in a mode where it is impossible to Go To Definition for any symbol in any source file, despite using a compile_commands.json file that "perfectly" sets up the compiler. There are no red squigglies, every symbol gets a correct description on hover, symbols have documentation when available, and completion works perfectly. Despite all this, finding the location in the source for _any_ symbol is impossible.
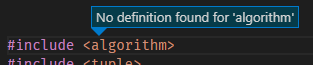
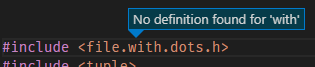
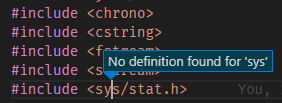
This also applies to opening header files with Go To Definition - I still get the "No definition found for '_file_'" message, where _file_ is the part of the filename where the cursor is. For instance, if the header file is named my.header.h and the cursor is in the word "header", the full error message will be "No definition found for 'header'". The error message comes immediately, and there is no attempt to scan for the header file.
Sometimes, resetting the IntelliSense database, rescanning the Workspace and restarting VS Code works, but other times not. I don't know of a way to reproduce this, sorry, but since navigating the source code is one of the great features of a language service, I'm willing to create an issue with such weak reproduction steps.
I wanted to capture some more screenshots of this happening, when the language service instead switched to the "Initializing..." mode where _nothing_ works, including completions etc. (Restarts etc. don't help.) Unfortunately, these kinds of experiences are very typical, and I have found no simple way of resetting everything to get back to a working state.
Expected behavior
Go To Definition should always work if the language service has correctly figured out a symbol. It should always be possible to open a header file, even if it involves scanning the workspace (which doesn't happen in this mode). Finally, the language service shouldn't get stuck in the "Initializing..." mode without explanation or signs of anything making any progress after doing a couple of failed attempts to go to a definition.
A typical log on Debug level can look like this: When I'm in the "Initializing..." mode, just minutes later, logs look like this (notice "IntelliSense client not available"): There is no considerable process activity.
Logs
Queueing IntelliSense update for files in translation unit of: /path/to/source.cc
cpptools/cpptools_finishUpdateSquiggles
Error squiggle count: 0
Update IntelliSense time (sec): 0.255
...
cpptools/textEditorSelectionChange
cpptools/getCodeActions: file:///path/to/source.cc (id: 42)
textDocument/definition: file:///path/to/source.cc (id: 43)
idle loop: reparsing the active document
Checking for syntax errors: file:///my/file.cpp
Queueing IntelliSense update for files in translation unit of: /my/file.cpp
Timed out waiting for tag parser initialization.
cpptools/getDocumentSymbols
cpptools/activeDocumentChange: file:///my/file.cpp
cpptools/textEditorSelectionChange
cpptools/textEditorSelectionChange
cpptools/getCodeActions: file:///my/file.cpp (id: 7)
cpptools/getDocumentSymbols
Failed to read response from server: 22
cpptools/cpptools_finishUpdateSquiggles
cpptools/cpptools_finishUpdateSquiggles
Update IntelliSense time (sec): 6.404
idle loop: reparsing the active document
Checking for syntax errors: file:///my/file.cpp
Update IntelliSense time (sec): 0
textDocument/hover: file:///my/file.cpp (id: 8)
IntelliSense client not available, using Tag Parser for quick info.
textDocument/hover: file:///my/file.cpp (id: 9)
IntelliSense client not available, using Tag Parser for quick info.
textDocument/hover: file:///my/file.cpp (id: 10)
IntelliSense client not available, using Tag Parser for quick info.
cpptools/activeDocumentChange: file:///my/file.cpp
cpptools/textEditorSelectionChange
idle loop: reparsing the active document
Screenshots
 davidwin
All 15 comments
This sounds like https://github.com/microsoft/vscode-cpptools/issues/1163 (you'll need to manually set your browse: { path: [] } if additional paths are needed outside of the workspace folder). Does that workaround work?
The stuck on Initializing is usually caused by a stale/old processing holding a lock on the database, i.e. kill the old cpptools or Microsoft.VSCode.CPP.Extension processes should fix it. I think we've fixed at least one case that could cause this to happen for our next release (but there could be other causes still).
 sean-mcmanus
on 17 Apr 2020
sean-mcmanus
on 17 Apr 2020
Thanks, but I'm not sure this is #1163. I did give the c_cpp_properties.json file an extra look and discovered that two of the paths in the includePath array didn't exist. When I removed them (and restarted everything), the "No definition found" condition ceased. By adding a non-existing path back to includePath, I was back in the bad state again. So, there's one possible cause. In my case, the c_cpp_properties.json and compile_commands.json files are generated by tools from the build system, so it's easy enough to filter any paths that don't exist as a workaround. However, the non-existing include path is still present in the compile_commands.json file, but that doesn't seem to be a problem.
That brings me to the fact that I'm still quite confused by the relationships between compile_commands.json, the includePath, defines, and browse.path properties. If I'm editing a source file for which there is a compile_commands.json entry, I expect the IntelliSense engine to _only_ use that information, and maybe fall back to the other settings and the tag parser if there's a problem. But, that doesn't seem to be the way it works. If I have an empty browse.path, as you suggest, _all_ include files except system includes are marked as not found and no completion works. Having includePath empty (and no browse.path) works better - no warnings about missing includes - but completion doesn't work. For that to work (sometimes), all paths from compile_commands.json also need to appear in includePath (minus the non-existing ones). Also, is the compiler from compile_commands.json ever used, or only the one in the settings?
My mental model has been that the compile_commands.json file is the preferred source of "exact" compilation settings for the IntelliSense engine, and the c_cpp_properties.json file defines "good enough" fallbacks e.g. when opening a file that is not in compile_commands.json. Finally, the tag parser can serve up a soup of everything it found after indexing as many files as humanly possible, as a last ditch effort. But what actually happens seems more complex. Why is that necessary?
Then, are the paths in includePaths not recursive, as the documentation says? When the extension loads, I get this in the log, as the paths are indexed, suggesting something else:
Queueing IntelliSense update for files in translation unit of: /my/file.cc
Discovering files...
  Processing folder (recursive): /usr/lib/gcc/x86_64-linux-gnu/7/include/
  Processing folder (recursive): /usr/local/include/
  ...
One thing that confuses me is that the IntelliSense "experience" switches between different levels of operation by just navigating through a file. Sometimes completion, Go to Definition etc. just work, but out of nowhere everything stops working, to various degrees. In the log I can see that the engine is constantly processing the source, even if I only have a single file open and merely move around with the cursor, and it does more or less the same thing over and over again:
Checking for syntax errors: file:///my/file.cc
Resetting IntelliSense server:  /my/file.cc
terminating child process: 32649
Closing the communication channel.
sending compilation args for /my/file.cc
  include: /include/path/
  ...
  include: /usr/include
  define: __STDC__=1
  ...
  other: --g++
  other: --gnu_version=70400
  stdver: c++14
  intelliSenseMode: gcc-x64
Queueing IntelliSense update for files in translation unit of: /my/file.cc
cpptools/cpptools_finishUpdateSquiggles
Error squiggle count: 1
terminating child process: 32674
Error squiggle count: 1
cpptools/cpptools_finishUpdateSquiggles
textDocument/hover: file:// /my/file.cc(id: 42)
Failed to read response from server: 22
IntelliSense engine is not responding. Using the Tag Parser instead.
using Tag Parser for quick info
IntelliSense engine is not responding. Using the Tag Parser instead.
cpptools/cpptools_finishUpdateSquiggles
Checking for syntax errors: file:///my/file.cc
IntelliSense client is currently disconnected
cpptools/textEditorSelectionChange
cpptools/getCodeActions: file:///my/file.cc (id: 43)
I had expected that if I didn't edit the file, it needn't be reparsed for every time I hover over a new symbol, but that's what it looks like. The exact messages vary, but some of them don't sound too good, and may explain why IntelliSense so often feels broken.
That's a lot of information to process, and I'm probably touching on several issues that together cause IntelliSense to work so seemingly random. Again, it's too bad that I can't come up with a simple repro case for this, but maybe it just takes a real-world (closed-source, of course) project to run into these things.
Thanks for your attention!
davidwin
on 19 Apr 2020
Okay, so I bit the bullet and really tried to find what it is that upsets the IntelliSense engine so much, noticing that not all source files in the same project had this problem. I was lucky and detailed my finding in #5326. That issue is probably separate from this "No definition found" problem, which seems related to having non-existing paths in your includePath, although I'm not 100% certain what is going on here.
davidwin
on 19 Apr 2020
browse.path is used for global symbol parsing. You only need to set it to include all the root paths, such as ${workspaceFolder} plus any external folders that you want symbols to be found for. The includePath will get copied over to the browse.path by default, even though the includePath won't be used for IntelliSense (TU compilation) when compile commands is used. The compiler in compile commands should be used unless there's some problem, i.e. we have an issue open on the fact that we don't pass in all the args correctly for compiler querying, in which case setting the compilerPath/args is a potential workaround.
If you're using CMake, then CMake Tools is the preferred source, unless you hit a major bug with that, then you could fall back to compile_commands.json, unless you hit a major bug with that, then you could fall back to c_cpp_properties.json.
The tag parser (i.e browse.path) is always needed for global symbols outside of a TU (.cpp plus headers). The IntelliSense process only knows about symbols in a single TU, so if you go to def or find all references for symbols in other TU's then the symbol needs to be in the database from the tag parser.
The logging about "(recursive)" is from the browse.path processing.
Failed to read response from server: 22
IntelliSense engine is not responding. Using the Tag Parser instead.
That means the cpptools-srv (IntelliSense) process is crashing. We'll try to restart it later on, but it may crash again if the conditions of the crash are non-temporary. Yeah, I saw your other issue and filed a bug on VS for that. Thanks for reporting that.
I don't understand why having a non-existent path in includePath would cause browsing to fail. I tried to repro that but it didn't repro. Are you able to repro that with some simple project? If you set C_Cpp.loggingLevel to debug and look for "tag parser" and "discovering files..." logging you might be able to see why the parsing is failing.
sean-mcmanus
on 21 Apr 2020
Thanks for the explanation! The way that the C++ tools work make perfect sense, but I have probably been confused by the crashing bug that I found later, which has caused IntelliSense to fall back to the tag parser more often than it normally would. I really hope that it has been the ghost that has been haunting the IDE experience lately, because that std::bind construct turns out to be quite common in the code base... We'll see if there is any relation between that problem and "No definition found", which happens more sporadically.
So, if I have valid compile_commands.json (or working c_cpp_properties.json) so there are no error squigglies for a TU, I should always be able to Go to Definition on a header file and get the actual file that the compiler included at that point, and not the results of some exhaustive search, which might turn up ten versions of a header with the same name? That is, after IntelliSense parsing has completed and there is no "flame icon" in the status bar.
In my case, I can't use CMake Tools, but I have scripts that create compile_commands.json and update c_cpp_properties.json from an internal build system. The intention is that IntelliSense should be "perfect" if you edit a TU that is part of the current project, but also have a chance of decent results if you open a file that isn't part of the current compile_commands.json, because c_cpp_properties.json will contain a "merge" of all information in the database. Your description of the variuous fallback paths makes me believe that this should work as intended.
Thanks again!
davidwin
on 21 Apr 2020
If there are no squiggles for a file that interfere with the IntelliSense type parsing, then Go to Def (or Find All References) on a header symbol should be able to locate the correct definition, unless there is a bug or other error. But if the definition is in a different TU that has source outside of the workspace folders, then that folder would need to be added to the browse.path setting or added as a new workspace folder (even if it's referenced in the compile comands).
sean-mcmanus
on 21 Apr 2020
When I first reported this bug, I was thrown off-scent because of that std::bind IntelliSense bug that you very quickly managed to fix in v0.28.0. Great work there! Now, this "no definition found" issue is haunting me again, despite the fact that much has changed:
- New version of VS Code (1.45.1, also happened in 1.45.0)
- New version of C++ plug-in
- Different project
- Using Remote SSH instead of Remote WSL
I suspected that the problem had something to do with a directory in the includePath setting not existing on disk, but that theory is wrong. No matter what I do, I can't get definitions for any symbol, despite there being no squiggles and e.g. completions working perfectly. When I hover over the symbol, I can see the definition just fine, but I can't jump to it, even if it's a local variable in the same function. The message appears instantly, i.e. no sign of a database lookup happening at all.
I have selected a different compile_commands.json file for a different sub project, cleaned out the c_cpp_properties.json file, restarted VS Code, reset the IntelliSense database, rescanned the Workspace, set the IntelliSense cache to 0 and back, and nothing has helped. If the source file isn't in the compile_commands.json file, I can't open a system include for which there is no squiggle, so it can't be something from the project compilation flags that causes this problem. The log shows nothing suspicious when Go To Definition fails, so I'm at a loss here. (I figure carnal sacrifice is next on the list of things to try, but I thought I'd give GitHub a try first.)
Just as before, when I try to open an include file with F12, the message doesn't state the full file name, but strangely only the part that is under the cursor:
davidwin
on 15 May 2020
@davidwin It sounds like you're describing multiple issues.
Go to definition on local symbols is handled by IntelliSense normally, but if that doesn't work then that implies that the IntelliSense process isn't functioning. Do you see any other "Failed to read" messages. We're tracking a known issue at https://github.com/microsoft/vscode-cpptools/issues/5486 .
If a source file isn't in the compile_commands.json, then it will fall back to using the includePath/defines from c_cpp_properties.json (or the C_Cpp.default.* settings), but the system include paths should also be added to the browse.path. So I'm not able to repto the issue you describe. Can you provide more repro info? Do you see the path to sys (e.g. /usr/include/x86_64-linux-gnu) in your Includes when you do C/C++: Log Diagnostics? Maybe it's not using the correct compilerPath compared to the one in compile_commands.json?
sean-mcmanus
on 15 May 2020
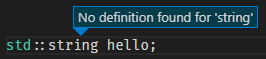
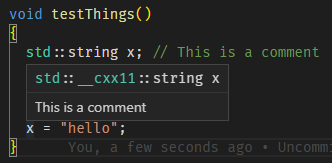
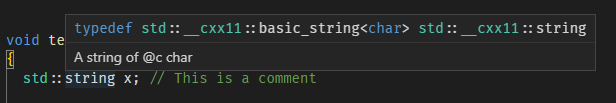
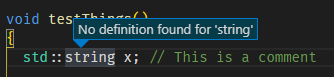
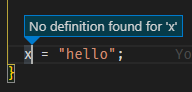
Regarding the first point, IntelliSense seems to be very much working. I don't see any "Failed to read" or other error-like messages in the log. This is different from when I first reported the issue, and also ran into the std::bind bug. For instance, when I hover over x here, I get the correct definition and the comment. The same goes with hovering over std::string:
Completions on x are also correct:
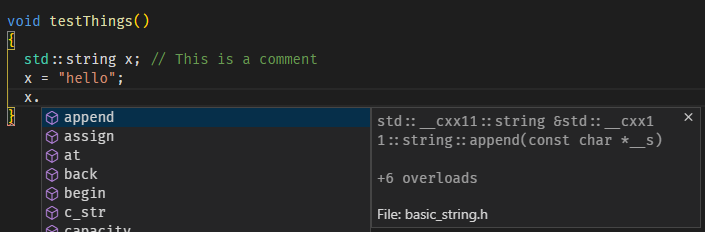
But still, I can't navigate to the definition of x a few lines up, or to the definition of std::string, despite the fact that the IntelliSense engine at least knows the name of the source file. It's the same with symbols that are defined within the Workspace:
And for the second point, I see very consistent info from the Log Diagnostics when I gradually remove information from c_cpp_properties.json: Not setting compileCommands results in IntelliSense picking up includePath and defines settings, and if these are sufficient, I get no red squiggles (but still can't Go To Definition). Clearing out both those properties results in a lot of squiggles, of course, except for system includes. In all cases, I also see the system include paths and the correct compiler-specific includes (the compiler is not in /usr/bin) listed in the log, although they are not stated explicitly in any settings file.
When I changed the IntelliSense Fallback option to Enabled, I noticed that the Tag Parser was unable to provide any help at all, but just showed "Initializing..." on every symbol. I don't know if that's relevant on not. There wasn't any "fire" in the status bar, and all processes were pretty idle.
Yes, a repro case would be excellent. The "funny" thing is that IntelliSense worked a couple of days ago, probably before I pulled down a new version of the repo I'm working in. Another Workspace on the same SSH host with very similar settings still works as expected. I can't do that test right now, but when I get the chance, I'll see if things get better if I checkout an earlier commit. Then at least I'd be able to focus on the diff to see if there's anything out of the ordinary there.
davidwin
on 16 May 2020
Update: I noticed a subtle difference between the Workspace where Go To Definition works and the one where it doesn't: Pressing CTRL in the "good" Workspace turns the pointer into a hand and turns symbols under the hand into underlined, clickable links. In the "bad" Workspace, nothing happens.
davidwin
on 16 May 2020
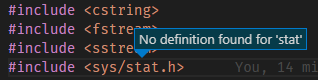
I found one more clue: There is something wrong with the Tag Parser in the problematic Workspace. I found this single log entry:
Timed out waiting for tag parser initialization.
When I hover over the database symbol in the status bar, it says "Tag parser initializing". After reloading VS Code, I see a lot of Folder: /path will be indexed messages but no tag parsing file: /path/file.cc entries. Finally, when I reset the IntelliSense database, I get a lone message in the log:
cpptools/resetDatabase
In a "healthy" Workspace, this is followed by a lot of entries from the Tag Parser.
I doubt that there is some construct in the code that is wrong - I copied the exact same source over to WSL and Go To Definition worked correctly there (although path names and the compiler version were different).
davidwin
on 16 May 2020
So I found a way to get back into a working state. Before, I had tried to restart VS Code and even went through updates of both the editor and the C++ extension without getting Go To Definition back. Then I noticed that I had a lot of processes related to cpptools running on the remote server, even after shutting down all VS Code instances. There were no node processes, so VS Code had at least cleaned up after itself.
Most processes were recent cpptools and cpptools-srv, but there was one cpptools from 0.27.1 that had been running for over a week and a couple of Mono processes for the debug adapter dating back to the beginning of February and 0.26.3, when times were simpler! It was possible to kill all processes with SIGTERM, and then things got back to normal. (If only certain other problems had so simple solutions...)
At least one of these processes obviously held on to some kind of lock for way too long, so there's one thing to look into. Then it seems like the lifetime management of the extension processes is lacking, which means that a simple Reload Window doesn't work as a quick sledgehammer solution to any glitches (which is usually the case in VS Code).
davidwin
on 16 May 2020
Yes -- you've hit a known problem with dangling cpptools locking the database, which is used for Go to Definition. We received many reports of this, but don't understand why VS Code is not properly terminating our child process and haven't found a good way to repro it. It's possible it has something to do with the upgrade process, since we seem to get an uptick in reports after we release a new version (with the old version being dangling). I think we may already have an open issue tracking this, but I'm not sure, so I'll convert this issue to that.
sean-mcmanus
on 18 May 2020
This appears to be a dupe of https://github.com/microsoft/vscode-cpptools/issues/4508 . Closing this one.
 Colengms
on 9 Dec 2020
Colengms
on 9 Dec 2020
Hi @davidwin. Are you still repro'ing this issue? As mentioned in the duplicate issue, our cpptools/cpptools.exe process lifetime is managed by VS Code. If you are seeing this process linger (as something other than a zombie process, which does not actually keep files open or use memory), that would seem to be a VS Code issue, and we should open a new issue in the VS Code repo for it. Or, if the cpptools process you observed was actually a zombie process, the issue you reported would seem to be due to another cause and need further investigation.
Colengms
on 15 Dec 2020
Related issues
 peterwoods1
·
3Comments
peterwoods1
·
3Comments
 SkyRiderMike
·
3Comments
SkyRiderMike
·
3Comments
 DemoCrazer
·
3Comments
DemoCrazer
·
3Comments
 jrieken
·
3Comments
jrieken
·
3Comments
 CDitzel
·
3Comments
CDitzel
·
3Comments
Most helpful comment
Yes -- you've hit a known problem with dangling cpptools locking the database, which is used for Go to Definition. We received many reports of this, but don't understand why VS Code is not properly terminating our child process and haven't found a good way to repro it. It's possible it has something to do with the upgrade process, since we seem to get an uptick in reports after we release a new version (with the old version being dangling). I think we may already have an open issue tracking this, but I'm not sure, so I'll convert this issue to that.