Vscode-cpptools: Excessive resources used by C/C++ extension
Issue Type: Performance Issue
Open a large project with >150k source files and this extension uses up to 50% of my CPU and ~40% of my hard drive's I/O constantly. When I disable the extension, the issue goes away.
Extension version: 0.25.1
VS Code version: Code 1.39.0 (9df03c6d6ce97c6645c5846f6dfa2a6a7d276515, 2019-10-09T06:58:03.188Z)
OS version: Linux x64 4.15.0-64-generic
System Info
|Item|Value|
|---|---|
|CPUs|Intel(R) Core(TM) i7-7820HQ CPU @ 2.90GHz (8 x 3514)|
|GPU Status|2d_canvas: enabled
flash_3d: enabled
flash_stage3d: enabled
flash_stage3d_baseline: enabled
gpu_compositing: enabled
multiple_raster_threads: enabled_on
native_gpu_memory_buffers: disabled_software
oop_rasterization: disabled_off
protected_video_decode: unavailable_off
rasterization: disabled_software
skia_deferred_display_list: disabled_off
skia_renderer: disabled_off
surface_synchronization: enabled_on
video_decode: unavailable_off
viz_display_compositor: disabled_off
webgl: enabled
webgl2: enabled|
|Load (avg)|3, 3, 2|
|Memory (System)|15.55GB (1.15GB free)|
|Process Argv|--unity-launch|
|Screen Reader|no|
|VM|0%|
Process Info
CPU %   Mem MB     PID  Process
    0      127   30752  code main
    0       32   30754     zygote
    1      143   31095       shared-process
    0        0   32542         /bin/sh -c /bin/ps -ax -o pid=,ppid=,pcpu=,pmem=,command=
    0        0   32543           /bin/ps -ax -o pid=,ppid=,pcpu=,pmem=,command=
    0      175   31281       window (firmwareVersions.py - vi-dvr - Visual Studio Code)
    0      111   31309         extensionHost
    0       80   31327         watcherService
    0       48   31343         searchService
    0      191   32393       window (ambafs.h - vi-msi-os - Visual Studio Code)
    0        0   32423         /bin/bash
    1      143   32434         extensionHost
    3      207   32486           /home/dennis/.vscode/extensions/ms-vscode.cpptools-0.25.1/bin/Microsoft.VSCode.CPP.Extension.linux
    0       80   32519       window (Issue Reporter)
    0      127   30783     gpu-process
Workspace Info
|  Window (firmwareVersions.py - vi-dvr - Visual Studio Code)
|  Window (ambafs.h - vi-msi-os - Visual Studio Code)
|    Folder (vi-msi-os): more than 155915 files
|      File types: o(9444) manifest(7236) d(2257) stderr(272) TAG(16) log(12)
|                  c(12) h(11) 7z(10) sh(7)
|      Conf files: makefile(18) settings.json(2)
|    Folder (vi-dvr): 1585 files
|      File types: c(401) h(132) py(54) cpp(52) rst(51) json(44) sh(34)
|                  xml(26) cmake(25) in(21)
|      Conf files: cmake(25) makefile(9) settings.json(1) package.json(1);
 destenson
All 70 comments
The extension is likely indexing your workspace and preparing a database when you first open the folder. The CPU usage should go away after the extension completes. You can reduce the CPU usage by setting the "C_Cpp.workspaceParsingPriority" setting to "low".
 bobbrow
on 10 Oct 2019
bobbrow
on 10 Oct 2019
I've been using VS Code with this project for months and this behavior just started in the last week or so.
destenson
on 11 Oct 2019
What process is using the CPU/IO? Is there a database or flame icon showing?
It's possible a symlink was added to your project that suddenly caused a big increase in file processing (see https://github.com/microsoft/vscode-cpptools/issues/3123 ).
0.25.1 shipped August 28th, so our extension should not have had a behavior change in the last week.
 sean-mcmanus
on 12 Oct 2019
sean-mcmanus
on 12 Oct 2019
I am also affected while browsing source code for the Linux kernel. This dramatically slows down the UI, making the editor unusable.
"C_Cpp.workspaceParsingPriority" setting to "low".
This hasn't helped.
Would you guys please have a look at this? @sean-mcmanus @bobbrow
It's been a few days already and the parsing never completes.
 dwlsalmeida
on 8 Nov 2019
dwlsalmeida
on 8 Nov 2019
@dwlsalmeida Are you hitting https://github.com/microsoft/vscode-cpptools/issues/4470 ?
sean-mcmanus
on 9 Nov 2019
I don't think so, because the database icon is showing, unlike #4470
dwlsalmeida
on 9 Nov 2019
@dwlsalmeida I believe the database icons showing or not is unrelated because the operations are on different threads. When you hover do you see the progress % change? Are you able to click the database icons and choose "Pause Parsing"?
sean-mcmanus
on 9 Nov 2019
When you hover do you see the progress % change?
yes, but it never completes. It either crashes or roll back when I check out a different branch.
Are you able to click the database icons and choose "Pause Parsing"?
yes but it does not help.
My issue is that this basically freezes the UI, even after choosing "low" in the settings.
dwlsalmeida
on 9 Nov 2019
@dwlsalmeida Our extension runs out of process from the VS Code UI, so it's rare that we could cause the UI to freeze until we're causing the entire OS to have problems. What processes do you see using the CPU? Does this problem repro when you disable our C/C++ extension?
Does this repro when you revert to 0.25.1 of our extension via the "Install Another Version..."?
sean-mcmanus
on 9 Nov 2019
@sean-mcmanus actually now I do not think this is caused by this extension. There's countless 'git' and 'sort' instances being spawned by vscode and these are eating all the CPU and RAM. I can also reproduce with this extension off.
edit: Yep, not related to you guys at all, sorry..
dwlsalmeida
on 12 Nov 2019
I've got two windows running with database parsing paused and the parsing priority set to low, but there are still two "C/C++ Extension for Visual Studio Code (32 bit)" running each consuming around 15% of the CPU. I would like 30% back for compiling.
 BillDenton
on 27 Nov 2019
BillDenton
on 27 Nov 2019
@BillDenton Open files will consume CPU resources for parsing of dependencies even if the background parsing is paused. Does closing all editors and then doing a Reload Window reduce the CPU usage?
sean-mcmanus
on 27 Nov 2019
I closed all open editors - no difference. Used developer reload window - no difference. Shutdown VS Code and started again. No editors open. Still using 15% of CPU. Paused parsing and finally the usage went down. Now, I'm not sure what happened yesterday - I'll keep watching it.
It there any way of programmatically stopping the background usage when a task runs. Why is it taking so long to parse files?
BillDenton
on 28 Nov 2019
@BillDenton You can set the "C_Cpp.loggingLevel" to "Debug" to see output in regards to what files are being tag parsed to see why it's taking so long, so if you see files getting parsed that shouldn't be, then the folders could get added to the files.exclude. There is no programmatic way to "Pause Parsing". Other users in the past have requested some setting where it would not do any background parsing unless manually invoked. You can also set your "browse.path" to have less paths to parse. Features like Go to Def and Find All Refs won't work correctly though if the target files haven't been parsed yet though.
sean-mcmanus
on 3 Dec 2019
@sean-mcmanus What should I look for in the log?
Whilst running the build I can see quite a few:
cpptools/fileDeleted
cpptools/fileChanged
cpptools/fileChanged
cpptools/fileCreated
cpptools/fileDeleted
cpptools/fileCreated
cpptools/fileDeleted
cpptools/fileCreated
cpptools/fileCreated
cpptools/fileCreated
cpptools/fileCreated
cpptools/fileCreated
cpptools/fileDeleted
cpptools/fileDeleted
cpptools/fileDeleted
cpptools/fileDeleted
cpptools/fileCreated
cpptools/fileCreated
cpptools/fileDeleted
cpptools/fileDeleted
cpptools/fileDeleted
cpptools/fileCreated
cpptools/fileDeleted
Is it seeing build temp files? If so, which ones?
BillDenton
on 3 Dec 2019
Yeah, the files could be any files that are created/deleted in the workspace. Those are the only logs you see when the CPU usage is high? We would need to add more logging to see what files are being processed -- or you maybe able to use an OS-specific tool to see all the files our process touches (e.g. process explorer).
https://github.com/microsoft/vscode-cpptools/issues/4609 is a similar (or the same) issue.
sean-mcmanus
on 6 Dec 2019
I've installed Sysinternals process explorer. As far as I can tell it doing very little I/O (at least at the moment, I'm not editing, git or building at the moment). But there is still one thread that is occupying about 12.5 % of the CPU. See:

BillDenton
on 6 Dec 2019
@sean-mcmanus I think it's the same root cause as #2806.
@BillDenton if you kill the process, does it restart and continue to consume a full CPU core? (I'm just ruling out whether this is a runaway process from a previous session or not)
bobbrow
on 6 Dec 2019
I killed the process and so far the high usage hasn't appeared. The cpptools output window shows:
"[Error - 11:05:32] Connection to server got closed. Server will not be restarted."
Note: This is happening on two Windows machines on different folders (all containing git repos for the same code base on various branches).
BillDenton
on 7 Dec 2019
Despite the error message, did the process restart? I believe that message happens because we tell VS Code not to relaunch the process for us (we manage it in our extension).
And does it only get in this state after you switch branches in git or build your code?
bobbrow
on 7 Dec 2019
It seems to happen all the time - I don't need to switch branches or build. It is a large code base. I've just started VS Code and left it for about 5 minutes and can see:
Database safe to open
tag parsing file:
Database safe to open
tag parsing file:
Database safe to open
tag parsing file:
Database safe to open
tag parsing file:
tag parsing file:
tag parsing file:
tag parsing file:
5 more of the same
Database safe to open
tag parsing file:
Database safe to open
tag parsing file:
tag parsing file:
tag parsing file:
etc
this is still going on. It seems to re-parsing everything. I've not changed the code since VS code was last opened.
After about 20-30 minutes:
Parsing: 21834 files(s) processed
Done parsing remaining files.
The CPU usage has dropped to about 2%.
Starting a build is showing a lot of "cpptools/fileCreated", "cpptools/fileDeleted". I presume it is picin up intermediate files from build. Is there anyway of finding the files so I can exclude them
BillDenton
on 8 Dec 2019
Today, I've left the editor alone for over an hour and its still using 15% CPU. Also, it appears to re-parsing files that haven't changed, e.g.
cpptools/activeDocumentChange
cpptools/textEditorSelectionChange
idle loop: reparsing the active document
Checking for syntax errors: file:///<.h filename with />
Queueing IntelliSense update for files in translation unit of:
Error squiggle count: 4
Update IntelliSense time (sec): 0.257
cpptools/fileDeleted
tag parsing file:
cpptools/activeDocumentChange
cpptools/textEditorSelectionChange
cpptools/textEditorSelectionChange
cpptools/getCodeActions: 22
idle loop: reparsing the active document
Checking for syntax errors: file:///
Queueing IntelliSense update for files in translation unit of:
Error squiggle count: 4
Update IntelliSense time (sec): 0.257
cpptools/textEditorSelectionChange
cpptools/getCodeActions: 23
I've not edited either of these files. Why is it burning CPU cycles to doing nothing useful?
BillDenton
on 9 Dec 2019
Re-tag parsing can occur if the database safety check failed (it will show an error message in logs if that occurs).
The idle loop reparsing is IntelliSense parsing (different from the tag parsing)...it will do that after switching documents to clean up any potential stale state. The time it took is only 0.257 seconds -- is that the 15% usage you're seeing?
sean-mcmanus
on 9 Dec 2019
"The time it took is only 0.257 seconds -- is that the 15% usage you're seeing?" I doubt it as sticks at ~15% (almost?) all the time. At the moment there is nothing new appearing in the log, but the CPU is ~15%.
BillDenton
on 10 Dec 2019
If it's still using 15% CPU and you're getting no logging output, that sounds like it could be a bug. Is there a database or flame icon appearing in the status bar? Are you able to attach a debugger to get a call stack? Does it only repro for certain large projects? Does it repro still if you remove recursive includes "**" from your includePath?
sean-mcmanus
on 10 Dec 2019
Re-started VS Code this morning (I closed it last thing yesterday to speed up my build). As soon as it starts there is 15% CPU. All my repos are the same large project, so I don't know about small projects. My "includePath" is:
            "includePath": [
                "${default}",
                "${workspaceFolder}/**/interface",
                "${workspaceFolder}/**/include"
            ],
At the moment, I don't have "compile_commands.json" as our build system doesn't produce it, but I do have it in ".vscode\c_cpp_properties.json", as I was experimenting with generating "compile_commands.json".
Tests:
- Remove "includePath". Shutdown VS Code. Start it again. Still using 15% so far about 10 minutes. Whilst doing this I can see it parsing files (not ones I'm editting). Also, whilst I'm doing a build (in outside VS Code), I can see "cpptools/fileCreated" & "cpptools/fileDeleted". So I think it is picking up build intermediate files, but I have no idea where they are because there is no filename. Could you add the filename to the "cpptools/fileCreated" & "cpptools/fileDeleted" messages.
- Also, remove "compileCommands". Shutdown VS Code. Start it again. Still using 15%.
BillDenton
on 11 Dec 2019
Any update? The extension just keeps occupying ~15% CPU, which could be used for builds.
BillDenton
on 18 Dec 2019
@BillDenton I don't think we understand what is going on or what the repro is (this is the only report we've seen like this). Did you try to attach a debugger to get a call stack?
sean-mcmanus
on 19 Dec 2019
@sean-mcmanus I can attach MS Visual Studio Professional 2017 debugger and record a CPU profile. As I don't have the symbol data, I've got no idea what it is doing. I'm not familiar with the diagnostic tools, so don't know if there is anything I can save and send to you. Please provide some detailed instructions.
BillDenton
on 2 Jan 2020
Symbol data should be available via adding https://msdl.microsoft.com/download/symbols to your symbol path (and/or the "Microsoft Symbol Servers" option).
We probably don't really need a full CPU profile diagnostic log...simply breaking into the debugger while it's using the CPU and getting the call stack of the thread that is doing the work (not stuck idle) should be sufficient for us to tell what is going on. You also could use Visual Studio Code to attach and get the call stack.
sean-mcmanus
on 2 Jan 2020
I've added Options, Debugging, Symbols: Microsoft Symbol Servers. It breaks in:


BillDenton
on 2 Jan 2020
Can you expand all the threads and look for a call stack that appears to be doing "real work"? If you use the Parallel Stacks window it would probably be the thread(s) with the largest call stack(s).
wkernelbase.pdb is loaded for me -- are you attaching with "Native" mode debugging? In the Modules window is everything "Symbols loaded." in the Symbol Status column?
sean-mcmanus
on 2 Jan 2020
Does look right in the Modules window:

I attached with Automatically determine the type of code to debug. I'll try again with "Native" using "Debug these symbol types"
BillDenton
on 2 Jan 2020
You're missing the required symbols...something is causing the symbols to not be loaded. "Automatic" mode should do the correct thing already (i.e. Native). I see it say "Loading symbols for *.dll from: Microsoft Symbol Servers" after I delete my symbol cache to trigger a re-load.
sean-mcmanus
on 2 Jan 2020
After re-attaching the symbols have loaded:

I've not managed to see the call stacks in the "parallel stacks" window.
BillDenton
on 2 Jan 2020
Debug->Windows->Parallel Stacks -- if it's not there maybe it's only on certain SKUs of VS or it's an optional feature? (it's not required).
There's a downward arrow in the Location column you can expand to see the call stack of the thread (or the + button to expand all the threads, or Debug->Windows->Call Stack").
However, I see "enumerate_files_win32" at the top of the call stack which is sufficient to diagnose the problem -- our code is stuck on recursively enumerating through the files in your browse.path. This can be caused by either a huge path in your browse.path or a symlink that points to a path with a large number of children (see https://github.com/microsoft/vscode-cpptools/issues/3123 ) or reference to a slow network drive. Another previous issue is https://github.com/microsoft/vscode-cpptools/issues/2633 . Are you able to remove the large folder or symlink from your workspace? files.exclude doesn't work because our exclusion checker runs after the enumerate_files (which we intend to fix). Unfortunately, there is no logging at this point to see what locations are being traversed, but you could probably see via a tool such as Process Monitor (https://docs.microsoft.com/en-us/sysinternals/downloads/procmon).
sean-mcmanus
on 2 Jan 2020
I don't have a symbolic link or network drive. Could I use watcherExclude?
In c_cpp_properties.json I have:
{
"name": "Win32",
"browse": {
"limitSymbolsToIncludedHeaders": true,
"databaseFilename": ""
},
"cStandard": "c89",
"cppStandard": "c++03",
"intelliSenseMode": "msvc-x64"
}
BillDenton
on 2 Jan 2020
I've got the process monitor running. I can see that it going into "build" directories. We have a lot of directories called "build" where compiler temporary files are placed.
Using:
"files.exclude":
...
"**/build": true,
doesn't appear to have excluded the build directories. I need to exclude every "build" subdirectory inside the workspace folder.
BillDenton
on 2 Jan 2020
We don't look at watcherExclude at all yet (I think we have an issue tracking adding support for that), but we'd need to refactor/rewrite our code to use files.exclude first.
Using databaseFilename as "" is not recommended (i.e. not sure if we handle that well, better to remove it or set it).
You have no browse.path set, so it would use the default, of ${workspaceFolder}. With no includePath it would also be using the default of ${workspaceFolder}/** which is recursive includes, which could trigger additional enumerate_files in certain conditions, so it might be worth setting your includePath to ${workspaceFolder} to see if that fixes it.
If you have no symbolic link or network drive, does your workspace just have lots of files/directories (like >100k)?
Yeah, a build directory in the workspace might cause problems or unneeded processing.
sean-mcmanus
on 2 Jan 2020
What do you mean "**/build": true didn't work? It should exclude it from most systems that check it and it should exclude the subdirectories (i.e. all the folders named "build" in the workspace). The only major system that doesn't check it is the enumerate_files code (it would enumerate the files in the build directories and the exclude them later on). But excluding the build folder might cause us to avoid unnecessary processing, cache deletion, etc. from our detecting of new files in those folders.
sean-mcmanus
on 2 Jan 2020
It is a very large project. Running from git bash:
ls -R |wc
121015 106921 275709
I've updated the settings to:
{
"name": "Win32",
"includePath": [
"${workspaceFolder}"
],
"browse": {
"limitSymbolsToIncludedHeaders": true,
},
"cStandard": "c89",
"cppStandard": "c++03",
"intelliSenseMode": "msvc-x64"
}
Its still using 15% CPU. I'm quitting and reloading VS Code.
ProcMon still shows query directory and create file for the build directories. Its late here, so I'll look again tomorrow if I get a chance.
BillDenton
on 2 Jan 2020
You're not using recursive includes any more, so that isn't the cause. It sounds like your workspace may be too large (>100k files) for our extension to handle until we can fix https://github.com/microsoft/vscode-cpptools/issues/3123 . Opening subfolders with less files may be a workaround, but our current multi-root workspace support is non-ideal (we're in the middle of re-implementing that).
sean-mcmanus
on 2 Jan 2020
Recently this plugin has been using so much RAM it's at the top of htop.
code --status
Version:          Code 1.44.2 (ff915844119ce9485abfe8aa9076ec76b5300ddd, 2020-04-16T17:50:03.709Z)
OS Version:       Linux x64 5.4.0-28-generic
CPUs:             Intel(R) Core(TM) i7-2760QM CPU @ 2.40GHz (8 x 964)
Memory (System):  7.66GB (0.12GB free)
Load (avg):       13, 18, 11
VM:               0%
Screen Reader:    no
Process Argv:     --no-sandbox --unity-launch
GPU Status:       2d_canvas:                     enabled
                  flash_3d:                      enabled
                  flash_stage3d:                 enabled
                  flash_stage3d_baseline:        enabled
                  gpu_compositing:               enabled
                  multiple_raster_threads:       enabled_on
                  oop_rasterization:             disabled_off
                  protected_video_decode:        unavailable_off
                  rasterization:                 disabled_software
                  skia_renderer:                 disabled_off_ok
                  video_decode:                  unavailable_off
                  viz_display_compositor:        enabled_on
                  viz_hit_test_surface_layer:    disabled_off_ok
                  webgl:                         enabled
                  webgl2:                        enabled

CPU %   Mem MB     PID  Process
    0       39  122584  code main
    0        0  122586     zygote
    0       86  122610     gpu-process
    0        0  122623     utility
    0       71  122720     shared-process
    0        0  178533       /bin/sh -c /bin/ps -ax -o pid=,ppid=,pcpu=,pmem=,command=
    0        0  178534         /bin/ps -ax -o pid=,ppid=,pcpu=,pmem=,command=
    0      220  162754     window (csearch - json.hpp - vscode)
    0       86  162785       extensionHost
    0       39  162854         electron_node server.js
    0        8  162913         /usr/share/code/code /usr/share/code/resources/app/extensions/json-language-features/server/dist/jsonServerMain --node-ipc --clientProcessId=162785
    0        0  162794       /usr/bin/zsh
    0        8  162824       watcherService
    0        0  174111       searchService
    0      196  163222     window (depender - specs.teaspec.lock - vscode)
    0       86  163250       extensionHost
    0       63  163319         electron_node server.js
    0       86  163329         /home/blue/.vscode/extensions/ms-vscode.cpptools-0.28.0-insiders2/bin/cpptools
    0        8  166920           /home/blue/.vscode/extensions/ms-vscode.cpptools-0.28.0-insiders2/bin/cpptools-srv 163329 7
    0        0  167402           /home/blue/.vscode/extensions/ms-vscode.cpptools-0.28.0-insiders2/bin/cpptools-srv 163329 8
    0        0  167739           /home/blue/.vscode/extensions/ms-vscode.cpptools-0.28.0-insiders2/bin/cpptools-srv 163329 9
    0        0  173546           /home/blue/.vscode/extensions/ms-vscode.cpptools-0.28.0-insiders2/bin/cpptools-srv 163329 10
    0      337  174994           /home/blue/.vscode/extensions/ms-vscode.cpptools-0.28.0-insiders2/bin/cpptools-srv 163329 11
    0        0  163386         /usr/share/code/code /usr/share/code/resources/app/extensions/json-language-features/server/dist/jsonServerMain --node-ipc --clientProcessId=163250
    0        8  163289       watcherService
    0        0  177565       /usr/bin/zsh
    0        0  178481         bash /usr/bin/code --status
    0       47  178486           electron_node cli.js
    0       94  178498             /usr/share/code/code --status --no-sandbox
    0       31  178500               zygote
    0       63  178524               gpu-process
    0       47  170524     window (ubuild - project_detect.cpp - vscode)
    0       16  170552       extensionHost
    0        0  170617         electron_node server.js
    0        0  170673         /home/blue/.vscode/extensions/ms-vscode.cpptools-0.28.0-insiders2/bin/cpptools
    0        0  170748           /home/blue/.vscode/extensions/ms-vscode.cpptools-0.28.0-insiders2/bin/cpptools-srv 170673 1
    0        0  171008           /home/blue/.vscode/extensions/ms-vscode.cpptools-0.28.0-insiders2/bin/cpptools-srv 170673 2
    0        0  171397           /home/blue/.vscode/extensions/ms-vscode.cpptools-0.28.0-insiders2/bin/cpptools-srv 170673 4
    0        0  171812           /home/blue/.vscode/extensions/ms-vscode.cpptools-0.28.0-insiders2/bin/cpptools-srv 170673 5
    0        0  170561       /usr/bin/zsh
    0        0  170590       watcherService
    0      251  176423     window (subprocess - environ.cpp - vscode)
    0      102  176456       extensionHost
    0      110  176531         electron_node server.js
    0      188  176542         /home/blue/.vscode/extensions/ms-vscode.cpptools-0.28.0-insiders2/bin/cpptools
    0       94  176605           /home/blue/.vscode/extensions/ms-vscode.cpptools-0.28.0-insiders2/bin/cpptools-srv 176542 0
    0       94  176683           /home/blue/.vscode/extensions/ms-vscode.cpptools-0.28.0-insiders2/bin/cpptools-srv 176542 2
    0       24  176496       watcherService
    0        0  177060       /usr/bin/zsh

Workspace Stats:
|  Window (subprocess - environ.cpp - vscode)
|  Window (ubuild - project_detect.cpp - vscode)
|  Window (depender - specs.teaspec.lock - vscode)
|  Window (csearch - json.hpp - vscode)
|    Folder (subprocess): 979 files
|      File types: html(171) js(85) png(78) md5(55) cmake(54) map(54) o(40)
|                  h(39) cpp(35) obj(30)
|      Conf files: cmake(54) settings.json(1)
|    Folder (ubuild): 190 files
|      File types: hpp(32) cpp(30) o(30) pyc(9) py(7) txt(6) cmake(6)
|                  teaspec(5) log(3) a(3)
|      Conf files: cmake(6) settings.json(1)
|    Folder (csearch): more than 68667 files
|      File types: hpp(13142) html(824) js(390) cpp(215) o(94) cmake(90)
|                  md(88) a(83) htm(79) txt(65)
|      Conf files: cmake(90) makefile(13) sln(2) launch.json(1)
|                  settings.json(1) tasks.json(1)
|      Launch Configs: cppdbg(3)
|    Folder (depender): 694 files
|      File types: o(88) cpp(63) cmake(40) teaspec(39) h(39) hpp(34) png(24)
|                  pyc(21) py(17) txt(16)
|      Conf files: cmake(40) launch.json(1) settings.json(1) tasks.json(1)
|                  makefile(1)
|      Launch Configs: cppdbg
 benman64
on 7 May 2020
benman64
on 7 May 2020
@benman64 I see < 400 MB used by a cpptools-srv process? That is a normal amount of memory, depending on the TU. Is it a regression compared to the memory used by version 0.27.1?
sean-mcmanus
on 7 May 2020
htop was reporting way more than that. more than 5GB ram was freed when I closed vscode. I'm same guy as benman64
 graph
on 7 May 2020
graph
on 7 May 2020
You had 4 VS Code instances running? We don't have a mechanism for limiting resource usage across different VS Code instances. So if 1 VS Code instance is using 1.25 GB, then opening 4 could use 5 GB.
sean-mcmanus
on 7 May 2020
Interesting I guess I should use vscode workspaces for less ram usage. more features = more RAM, the nature of all software projects.
benman64
on 8 May 2020
@benman64 Yes, using a workspace with multiple workspace folders will cause only 1 cpptools process to be created (which will limit the number of IntelliSense processes as well, based on core count)...with 0.27.0 or newer.
sean-mcmanus
on 11 May 2020
There are so many of these issues I'm not sure what the correct one to post in is. So here goes :)
I too have extreme problems with the cpptools process (on Windows 10 with WSL1) consuming 100% of the CPU and never stopping (both flame symbol and database visible). What appears to trigger this is switching branches in git. Is there a way of having a per-git-branch vscode cache? That would probably fix many of my issues. I also use a build system called waf which allows me to build for multiple targets for the same source code. It would be great if there was a way of switching the compile_commands.json file used based on some environment variable.
I really like vscode, but this particular issue really reduces the utility for me
 andyp1per
on 12 May 2020
andyp1per
on 12 May 2020
Similar to @andyp1per we use scons with multiple build targets. Each VS Code permantently uses a whole core. As far as I know it never stops. Also looking at lots of irrelevant files, e.g. file:///
BillDenton
on 12 May 2020
@andyp1per Are you using the WSL remote extension to run our extension on WSL/Linux instead of Windows? That is the recommended way (otherwise you can hit some bugs related to case sensitivity of paths on Windows). We're still trying to find a repro for performance issues caused by switching branches (if that root problem can be fixed, I don't think a per-branch cache would be necessary...it wouldn't really scale well in regards to disk usage).
sean-mcmanus
on 13 May 2020
@sean-mcmanus yes I am using the WLS remote extension.
Although one thing I note is that intellisense gets really confused sometimes - if I Ctrl-Click on a function name it will (usually, hopefully) take me to that file, but sometimes it will open the file again rather than switching to where it is already open in the editor. When this happens the file has a full path rather than a relative path in the header. No idea why or what chain of events causes this, but it might be related.
andyp1per
on 13 May 2020
Please take a look at this issue, it makes laptops very hot and loud.
Example project that causes 100% core usage is boost.
Killing cpptools process will immediately restart it (and it sometimes doesn't show up in process explorer immediately)
Maybe it would be convenient to add way to ignore some directories (by path or maybe by files count)
 Rasie1
on 8 Jun 2020
Rasie1
on 8 Jun 2020
@Rasie1 Which process is using CPU? cpptools? You can add folders to files.exclude to reduce the processing or set the browse.path (in c_cpp_properties.json or C_Cpp.default.browse.path). You can set C_Cpp.loggingLevel to "Debug" to find more info on what folders are getting processed.
sean-mcmanus
on 9 Jun 2020
I've addressed this for myself with:
cpulimit -e cpptools -l 10
Without this, with "C_Cpp.workspaceParsingPriority" setting to "low" (both for workspace and user), cpptools is often at 100% revving up the CPU to 4.5Ghz from the baseline of 0.8Ghz. Ruining the zen. Also see 3.871g memory usage from cpptools.
 dchichkov
on 22 Jun 2020
dchichkov
on 22 Jun 2020
My laptop under ubuntu 18.04 also suffers this high cpu usage from version to version of vscode (currently 1.46).
cpptools is eating 100% cpu continuously and the RAM usage flirts with 100%. From time to time, the memory usage suddently increases to 100% (more?) such that my environment becomes unresponsive. When I kill cpptools (fortunately, it does not restart automatically), the laptop becomes quiet and the memory goes down to normal.
C_Cpp.workspaceParsingPriority was set to low for a long time, and definitely does not help.
 ropieur
on 6 Jul 2020
ropieur
on 6 Jul 2020
@ropieur That is not normal behavior, i.e. we need more repro info.
sean-mcmanus
on 7 Jul 2020
@sean-mcmanus,
I managed to restrain the memory usage by keeping only one branch of my (large) project in the workspace (which initially had 3 branches of the same large project). And it's worth noting that the boost library (amongst others) is part of the project.
ropieur
on 8 Jul 2020
Removing boost seem to greatly reduce 100% cpu usage intervals. Thanks @sean-mcmanus for the instruction on how to exclude directories
Rasie1
on 8 Jul 2020
I'm having issues with cpptools consuming memory, to the levels that it freezes the workstation for short periods. A Ubuntu 18.04 / 16Gb / ms-vscode.cpptools-0.27.1.
Just had to switch to switch to text console to kill cpptools, as it managed to freeze X.
dchichkov
on 5 Aug 2020
I have to do this regularly. @sean-mcmanus please, please at least provide a way of turning off cpptools!
andyp1per
on 6 Aug 2020
@andyp1per You could either disable the C/C++ extension or if you still want to use the debugger you could change the setting "C_Cpp.intelliSenseEngine" to "Disabled".
sean-mcmanus
on 6 Aug 2020
Navigation is important. With cpulimit, the situation is manageble. If it helps, this is what it is doing during that time:
  14.59%  [kernel]            [k] do_syscall_64
   8.39%  cpptools            [.] pagerWalFrames
   5.81%  cpptools            [.] code_store::CEncEditScript::ProcessNodeFromTree2
   5.42%  cpptools            [.] code_store::CEncParseNode::CEnum::MoveNext
   4.17%  [kernel]            [k] copy_user_enhanced_fast_string
   3.71%  cpptools            [.] code_store::CEncParseNode::InsertInTree
   2.47%  [kernel]            [k] __block_commit_write.isra.34
   2.30%  cpptools            [.] sqlite3BtreeMovetoUnpacked
   2.07%  cpptools            [.] sqlite3VdbeExec
   1.68%  [kernel]            [k] find_get_entry
   1.44%  [kernel]            [k] syscall_return_via_sysret
   1.27%  [kernel]            [k] iov_iter_fault_in_readable
   1.25%  cpptools            [.] pcache1Fetch
   1.20%  [kernel]            [k] start_this_handle
   1.15%  libc-2.27.so        [.] _int_malloc
   1.02%  [kernel]            [k] jbd2_journal_stop
   1.01%  [kernel]            [k] kmem_cache_alloc
   1.00%  [kernel]            [k] __fget
   1.00%  cpptools            [.] balance
dchichkov
on 7 Aug 2020
The same issues with cpptools-srv.exe 1.1.0.3 in VS Code 1.51.0, Win 10 x64 1909:
a lot of hard page faults (system has enough free RAM), makes system unresponsive.
Hard page faults for cpptools-srv.exe are abnormally higher than for any other process in system: like 70-100 times higher value.
 mrdc
on 8 Nov 2020
mrdc
on 8 Nov 2020
@mrdc Are you able to get any diagnostics in regards to what call stacks are causing the issue? See https://github.com/microsoft/vscode-cpptools/wiki/Troubleshooting-Performance-Issues . The page faults you're describing might be the normal expected behavior of our compiler. You could potentially try VS and compare with the vcpkgsrv.exe process and see if VS has the same issue.
sean-mcmanus
on 11 Nov 2020
@mrdc FYI, if the C_Cpp.intelliSenseCacheSize is not equal to 0 then the page faults could be due to the usage of large memory mapped cache files, so you could try changing that setting to 0, but the trade-off would be more CPU usage to re-compute the cached data.
sean-mcmanus
on 15 Nov 2020
@sean-mcmanus this is still happening. Here is a screenshot. I have debug on:
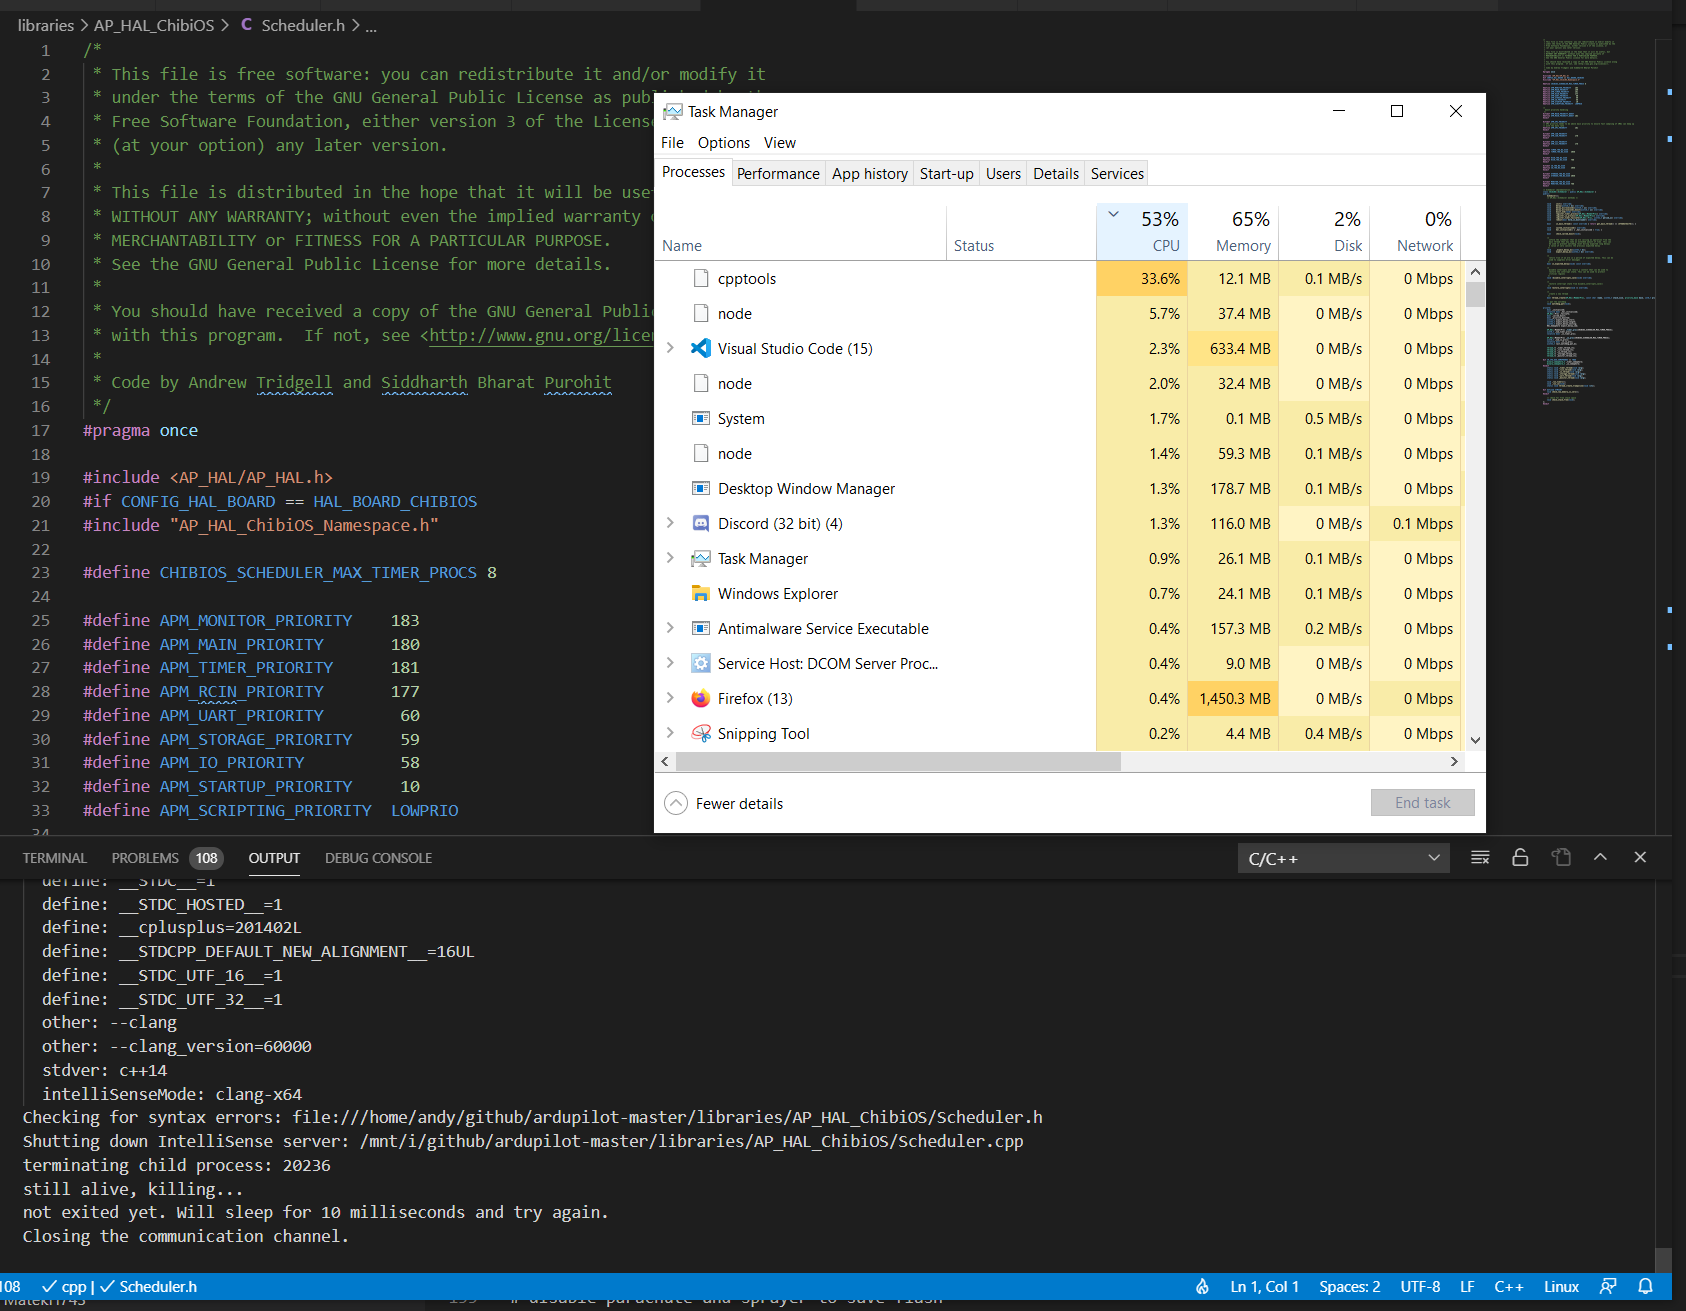
You can see high CPU usage, the little flame icon but no output.
Note that I am pretty sure this is linked to WSL - which is what I am using.
andyp1per
on 11 Dec 2020
@andyp1per It looks like you're hitting the WSL bug in which the call to the sleep is using 100% CPU. The fix is to update to WSL 2.
sean-mcmanus
on 11 Dec 2020
@sean-mcmanus until you fix https://github.com/microsoft/WSL/issues/2195 WLS2 is dead to me
andyp1per
on 12 Dec 2020
@andyp1per Saw some comments in that Github comment chain mentioning if you want USB pass-through in WSL2, you will have to bug Hyper-V dev team to add USB pass-through support, so that WSL2 can use USB pass-through.
WSL1 doesn't even support USB pass-through because of said Hyper-V limitation, hence that 2017 thread is still ongoing.
 tommai78101
on 13 Dec 2020
tommai78101
on 13 Dec 2020
Related issues
 arl
·
3Comments
arl
·
3Comments
 DemoCrazer
·
3Comments
DemoCrazer
·
3Comments
 SkyRiderMike
·
3Comments
SkyRiderMike
·
3Comments
 CDitzel
·
3Comments
CDitzel
·
3Comments
 ecbrodie
·
3Comments
ecbrodie
·
3Comments