Vscode-cpptools: C++ Debugging broken on linux with latest vscode
As reported by users here https://github.com/Microsoft/vscode/issues/64948
fyi @WardenGnaw @pieandcakes
Version: 1.30.0
Commit: c6e592b2b5770e40a98cb9c2715a8ef89aec3d74
Date: 2018-12-11T22:21:33.585Z
Electron: 2.0.12
Chrome: 61.0.3163.100
Node.js: 8.9.3
V8: 6.1.534.41
OS: Linux x64 4.18.0-3-amd64
Steps to Reproduce:
- Create a C/C++ project.
- Add a debug configuration with GDB.
- Launch with or without debugging.
What happens:
The Debug Console displays:
Stopping due to fatal error: NullReferenceException: Object reference not set to an instance of an object
The program does not start and the external console stays empty.
- I have been able to reproduce this issue on Debian and Ubuntu. (Other platforms unknown.)
- I have only seen this happen with C/C++ debugging. (The only other configuration I have tried is Node.js. Could someone please try other configurations?)
- This began to occur after updating to 1.30.0, although this may be present in prior versions.
The C/C++ Extension must be enabled to use C/C++ debugging.
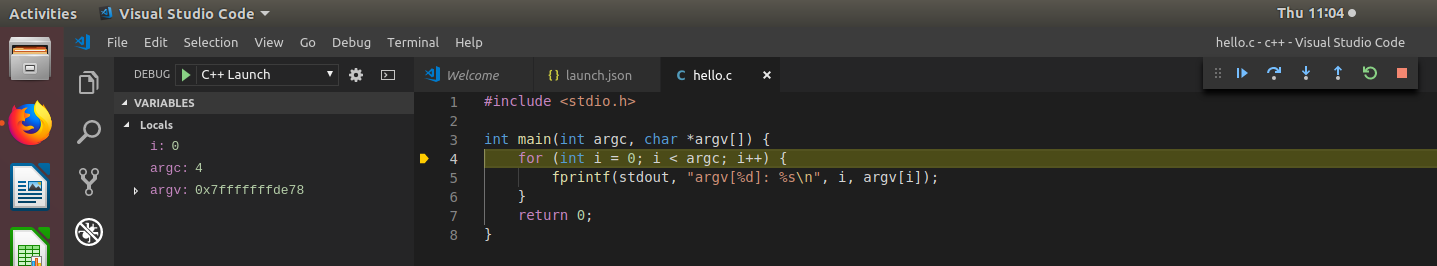
Screenshot:

 isidorn
All 20 comments
I have tried reproducing this and could not. I tried with Ubuntu 16 and Mac OS X.
Here's my sample program and my launch.json
I believe this is an issue with the C++ extension thus I am moving it to the C++ repository.
If it turns out to be an issue with VSCode please let us know and we will look into a candidate fix.
#include <stdio.h>

int main(int argc, char *argv[]) {
    for (int i = 0; i < argc; i++) {
        fprintf(stdout, "argv[%d]: %s\n", i, argv[i]);
    }
    return 0;
}
{
    "version": "0.2.0",
    "configurations": [
        {
            "name": "C++ Launch",
            "type": "cppdbg",
            "request": "launch",
            "program": "${workspaceRoot}/a.out",
            "args": [
                "hello", "world", "!"
            ],
            "stopAtEntry": true,
            "cwd": "${workspaceRoot}",
            "linux": {
                "MIMode": "gdb",
                "miDebuggerPath": "/usr/bin/gdb"
            },
            "osx": {
                "MIMode": "lldb"
            },
            "windows": {
                "MIMode": "gdb",
                "miDebuggerPath": "C:\\MinGw\\bin\\gdb.exe"
            },
            "externalConsole": false
        }
    ]
}
isidorn
on 13 Dec 2018
Workaround: use "externalConsole": false in launch.json
 newfla
on 13 Dec 2018
newfla
on 13 Dec 2018
Yep, a crash deep inside the C++ debug adapter occurs if "externalConsole" is true.
The C++ team needs to investigate why this happens.
 weinand
on 13 Dec 2018
weinand
on 13 Dec 2018
@isidorn @weinand
We already have a fix. https://github.com/Microsoft/vscode-cpptools/issues/2858
The cpptools extension is going to do a release soon and did not expect the VSCode update.
The main issue is that the latest VS Code now sends a RunInTerminalResponse without a responseBody.
 WardenGnaw
on 13 Dec 2018
WardenGnaw
on 13 Dec 2018
@WardenGnaw sending a RunInTerminalResponse without a responseBody is a violation of the spec. Sorry about that.
I have pushed a fix.
I broke that 24 days ago but I wonder why nobody noticed this in Insiders.
weinand
on 13 Dec 2018
@WardenGnaw I just tried the new Insiders (which has my fix for the missing response body), but the cppdbg DA still crashes. So there seems to be another issue...
weinand
on 14 Dec 2018
I can repro this issue now. Investigating.
WardenGnaw
on 14 Dec 2018
@weinand With the latest 1.30.0-insider latest on Ubuntu 18.04 LTS Linux. Commit 456e8e64beb2dceac66743959f6802b66e18e300
I am still getting null responseBody.
I am also noticing another NPE, but this occurs after debugging is shutting down.
WardenGnaw
on 15 Dec 2018
I can confirm I get this issue on Ubuntu 18.04.1 LTS with VS Code 1.30.0, and any version of the C/C++ extension above 0.19.0.
 x6herbius
on 16 Dec 2018
x6herbius
on 16 Dec 2018
Just to clarify, are there fixes in VS Code and the C/C++ Extension yet? If so, where are they?
 jonahcwest
on 16 Dec 2018
jonahcwest
on 16 Dec 2018
@WardenGnaw The latest Insiders is 1.31 and has the commit ID ece3a90fb58986570d8afdfb16530c4dd8c743af.
1.30 is an old Insiders that resulted in 1.30 Stable (which is the build underlying this error report).
So an 1.30 Insiders cannot have a fix for the null responseBody.
@jonahcwest the workaround is to add "externalConsole": false to the launch config.
weinand
on 17 Dec 2018
"externalConsole": true is now working in in the latest insiders.
WardenGnaw
on 18 Dec 2018
I'm having the same error -- Thanks for the "externalConsole": false workaround.

 ktarbet
on 21 Dec 2018
ktarbet
on 21 Dec 2018
我好几天前也遇到了这个问题,然后花了好些时间搞这个,真是日了狗了,然后就发现把"externalConsole"改成VScode的就好了,但是这让我很不舒服!为此我配置了好多次我的task跟launch。哇!我甚至还怀疑是不是我之前弄了一下Qt然后导致的,但是这根本不可能啊。我甚至还重新开了个系统去测试这个东西,然后到头来发现竟然是个官方bug!唉..............
 Suyixiu
on 4 Jan 2019
Suyixiu
on 4 Jan 2019
I have vscode v1.32.1 and cpptools v0.21.0 (both the latest at the moment) installed on osx and windows. On osx I have no issues. On windows I'm getting this "Stopping due to fatal error: NullReferenceException: Object reference not set to an instance of an object" error. externalConsole is set to false in my launch. I don't know if it's related to this issue or not, but I have no idea how to debug it. I assume this fix is in these latest versions, but at least one other person (on this and the others marked as duplicates) say they're still seeing it with 1.32.1.
Should I open a new ticket, or does someone want to give me some pointers on how to try to debug this first?
 wpaul-magicleap
on 12 Mar 2019
wpaul-magicleap
on 12 Mar 2019
@wpaul-magicleap Can you open up a new ticket for VS Code v1.32.1 and C/C++ extension v0.21.0?
Can you also attach engine logging when you create the new ticket?
If you want to debug OpenDebugAD7/MIEngine you can try these steps.
WardenGnaw
on 12 Mar 2019
@wpaul-magicleap Can you open up a new ticket for VS Code v1.32.1 and C/C++ extension v0.21.0?
Can you also attach engine logging when you create the new ticket?
If you want to debug OpenDebugAD7/MIEngine you can try these steps.
Created https://github.com/Microsoft/vscode-cpptools/issues/3282
wpaul-magicleap
on 12 Mar 2019
I was already using externalConsole: false and I've been getting random "exceptions" for a few weeks.
vscode 1.33.1, Ubuntu 18.04.1
{
    // Use IntelliSense to learn about possible attributes.
    // Hover to view descriptions of existing attributes.
    // For more information, visit: https://go.microsoft.com/fwlink/?linkid=830387
    "version": "0.2.0",
    "configurations": [
        {
            "name": "(gdb) Launch",
            "type": "cppdbg",
            "request": "launch",
            "program": "xxx",
            "args": [],
            "stopAtEntry": false,
            "cwd": "${workspaceFolder}",
            "environment": [],
            "externalConsole": false,
            "MIMode": "gdb",
            "setupCommands": [
                {
                    "description": "Enable pretty-printing for gdb",
                    "text": "-enable-pretty-printing",
                    "ignoreFailures": true
                }
            ]
        }
    ]
}
 jflambert
on 12 May 2019
jflambert
on 12 May 2019
I get this exception when trying to click on a frame in the callstack while debugging an attached process.
Stopping due to fatal error: NotImplementedException: No handler implemented for request type 'SourceRequest'!
GNU gdb (Ubuntu 8.1-0ubuntu3) 8.1.0.20180409-git
ms-vscode.cpptools v 0.23.1
Version: 1.35.1
Commit: c7d83e57cd18f18026a8162d042843bda1bcf21f
Date: 2019-06-12T14:27:31.086Z
Electron: 3.1.8
Chrome: 66.0.3359.181
Node.js: 10.2.0
V8: 6.6.346.32
OS: Linux x64 4.18.0-24-generic
 Spongman
on 25 Jun 2019
Spongman
on 25 Jun 2019
@Spongman this is a protocol issue and there is a fix in 0.25.0-insiders for it.
This is issue #3662
 pieandcakes
on 25 Jun 2019
pieandcakes
on 25 Jun 2019
Related issues
 ismadelgad11
·
3Comments
ismadelgad11
·
3Comments
 SkyRiderMike
·
3Comments
SkyRiderMike
·
3Comments
 montery8
·
3Comments
montery8
·
3Comments
 arl
·
3Comments
arl
·
3Comments
 DemoCrazer
·
3Comments
DemoCrazer
·
3Comments
Most helpful comment
Workaround: use "externalConsole": false in launch.json