Vscode-cpptools: VSCode does not allow to add Breakpoint for Cuda code in cpp project
Type: Debugger
Input information below
hi there, I have no problem in adding break-point to cude code in Visual Studio 2017. I could not do it in VSCode (OS: Linux, debugger: gdb). I wonder if there is any easy fix for this issue. Thanks,
Please review existing issues and our documentation at https://github.com/Microsoft/vscode-cpptools/tree/master/Documentation prior to filing an issue.
Describe the bug
- OS and Version:
- VS Code Version:
- C/C++ Extension Version:
- Other extensions you installed (and if the issue persists after disabling them):
- A clear and concise description of what the bug is.
To Reproduce
Please include a code sample and launch.json configuration.
Steps to reproduce the behavior:
- Go to '...'
- Click on '....'
- Scroll down to '....'
- See error
Additional context
If applicable, please include logging by adding "logging": { "engineLogging": true, "trace": true, "traceResponse": true } in your launch.json
Add any other context about the problem here including log or error messages in your Debug Console or Output windows.
 WeiZRPW
All 22 comments
Can you add a log trace with engineLogging enabled to see what is sent when a breakpoint is requested?
Otherwise, can you provide a sample repo with a small project and configuration with steps that allows me to reproduce the failure?
 pieandcakes
on 3 Oct 2018
pieandcakes
on 3 Oct 2018
@pieandcakes
hi, I added engineLogging enabled in the launch.json but I do not know where log trace is located.
So for your convenience, I added a few files below. Because GitHub cannot accept files with extends of .cu, .json etc. I changed all files' extensions to txt. 1.bandwidthTest.txt: change its name to bandwidthTest.cu It is a Nvidia Cuda sample code. 2. Makefile.txt, use it to compile the cuda code. 3. launch.txt: change its name to launch.json, 4. tasks.json: change its name to tasks.json. You can use them to build a project in VSCode. VSCode does not allow me to debug cuda code with these settings. Let me know if you need additional information. Thanks a lot!
WeiZRPW
on 6 Oct 2018
@Iamthegeekdavid When you enable engineLogging in launch.json the log should appear in the debugConsole. Can you tell me what else I need to install to try this out? I don't know much about Cuda or its toolset.
pieandcakes
on 24 Oct 2018
I will check engineLogging and debugconsole you mentioned in your comment later today.
Before I provide a list of tools for CUDA, may I ask what OS you are going to use for solving this issue, Windows or Linux for this issue?
Thanks,
WeiZRPW
on 24 Oct 2018
@Iamthegeekdavid I can do either, depending on where it is easier to repro this problem. I have Windows, Linux (Ubuntu 18.04) and OS X.
pieandcakes
on 24 Oct 2018
@pieandcakes
for the bandwidthTest example, I use cuda-9.2.
You only need this tool to compile bandwidthTest.txt(its original name is bandwidthTest.cu).
You may download cuda9.2 from https://developer.nvidia.com/cuda-92-download-archive?target_os=Linux&target_arch=x86_64&target_distro=Ubuntu&target_version=1604&target_type=deblocal
Installing cuda9.2 is not straightforward on ubuntu system. It could cause the login problem. I followed the following YouTube video to do the installation.
https://www.youtube.com/watch?v=_fj4YISX3bw&t=327s
You have to do the following to blacklist a few things to make it work.
#
$ sudo nano /etc/modprobe.d/blacklist.conf
blacklist amd76x_edac
blacklist vga16fb
blacklist nouveau
blacklist rivafb
blacklist nvidiafb
blacklist rivatv
#
Let me know if you need any additional information.
Good weekend!
WeiZRPW
on 27 Oct 2018
Does this work at all? I don't think gdb can debug cuda code.
Nvidia released a debugger to debug cuda code as its a hardware related: cuda-gdb.
And cuda-gdb is not support by vs code and or the cpptools extension, right?
 NielsonJ
on 9 Dec 2018
NielsonJ
on 9 Dec 2018
@NielsonJ I guess that you are correct. Cuda-gdb is not supported by VSCode while VS2017 (Windows) does support the cud debugging.
WeiZRPW
on 9 Dec 2018
Does VS2017 support CUDA debug through openfolder miengine?
 7wgs0gr04v
on 9 Dec 2018
7wgs0gr04v
on 9 Dec 2018
I have never heard of miengine. FYI: the following printScreen shows a VS2015 session debugging cuda code.
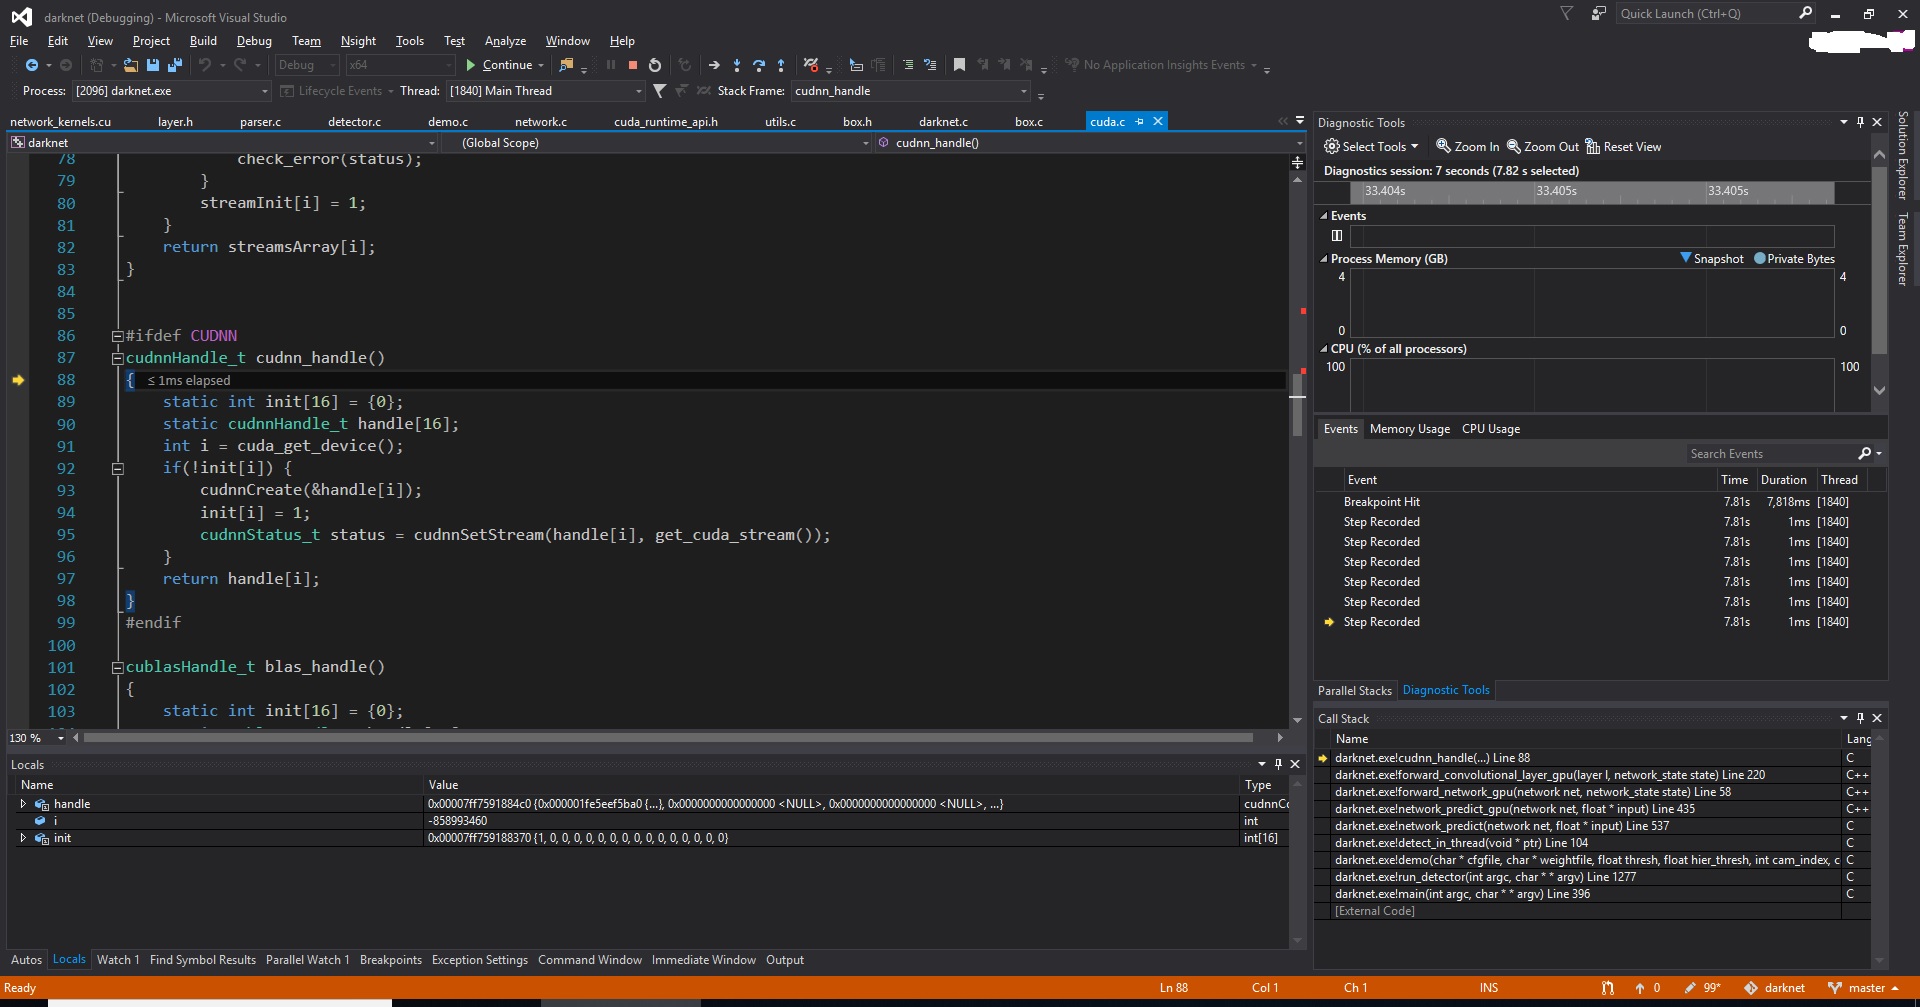
WeiZRPW
on 9 Dec 2018
@Iamthegeekdavid I just did some testing with VS Code on Linux. You are able to use VS Code and gdb to debug ordinary C/C++ code parts within .cu files, it will not however able to debug into device kernels.
You have two options on linux:
- The cuda-gdb CLI tool provide with CUDA toolkit
- Eclipse Nsight, provided by the same CUDA toolkit, this eclipse version has cuda-gdb integrated into the IDE. (pretty much like VS2017 with Nsight support)
It would be nice to see support for cuda-gdb from cpptools/VSCode. But it's probably a too rare of a use case.
NielsonJ
on 10 Dec 2018
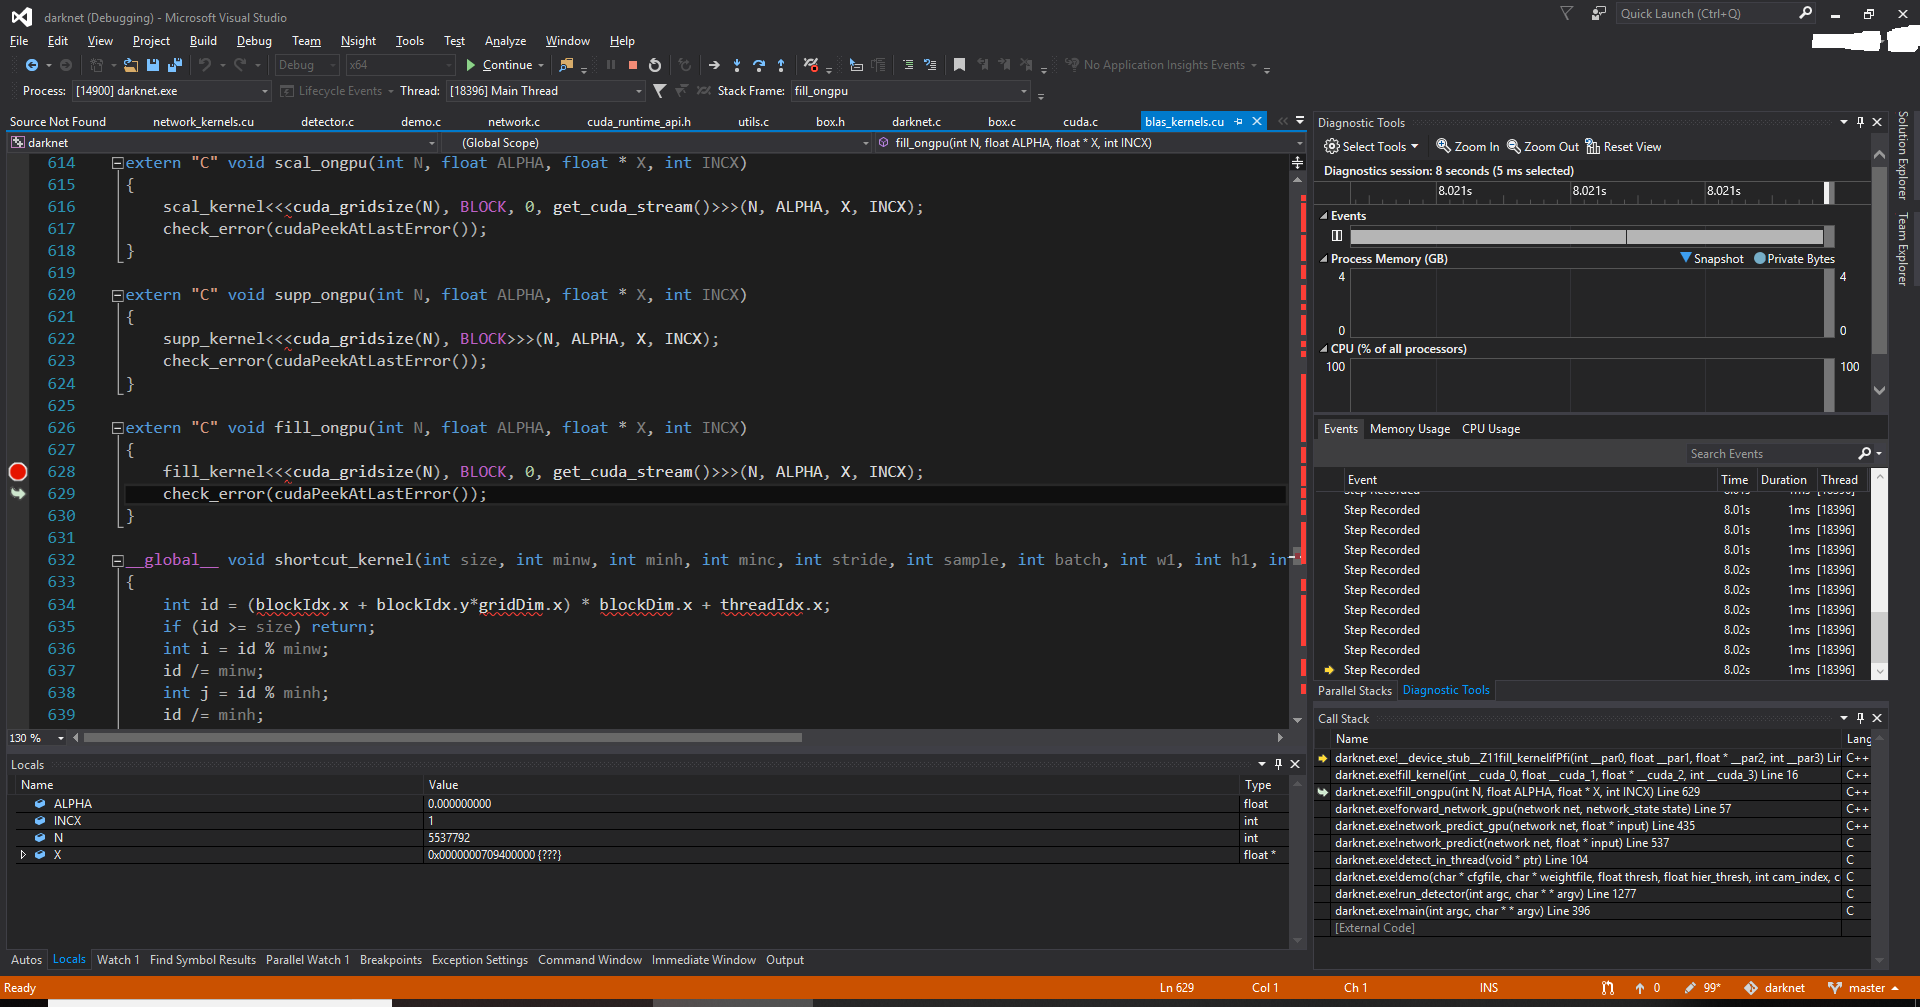
@NielsonJ @pieandcakes @optomux hi all, thank Janne for the suggestions. I used the cuda-gdb to replace gdb in launch.json. Now I can debug .cu files with cuda-gdb. See the following screen shot.
For a lot of deep-learning engineers who uses VSCode on LInux, I guess it is a popular and reasonable request to have cuda-gdb supported in VSCode. Thanks all!

WeiZRPW
on 11 Dec 2018
@Iamthegeekdavid That's very nice, I actually didn't try that yet. I assumed VSCode wouldn't be able to communicate with it and always tried cuda-gdb in the command line. Can it also debug into CUDA kernels? Could you show me your launch.json configuration on Linux?
NielsonJ
on 11 Dec 2018
@NielsonJ Note that MIMODE in my launch.json was set to gdb(not cuda-dgb). I am actually surprised that it works.
My launch file:
#
{
// Use IntelliSense to learn about possible attributes.
// Hover to view descriptions of existing attributes.
// For more information, visit: https://go.microsoft.com/fwlink/?linkid=830387
"version": "0.2.0",
"configurations": [
    {
        "name": "(cuda-gdb) Launch",
        "type": "cppdbg",
        "request": "launch",
        "program": "/home/bigeye/2_dnn/darknet/tree/yolov3/darknet",
        "args": ["detector", "demo", "cfg/coco.data", "cfg/yolov3.cfg", "yolov3.weights", "-c", "0"],
        //"args": ["detector", "test", "cfg/coco.data", "cfg/yolov3.cfg", "yolov3.weights", "-i", "0", "-thresh", "0.25", "data/dog.jpg"],
        "stopAtEntry": false,
        "cwd": "/home/bigeye/2_dnn/darknet/tree/yolov3/",
        "environment": [],
        "externalConsole": true,
        "MIMode": "gdb",
        "setupCommands": [
            {
                "description": "Enable pretty-printing for gdb",
                "text": "-enable-pretty-printing",
                "ignoreFailures": true
            }
        ]
    }
]
}
WeiZRPW
on 12 Dec 2018
@NielsonJ Unluckily, neither Visual Studio nor VSCode on my PC could debug Cuda Kernels. I might need to use some CUDA tool to debug kernel. Do you have any thought on kernel debugging?

WeiZRPW
on 12 Dec 2018
It seems silly that vscode doesn't support cuda-gdb because it is a superset of gdb - i.e. it supports all gdb commands but adds some cuda commands. So it would seem that vscode could easily support cuda-gdb with very minor changes and if you wanted to use cuda-gdb specific commands then you could type them indirectly. I think there must be a sneaky way to do this temporarily by just ln -s cuda-gdb gdb (for instance) - i.e. make vscode think it is calling gdb when it is really calling cuda-gdb. I may look into this this evening.
 davidbien
on 24 May 2019
davidbien
on 24 May 2019
So this is what I did:
which gdb
/usr/bin/gdb
sudo mv /usr/bin/gdb /usr/bin/gdb-backup
sudo ln -s /usr/local/cuda/bin/cuda-gdb /usr/bin/gdb
Then debug the application using "gdb" in the launch.json config. It works quite a bit. I can't set breakpoints by using F9 ( or the menu item "Toggle Breakpoint") but I am currently debugging __device__ methods and am able to set a breakpoint by going to the breakpoints view, clicking "+" and specifying a __device__ method and it will break there.
Almost actually usable - though quite a hack.
davidbien
on 24 May 2019
@davidbien , thanks for your quick suggestion. I will give a try soon. Lots of other work to do recently. ^_^
WeiZRPW
on 24 May 2019
@WeiZRPW @davidbien if the problem is telling us to look for a different executable, you can specify miDebuggerPath in your launch.json and point to the cuda-gdb location instead of copying the file over to /usr/bin/gdb
pieandcakes
on 24 May 2019
Thanks Pierson. I wondered if there were such an option. It doesn’t work well enough for me to want to use it. Using Nsight Eclipse actually works - even if the key bindings are annoying.
davidbien
on 24 May 2019
Unfortunately I don't have experience with CUDA debugging. If you would like to help us improve it, please open another issue and let me know what doesn't work or could work better and I'll work with you to get logs and such to help figure out what is wrong.
pieandcakes
on 24 May 2019
I have a feeling that there is some complex stuff going on for the Nvidia's Nsight Exclipse's integration of cuda-gdb. Apparently there is an interface other than the text interface to gdb? Anyway, it is reasonably opaque to the end user. However and at the same time, when I broke into the debugger I broke into a DEVICE method ( i.e. a GPU method - not a CPU method ) and in VSC I was able to look at the locals, etc. - as I would actually expect. So, there is a large level of functionality currently present due to cuda-gdb being largely a superset of gdb. Teasing out "what's missing" and what paradigm changes might be necessary is difficult - especially because there is apparently no "spec" for CUDA itself and though there is documentation on the extensions present in cuda-gdb, there doesn't seem to be a sufficient specification that would allow integration into a IDE developer. Your enthusiasm to help, however, is totally awesome and much appreciated.
davidbien
on 26 May 2019
Related issues
 jheinzel
·
3Comments
jheinzel
·
3Comments
 timothy
·
3Comments
timothy
·
3Comments
 narutse
·
3Comments
narutse
·
3Comments
 wdc596933938
·
3Comments
wdc596933938
·
3Comments
 ecbrodie
·
3Comments
ecbrodie
·
3Comments
Most helpful comment
@NielsonJ @pieandcakes @optomux hi all, thank Janne for the suggestions. I used the cuda-gdb to replace gdb in launch.json. Now I can debug .cu files with cuda-gdb. See the following screen shot.

For a lot of deep-learning engineers who uses VSCode on LInux, I guess it is a popular and reasonable request to have cuda-gdb supported in VSCode. Thanks all!