Vscode-cpptools: Microsoft.VSCode.CPP.Extension.darwin high CPU usage

Configuration:
- macOS 10.12.6
- VS code 1.22.1
- plugin 0.16.1
DB icon says "Discovering files: xxxx". VS Code console is full of such logs below. Seems it's constantly scanning some Frameworks folders, but why it takes so much resources?
IntelliSense Engine = Tag Parser.
The extension will use the Tag Parser for IntelliSense when #includes don't resolve.
Autocomplete is enabled.
Error squiggles are disabled.
File exclude: **/.git
File exclude: **/.svn
File exclude: **/.hg
File exclude: **/CVS
File exclude: **/.DS_Store
File exclude: **/.vscode
Search exclude: **/node_modules
Search exclude: **/bower_components
Search exclude: **/.vscode
  Folder: xxxxxxxxx will be indexed
  Folder: /usr/local/include/ will be indexed
  Folder: /Applications/Xcode.app/Contents/Developer/Toolchains/XcodeDefault.xctoolchain/usr/lib/clang/9.0.0/include/ will be indexed
  Folder: /Applications/Xcode.app/Contents/Developer/Toolchains/XcodeDefault.xctoolchain/usr/include/ will be indexed
  Folder: /usr/include/ will be indexed
  Folder: /System/Library/Frameworks/ will be indexed
  Folder: /Library/Frameworks/ will be indexed
Discovering files...
.......
/System/Library/Frameworks/AppKit.framework/Versions/C/Resources/he.lproj/Spelling.strings
Unable to add file to database, error = 0x8064000a: /System/Library/Frameworks/AppKit.framework/Versions/C/Resources/he.lproj/TextFinder.strings
Unable to add file to database, error = 0x8064000a: /System/Library/Frameworks/AppKit.framework/Versions/C/Resources/he.lproj/TextSystem.strings
Unable to add file to database, error = 0x8064000a: /System/Library/Frameworks/AppKit.framework/Versions/C/Resources/he.lproj/TextTouchBar-BBBAA77A32-C4EBFEA440.strings
call stack:
sample.txt
 antnsi
All 47 comments
This is generally expected the first time you open a folder. You can reduce the CPU usage by lowering the priority of the indexing. See the "C_Cpp.workspaceParsingPriority" setting. If your config sets the "browse.limitSymbolsToIncludedHeaders" property to true (which is the default), the extension will only stat the files in the folders it has marked for indexing unless they are in your workspace folder or included by some file that is open in the editor.
Some of the Framework folders on Mac can take a while to traverse, so if you're not using any frameworks, you might consider removing them from the macFrameworkPath property in c_cpp_properties.json or scoping the path to only include the folders you care about.
How long does it take you to get past the "Discovering files: xxx" part? There could be something else going on too... The "Discovering files" is supposed to be really fast.
 bobbrow
on 11 Apr 2018
bobbrow
on 11 Apr 2018
@bobbrow thank you for reply! Seems plugin tries to traverse /System/Library/Frameworks and I never finished the process as it takes hours. I have C_Cpp.workspaceParsingPriority: low (it still take 80% cpu load) and browse.limitSymbolsToIncludedHeaders: true.
Finally, I removed all default paths from macFrameworkPath and indeed scan completed in few seconds (basically only headers).
antnsi
on 13 Apr 2018
"low" is supposed to set the background CPU usage to around 25%, so if you're seeing 80%, it could be another thread doing work (if you open a file, another thread will attempt to parse that, causing more CPU usage than the background processing amount). I'm not able to repro the issue (it finishes with 262k files processed using <25% CPU and processes the /System/Library/Frameworks and /Library/Frameworks/). We haven't gotten other complains from other users so maybe there's some special about your setup (I also used 10.12.6, on a very slow Mac), i.e. some particular framework installed with a symbolic link causing an infinite loop? If you set the loggingLevel to "7" you can (slowly) see all the files we search through to see if there's some bug in the "discovering" phase. The 0x806400a error is an e_pending (or SQLITE disk I/O) error...not sure why that's occurring but it shouldn't matter unless it occurs consistently with a file you want symbols to be parsed with. If you could attach a debugger to the high CPU process and provide the call stack of the big threads that might help diagnose this.

 sean-mcmanus
on 14 Apr 2018
sean-mcmanus
on 14 Apr 2018
I've also noticed incredibly high CPU usage even when closing any open instances of VS Code that contain C++ code.
For example, I'll have two VSCode windows open (one for Ruby and one for a C++ project). If I close the C++ project, the CPU usage will still be quite high and I resort to killing the process with SIGTERM.
 LeonineKing1199
on 23 Apr 2018
LeonineKing1199
on 23 Apr 2018
@LeonineKing1199 I don't understand -- what process is using the CPU? Is there a Microsoft.VSCode.Extension process started from the Ruby project or is there a dangling one? VS Code is supposed to kill any dangling extension processes after 5 seconds so I'm not sure what could cause that to not happen.
sean-mcmanus
on 23 Apr 2018
Sorry for not being clear.
I meant that it's a dangling process and it's quite CPU-heavy. I only know it's running because the fans on my MacBook sounds like they're gonna take off into space :P
I'll double-check to see if it persists beyond the 5 second window though.
LeonineKing1199
on 23 Apr 2018
@sean-mcmanus I don't have anything unusual in /System/Library/Frameworks and /Library/Frameworks and I can't reproduce anymore high CPU process, after I excluded default frameworks from scanning. Now it's scans only headers and it takes about second: Discovering files: 3471 file(s) processed.
There is call stack sample.txt in original description of this ticket, is it something you are looking for? If this is not enough, then I can revert frameworks back to scan and investigate case more.
antnsi
on 24 Apr 2018
I end up in the same situation where this process is stuck at consuming 100% cpu and it never quiets down, not even for hours on end. They also have a tendency to dangle if I quit VSCode and then I get multiple processes running at 100% "forever".
Attaching a stack trace of the process.
Sample of Microsoft.VSCode.CPP.Extension.darwin.txt
 danengelbrecht-king
on 23 May 2018
danengelbrecht-king
on 23 May 2018
@danengelbrecht-king Thanks for those logs. I think I know what's going on. It appears to be caused by the new code that looks through the include path recursively...probably not handling cyclic symlinks correctly leading to an infinite loop. Can you confirm that doing an Edit Configuration and removing the "**" from the includePath's fixes the issue (you may need to "reload window" too)?
sean-mcmanus
on 23 May 2018
@danengelbrecht-king Does this repro with 0.17.3? I don't repro any issue with cyclic symlinks so I'm not sure yet how to repro the issue yet. Are you able to repro the issue with some simple project you could share?
sean-mcmanus
on 24 May 2018
@danengelbrecht-king Increasing the loggingLevel to something like the hidden value of "6" or higher might help us track down the cause.
@bobbrow Are you able to identify which method processing is getting stuck in? I assumed it was in parse_includes, but I could be wrong.
sean-mcmanus
on 24 May 2018
@sean-mcmanus I do get it problems with 0.17.3, but I'm unsure what you mean by "Edit Configuration and removing the "**" from the includePath's" - I have "C_Cpp.default.includePath": null and "C_Cpp.default.systemIncludePath": null in my config.
However, after leaving the computer on over the weekend it seem to have stopped consuming lots of CPU (yay!) but on the other hand I have orphaned processes, sometimes they eat a lot of CPU as well, or as in this case just seem to be deadlocked - they remain after exiting Visual Studio Code.
Attaching logs for one orphaned process.
orphaned-process-Microsoft.VSCode.CPP.Extension.darwin.txt
See also screenshot of what is a common occurrence on my machine...
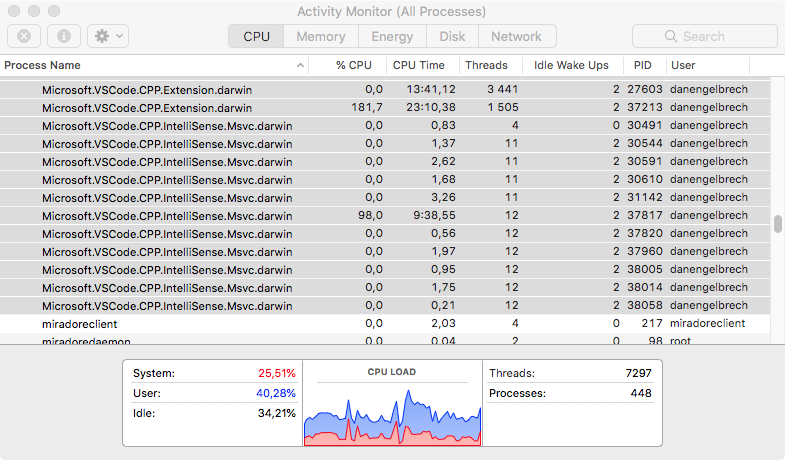
danengelbrecht-king
on 28 May 2018
And here is a screenshot of what it look like after exiting Visual Studio Code...
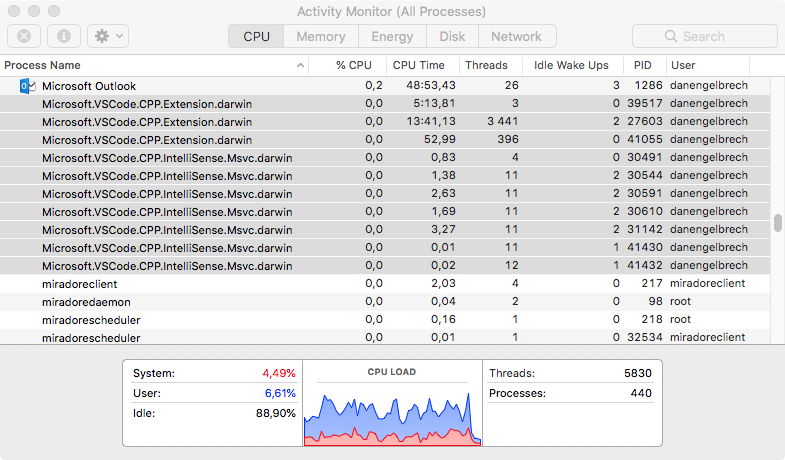
danengelbrecht-king
on 28 May 2018
@danengelbrecht-king Thanks for that call stack. We understand the problem and are looking into a fix...
UPDATE: Actually, we're still not sure how that call stack is possible...maybe some of our pending fixes will address this.
sean-mcmanus
on 29 May 2018


I got same problem these days.
the default C_Cpp.workspaceParsingPriority value is highest and C_Cpp.default.macFrameworkPath value is null
 colorhook
on 31 May 2018
colorhook
on 31 May 2018
@sean-mcmanus I got the same problem. Everything is okie from first seven or eight hour. (I don't remember exactly) After that, the cpu usage increase very high because of this service.
p/s: I working on a customize of https://github.com/rtbkit/rtbkit on mac os. Build this project via docker. I just use vs code to edit and format my code, so don't install all the required lib for this project.
update: I also include a big golang and a small python project also. Hope this help
 hungminhtran
on 31 May 2018
hungminhtran
on 31 May 2018
@colorhook, @hungminhtran, can you try the workaround in #2043 if it applies and let us know if that resolves your issue?
bobbrow
on 31 May 2018
@danengelbrecht-king, @colorhook, @hungminhtran, We released 0.17.4 with a fix for the livelock, so that issue should be resolved now. There are still some performance issues with recursive includes that we are working on, so you might still see some high CPU usage when opening files, but it should eventually catch up. We are going to track performance problems with recursive includes using issue #2068.
bobbrow
on 1 Jun 2018
@bobbrow the workaround not work for me. How to get 0.17.4?
hungminhtran
on 1 Jun 2018
@hungminhtran Just restart Visual Studio Code and there should be un update indicator in the Extensions pane.
danengelbrecht-king
on 1 Jun 2018
@bobbrow 0.17.4 seem to behave much better now! Great work.
danengelbrecht-king
on 1 Jun 2018
@bobbrow I'm still seeing high CPU usage that doesn't seem to subside for quite a while on large repos. Additionally, the process for the extension doesn't consistently terminate when I quite VSCode. It should, shouldn't it?
 kavehv
on 5 Jun 2018
kavehv
on 5 Jun 2018
@kavehv, yes, it should terminate. There is still a bug here that I am working on.
If you see the database icon in the lower right corner of the status bar when your large repo is opened, the extension might be indexing your folder for symbol lookup and goto definition. You can reduce the CPU usage in that case with the "C_Cpp.workspaceParsingPriority" setting. If you have opened multiple source files in the editor, there could be a period of extended CPU usage while the files are being compiled for IntelliSense - the red flame icon should be in the status bar until that work is completed.
bobbrow
on 5 Jun 2018
@bobbrow I just tried that, but the CPU and IO usage is still quite significant. Can anything be done to reduce the amount of disk IO as well? I typically work on a repo that sits on an NFS mount rather than local storage. I'm not sure if you have any best practices you'd recommend for this given your knowledge of the intellisense plugin, but it's been painful at times unless I turn off the extension entirely.
kavehv
on 5 Jun 2018
@kavehv, can you open a new issue with details about your scenario?
- What steps do you take before it starts hogging CPU?
- Set
"C_Cpp.loggingLevel": "Debug"and share it (scrub for personal information before posting to GitHub)
bobbrow
on 5 Jun 2018
I'm not sure what changed, but the low priority setting seems to be behaving better now. Part of the problem was the database was being created in the workspace which was on an NFS mount. I was able to adjust the location to a local drive instead, but is there a way I can set this globally rather than per workspace?
kavehv
on 13 Jun 2018
I've been running into this even more recently (currently on 0.23.1). It's killing the battery on my MBP and consuming enough CPU that it won't charge on its 85W charger when VS Code is open to any C/C++ file in our source tree.
The only steps I take are opening VS code with my project, then switching to a C++ file.
Furthermore, I have tried putting both "C_Cpp.default.macFrameworkPath": [], and "C_Cpp.default.macFrameworkPath": null, (not at the same time) in my settings.json, but the debug output for the C++ extension shows that it still tries to index everything under /Applications/XCode.app. Is there a sane way to make it not index any of this without placing a file in the project itself?
kavehv
on 15 May 2019
I believe the /Applications/XCode.app is being brought in from querying your compiler, so you could set your compilerPath to "" to resolve that. You could also try adding the paths to files.excludes.
I don't know of any changes we've made recently to the tag parsing that would cause CPU usage to increase.
sean-mcmanus
on 15 May 2019
I think a significant part of it seems to be that it has to go through NFS.
Off topic, but I've been trying out the Remote extension that's part of the insiders version of VSCode and it is fantastic. That will probably be my long term solution to this. It indexes our entire codebase in about a minute. I seem to run into issues when there's a decent amount of overhead involved in transacting with the files in a project.
kavehv
on 15 May 2019
Hiya,

Once again seeing high cpu usage recently, must have been the May update. 70% -> 30% battery in about 20 minutes!
Sample of process attached.
sample-process.txt
 jamesadevine
on 25 May 2019
jamesadevine
on 25 May 2019
+1
This process will run for over an hour (granted I have a large project, but this still seems absurd) and will completely drain my battery. Until this issue is resolved, this plug-in will remain disabled. Please let me know if there are any diagnostics that I can provide to help diagnose.
 schutztj
on 26 Jun 2019
schutztj
on 26 Jun 2019
@schutztj You could enable debug logging to see what files are being parsed and if symbols aren't need for those directories you could add them to the files.exclude. You could also attach a debugger and provide a call stack. You could also set the "browse.path" to empty or a smaller subset of the workspace.
sean-mcmanus
on 26 Jun 2019


Microsoft.VSCode.CPP.Extension.darwin eta out my cpu and memory. The size of memory used is even up to 19GB.
My environment is:
mac 10.15.1
vscode 1.40.0
By the way, Frameworks and /Applications/XCode.app have been excluded. However it doesn't seem to work.
"files.exclude": {
        "**/.classpath": true,
        "**/.factorypath": true,
        "**/.project": true,
        "**/.settings": true,
        "**/Frameworks/**": true,
        "/Applications/XCode.app": true
    },
Have there been any progress since the issue was created?
 normal-cock
on 12 Nov 2019
normal-cock
on 12 Nov 2019
Hi @normal-cock . It looks like the original issue in this thread was tracked down to a problem with parsing the frameworks directory. There hasn't been activity on this issue since June. Since excluding Frameworks does not help, I suspect you are seeing a new issue.
What version of the C/C++ Extension are you using? There have recently been some fixes to issues that could cause these symptoms.
Could you capture stacks from the busy process?
Does the issue occur in a simple scenario, or only with a particular project? Since the issue is occurring in the Extension process rather than the IntelliSense process, one possibile cause could be tag parsing, and related to the code being parsed. Those issues can be difficult for us to investigate without code that triggers the repro. If stacks from the busy process point to tag parsing, the next step might be to identify the file it's getting stuck on (if it's always the same file), and try to reduce the code involved to isolate the problem.
 Colengms
on 12 Nov 2019
Colengms
on 12 Nov 2019
Hi @Colengms . Thanks for your quick reply.
The version of my C/C++ Extension is 0.26.1. The issue occur only if I enable the C/C++ extension and open a C/C++ source file.
The sample file has been attached.
“Microsoft.VSCode.CPP.Extension.darwin”的取样.txt
normal-cock
on 14 Nov 2019
Hi @normal-cock . Based on your stacks, the CPU usage is related to tag parsing, and perhaps resolving of recursive includes.
Is this a very large codebase? Tag parsing will parse all of the files in your workspace. If this hasn't been done before, or hasn't been able to complete, it can take quite a while, particularly if there are a lot of files to scan. During this time, it's expected that the extension use 100% of one CPU core (it happens in a single thread).
Do you have a symbolic link somewhere in your include path, that might be creating a loop? Perhaps there is an issue with resolving recursive includes if following that recursion leads to following that symbolic link.
Colengms
on 14 Nov 2019
Yeah, it's stuck enumerating files -- same root issue as https://github.com/microsoft/vscode-cpptools/issues/3123 .
sean-mcmanus
on 15 Nov 2019
I've found the reason of the issue in my condition. In my workspace, there's a Ant-d project which contains a node_modules folder where there are a large number of intermediary files. I've tried to add **/node_modeules in files.exclude so that node_modules would not be scanned. However, file.exclude doesn't work as my expect because of issue as https://github.com/microsoft/vscode-cpptools/issues/3123. So I have to delete node_modules which finally make high CPU and memory usage disappeared.
@Colengms @sean-mcmanus Thanks for your information and hope https://github.com/microsoft/vscode-cpptools/issues/3123 could be worked around finally.
normal-cock
on 17 Nov 2019
I still have the same issue. Microsoft.VSCode.CPP.Extension.darwin utilizes 100% of CPU even with C_Cpp.workspaceParsingPriority set to low.
 ololobus
on 21 Feb 2020
ololobus
on 21 Feb 2020
@ololobus Can you file a new issue with more repro details?
sean-mcmanus
on 21 Feb 2020
@sean-mcmanus I definitely can, but what kind of debug information I could provide? I have tried to attach this lang server process with lldb, but it has no debug symbols. I have found https://msdl.microsoft.com/download/symbols, but it seems to work only on Windows, while I have a problem on macOS
ololobus
on 27 Feb 2020
Our Mac binary should have debug symbols embedded in it and call stacks should be visible. Does it say "no symbols loaded" when you attach with a debugger?
sean-mcmanus
on 28 Feb 2020
@ololobus Are you on Catalina? We're planning to release a fix for Mac debugging on Monday: https://github.com/microsoft/vscode-cpptools/issues/3829 .
sean-mcmanus
on 28 Feb 2020
I am on Catalina, and stacktrace (during 100% load by Microsoft.VSCode.CPP.Extension.darwin) looks like:
Executable module set to "/Users/alexk/.vscode/extensions/ms-vscode.cpptools-0.26.3/bin/Microsoft.VSCode.CPP.Extension.darwin".
Architecture set to: x86_64h-apple-macosx-.
(lldb) bt
* thread #1, queue = 'com.apple.main-thread', stop reason = signal SIGSTOP
  * frame #0: 0x00007fff692a2afe libsystem_kernel.dylib`__read_nocancel + 10
    frame #1: 0x00007fff691ef4aa libsystem_c.dylib`_sread + 16
    frame #2: 0x00007fff691eeb25 libsystem_c.dylib`__srefill1 + 24
    frame #3: 0x00007fff691eec47 libsystem_c.dylib`__srget + 14
    frame #4: 0x00007fff691eae68 libsystem_c.dylib`getc + 52
    frame #5: 0x00007fff6629238f libc++.1.dylib`std::__1::__stdinbuf<char>::__getchar(bool) + 117
    frame #6: 0x000000010ea3f636 Microsoft.VSCode.CPP.Extension.darwin`std::__1::basic_istream<char, std::__1::char_traits<char> >& std::__1::getline<char, std::__1::char_traits<char>, std::__1::allocator<char> >(std::__1::basic_istream<char, std::__1::char_traits<char> >&, std::__1::basic_string<char, std::__1::char_traits<char>, std::__1::allocator<char> >&, char) + 150
    frame #7: 0x000000010ea0bcfb Microsoft.VSCode.CPP.Extension.darwin`vscode::message_handler::main_loop() + 1387
    frame #8: 0x000000010ea0905e Microsoft.VSCode.CPP.Extension.darwin`main + 174
    frame #9: 0x00007fff691607fd libdyld.dylib`start + 1
    frame #10: 0x00007fff691607fd libdyld.dylib`start + 1
(lldb) f 0
frame #0: 0x00007fff692a2afe libsystem_kernel.dylib`__read_nocancel + 10
libsystem_kernel.dylib`__read_nocancel:
->  0x7fff692a2afe <+10>: jae    0x7fff692a2b08            ; <+20>
    0x7fff692a2b00 <+12>: movq   %rax, %rdi
    0x7fff692a2b03 <+15>: jmp    0x7fff692a1a89            ; cerror_nocancel
    0x7fff692a2b08 <+20>: retq
(lldb) f 6
frame #6: 0x000000010ea3f636 Microsoft.VSCode.CPP.Extension.darwin`std::__1::basic_istream<char, std::__1::char_traits<char> >& std::__1::getline<char, std::__1::char_traits<char>, std::__1::allocator<char> >(std::__1::basic_istream<char, std::__1::char_traits<char> >&, std::__1::basic_string<char, std::__1::char_traits<char>, std::__1::allocator<char> >&, char) + 150
Microsoft.VSCode.CPP.Extension.darwin`std::__1::getline<char, std::__1::char_traits<char>, std::__1::allocator<char> >:
->  0x10ea3f636 <+150>: movl   %eax, %ecx
    0x10ea3f638 <+152>: cmpl   $-0x1, %eax
    0x10ea3f63b <+155>: je     0x10ea3f667               ; <+199>
    0x10ea3f63d <+157>: cmpb   %r14b, %cl
It is OK to see ASM instructions for syscalls, but I guess, that for Microsoft.VSCode.CPP.Extension.darwin (frame 6) I should see more details, doesn't it? Probably #3829 will fix the issue.
ololobus
on 28 Feb 2020
You've got the call stack for 1 thread, but that is not the thread that is using CPU. Are you able to get the stack for the thread that is doing work?
Is the CPU used on extension launch even if no C/C++ files are opened? Does the CPU usage started after a file is opened? Does the CPU usage go away after a while? Is there a database or flame icon in the status bar? Does hoveirng over them show any info? Do you see any output occurring when you enable logging: https://code.visualstudio.com/docs/cpp/enable-logging-cpp ?
sean-mcmanus
on 28 Feb 2020
Oh, my bad, I will try to switch threads if the issue occurs next time. It has not came up for a while after setting C_Cpp.workspaceParsingPriority to low and several VSCode/OS restarts.
Is the CPU used on extension launch even if no C/C++ files are opened? Does the CPU usage started after a file is opened?
Not sure, I almost always have C files open, while using VSCode.
Does the CPU usage go away after a while?
Yes.
Is there a database or flame icon in the status bar? Does hoveirng over them show any info?
There is a flame icon with 'Updating IntelliSense...' message.
Do you see any output occurring when you enable logging: https://code.visualstudio.com/docs/cpp/enable-logging-cpp ?
I will try to get more debug info next time, thanks.
ololobus
on 29 Feb 2020
We need more information to fully investigate this issue. If you update to the latest version of the extension and your issue persists, please open a new issue with additional information that can help us investigate your issue.
Thank you!
bobbrow
on 4 Jun 2020
Related issues
 arl
·
3Comments
arl
·
3Comments
 lutianqi
·
3Comments
lutianqi
·
3Comments
 narutse
·
3Comments
narutse
·
3Comments
 DemoCrazer
·
3Comments
DemoCrazer
·
3Comments
 jyavenard
·
3Comments
jyavenard
·
3Comments