Vscode-cpptools: Watching local variables of types vectors, maps etc. is empty when debugging C++ with lldb
- VSCode Version Insiders: March 2018 v1.22
- VSCode Version Stable: February 2018 v1.21
(Same thing happens on both) - OS Version: macOS High Sierra 10.13.3
- C/C++ extension version: 0.16.1
Steps to Reproduce:
// app.cpp
#include <iostream>
#include <vector>
#include <map>
#include <string>

int main() {
    int i = 4;
    std::string s = "four";
    std::vector<int> v;
    std::map<int,std::string> m;
    v.push_back(2);
    v.push_back(1);
    v.push_back(3);
    m.insert(std::make_pair(2,"two"));
    m.insert(std::make_pair(1,"one"));
    m.insert(std::make_pair(3,"three"));
}
// launch.json
{

    "version": "0.2.0",
    "configurations": [
        {
            "name": "(lldb) Launch",
            "type": "cppdbg",
            "request": "launch",
            "program": "${workspaceFolder}/app",
            "args": [],
            "stopAtEntry": false,
            "cwd": "${workspaceFolder}",
            "environment": [],
            "externalConsole": false,
            "MIMode": "lldb"
        }
    ]
}
Built with:
g++ -o app app.cpp -g -Wall -std=c++17 -lstdc++
Watchlist shows this at breakpoint for last statement in main:
i: 4
s: "four"
v: size=0
m: size=0
Using lldb manually from terminal shows correct content of v, and m:
Process 8715 stopped
* thread #1, queue = 'com.apple.main-thread', stop reason = breakpoint 1.1
    frame #0: 0x00000001000018d5 app`main at app.cpp:18
   15           v.push_back(3);
   16           m.insert(std::make_pair(2,"two"));
   17           m.insert(std::make_pair(1,"one"));
-> 18           m.insert(std::make_pair(3,"three"));
   19   }
   20
   21
Target 0: (app) stopped.
(lldb) p m
(std::__1::map<int, std::__1::basic_string<char, std::__1::char_traits<char>, std::__1::allocator<char> >, std::__1::less<int>, std::__1::allocator<std::__1::pair<const int, std::__1::basic_string<char, std::__1::char_traits<char>, std::__1::allocator<char> > > > >) $0 = size=2 {
  [0] = (first = 1, second = "one")
  [1] = (first = 2, second = "two")
}
(lldb) p s
(std::__1::string) $1 = "four"
(lldb) p v
(std::__1::vector<int, std::__1::allocator<int> >) $2 = size=3 {
  [0] = 2
  [1] = 1
  [2] = 3
}
Output console:
Extensions:
waiting for v8 protocol on stdin/stdout
 socuwn
All 86 comments
You're using 0.16.1 of cpptools, right?
 sean-mcmanus
on 2 Apr 2018
sean-mcmanus
on 2 Apr 2018
Yes, sorry. Forgot to include that. Updated info in post
socuwn
on 2 Apr 2018
I hv the same problem --- all the vectors are "size=0" in the "local variables"
 AlbertDu
on 5 Apr 2018
AlbertDu
on 5 Apr 2018
@Lillers hv u fixed that now?
AlbertDu
on 8 Apr 2018
@AlbertDu I have the same problem too, have you fixed?
 ghost
on 19 Apr 2018
ghost
on 19 Apr 2018
@qiLingLingYi I upgrade my VS code, problem remains...
AlbertDu
on 21 Apr 2018
@WardenGnaw Do you know about this?
sean-mcmanus
on 23 Apr 2018
Installing a newer lldb-mi with "brew install llvm --with lldb" fixed it for me. You need to set "miDebuggerPath" in launch.json to "/usr/local/Cellar/llvm/6.0.0/bin/lldb-mi" as well.
I occasionally see #860, but cannot reproduce it in a simple enough example.
 peteralm80
on 23 Apr 2018
peteralm80
on 23 Apr 2018
@sean-mcmanus Yes, this is due to missing pretty printers support in the version of LLDB we ship.
@peteralm80 If you see it hanging, can you enable logging with "logging": { "engineLogging": true } and post the output in #860?
 WardenGnaw
on 23 Apr 2018
WardenGnaw
on 23 Apr 2018
@WardenGnaw That's not really true, it does have some support for pretty printing, but it's not compatible with the version of libcxx that's shipped with at least high sierra.
Not having any pretty printing support would actually be much better than what we have now, then we could at least see the raw fields of the member instead of just "size=0"
peteralm80
on 23 Apr 2018
@WardenGnaw This is most likely the upstream change that you need: https://github.com/llvm-mirror/lldb/commit/0d85f120be4a7b928376ce34c44e2ecfb38d6218#diff-916b2b31f56b35f6e8b6ff6c8ff578da
peteralm80
on 24 Apr 2018
@peteralm80 Sorry, I meant to say we are missing some pretty printing features from the LLDB that we ship. Thank you for showing the commit changes that need to be done in our fork. I'll be working on porting over the changes.
WardenGnaw
on 26 Apr 2018
Does VSC use the system installed lldb (installed by Xcode) or does it install its own? I have /usr/bin/lldb at version lldb-900.0.64 (Xcode 9.2) and I have similar problems as the others.
 ftrofin
on 26 Apr 2018
ftrofin
on 26 Apr 2018
The C++ extension uses its own fork of lldb.
WardenGnaw
on 27 Apr 2018
Would setting "miDebuggerPath": "/usr/local/bin/lldb-mi" work? On my Mac, lldb-mi is a link to Xcode's lldb: /usr/local/bin/lldb-mi -> /Applications/Xcode.app/Contents/Developer/usr/bin/lldb-mi. Are they compatible?
ftrofin
on 27 Apr 2018
I tried that and it seems to work better. I can now see the content of std::strings, vectors and maps:
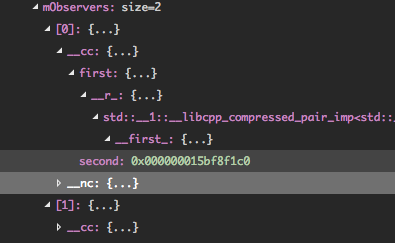
Without the miDebuggerPath setting I was seeing only the first line (mObservers: size=2) and nothing under it when I expanded it. There are two issues though:
- I can't see the content of my types (I have visualizers defined in ~/.lldbinit and ~/lldbsummaries.py that worked in Xcode). Aren't those loaded/used from VSC?
- Using Xcode's lldb seem to make the debugging experience a bit slower (stepping through, hitting breakpoints) and less stable - sometimes the callstack and the variables window are not updated when hitting a breakpoint, etc. Can someone from the VSC team confirm if a different lldb should work with VSC (or if the one that comes with the extension has some incompatible changes)?
ftrofin
on 27 Apr 2018
Is there an ETA for the updated lldb that comes with the extension? The workaround I posted above (setting the miDebuggerPath to the system-installed one) does not work very well (see the issues I mentioned above) The debugging experience is pretty bad when you are not able to see the content of the strings...
ftrofin
on 30 Apr 2018
@ftrofin Sadly, I do not know when we will be able to publish an updated lldb. Due to some previous decisions on how we ship our own version, have not updated it since 2016, and have not ported our necessary changes back to the HEAD of lldb, there is quite a bit of work to fix this.
I apologize for any inconvenience.
WardenGnaw
on 1 May 2018
@WardenGnaw Hi Andrew, thanks for the reply. I understand how it can be difficult to push back changes if you're way behind. How about the other way (refreshing your local lldb branch with the current improvements in lldb)? Or what about setting the "miDebuggerPath" (see above): can we make that work better?
ftrofin
on 2 May 2018
The current plan is to start with the HEAD of lldb, port our changes to it and get those merged into lldb. We will try to get a version of that shipped out of the extension as soon as we accomplish the plan instead of waiting for the PR into lldb to complete and wait for a new lldb to ship.
At the moment, I do not have a workaround for this issue.
However, the future goal would be to not have our own copy of lldb and any visualizing issues would be needed to be addressed in the official lldb repo.
WardenGnaw
on 2 May 2018
Can you confirm or not if your port of lldb that comes with the extension attempts to honor the ~/.lldbinit config file? So I know if I should spend more time trying to tweak it or not...
ftrofin
on 2 May 2018
Sorry, I just saw your response to this in #1902 . For reference: yes, custom formatters can be loaded by the custom lldb that ships with VS Code. See #1902 for how to set it up.
ftrofin
on 2 May 2018
Is there a timeline for this issue's resolution?
From this thread it seems like a large amount of work to fix it, but in the meantime this severely limits the utility of lldb as a debugger and it seems an alternative (gdb?) should be recommended in the meantime if there are no workarounds.
 kettle11
on 4 Jun 2018
kettle11
on 4 Jun 2018
As a painful workaround, there is no need to "brew install lldb...". The lldb that comes with Xcode is good enough. Set miDebuggerPath to /Applications/Xcode.app/Contents/Developer/usr/bin/lldb-mi, I was able to see individual items in a vector. But the debugger takes a minute (not typo, minute, not seconds) or two to step forward to the next line of execution. It also has the ability (or side effect) to step into STL header files.
@WardenGnaw, the ability to look inside containers is very important for debugging. Please prioritize just getting this fixed instead of putting it behind some major refactoring.
 tinlittle
on 6 Jun 2018
tinlittle
on 6 Jun 2018
@kettle11 your proposal of using gdb probably won't fix the issue unless gdb has some sort of visualization to load clang's implementation of the types.
@tinlittle we understand your request and are looking at ways to make a targeted fix without requiring pulling in the entire tree.
 pieandcakes
on 6 Jun 2018
pieandcakes
on 6 Jun 2018
@pieandcakes thank you for the reassurance. And thank you and the team's great work. vscode is now an indispensable tool.
tinlittle
on 7 Jun 2018
@tinlittle Thanks for that tip! It helps a bit, but is pretty flaky. The one time it worked for me, a set that had about 340 elements was displayed as having 60. The other times I spun up the same code, the debugger did not display anything back to the UI. (macOS vs code 1.25.1)
I do urge MS folks (eg. @sean-mcmanus ) to prioritize some kind of fix. Thank you for your great work on Vscode/cpp-tools and your great responsiveness.
 kghose
on 21 Jul 2018
kghose
on 21 Jul 2018
@kghose I don't work on the debugger part or have control over the priority of debugger fixes. @WardenGnaw and @pieandcakes work on the debugger (they're MS folks too).
sean-mcmanus
on 23 Jul 2018
Is there any updates on the fix or should the current workaround with using Xcode's lldb be the temporary fix as described by @ftrofin ? Having the same problem with only seeing type and size = 0.
 ddavidtran
on 26 Aug 2018
ddavidtran
on 26 Aug 2018
Bump, @ddavidtran, no, there doesn't seem to be any movements on this bug.
@WardenGnaw and @pieandcakes, can you give us an indication that this issue is being worked on?
Without the ability of diagnostics when stopped at a breakpoint in VS Code, I am spending more time with Xcode than I would like to.
tinlittle
on 26 Aug 2018
After @WardenGnaw's investigation, it looks like it will take longer than we originally anticipated and other work outside of this extension is currently taking up our time. We have this on our list of tasks to do and hope to revisit it again when we are finished.
pieandcakes
on 29 Aug 2018
I've been debugging with this: https://github.com/vadimcn/vscode-lldb
You can see the contents of vectors, it's fast, and you can specify the bundle rather than the exact executable of the app to debug.
 robclouth
on 27 Sep 2018
robclouth
on 27 Sep 2018
@pieandcakes Is there not something you can take from that other project to speed up the fix?
robclouth
on 27 Sep 2018
@robclouth I think they are using standard lldb whereas we use lldb-mi to use the MI protocol to communicate with lldb.
pieandcakes
on 27 Sep 2018
@robclouth I think they are using standard lldb whereas we use lldb-mi to use the MI protocol to communicate with lldb.
hi, @pieandcakes
is there final(official) solution to this problem ???
I was plaguing all the time
 yaozhongxiao
on 11 Nov 2018
yaozhongxiao
on 11 Nov 2018
@pieandcakes
something new? or something where we can help?
 NoFr1ends
on 13 Nov 2018
NoFr1ends
on 13 Nov 2018
Would setting "miDebuggerPath": "/usr/local/bin/lldb-mi" work? On my Mac, lldb-mi is a link to Xcode's lldb:
/usr/local/bin/lldb-mi -> /Applications/Xcode.app/Contents/Developer/usr/bin/lldb-mi. Are they compatible?
As suggested here, adding this fixed the problem for me.
"miDebuggerPath": "/Applications/Xcode.app/Contents/Developer/usr/bin/lldb-mi"
 ngtrhieu
on 18 Nov 2018
ngtrhieu
on 18 Nov 2018
@NoFr1ends, @yaozhongxiao I think if @ngtrhieu's fix works, then that will be the workaround until we can update to the newest release.
pieandcakes
on 19 Nov 2018
Would setting "miDebuggerPath": "/usr/local/bin/lldb-mi" work? On my Mac, lldb-mi is a link to Xcode's lldb:
/usr/local/bin/lldb-mi -> /Applications/Xcode.app/Contents/Developer/usr/bin/lldb-mi. Are they compatible?As suggested here, adding this fixed the problem for me.
"miDebuggerPath": "/Applications/Xcode.app/Contents/Developer/usr/bin/lldb-mi"
This does not work for me. Once I add the line
"miDebuggerPath": "/Applications/Xcode.app/Contents/Developer/usr/bin/lldb-mi"
the debugger just hangs and cannot launch external console.
@ngtrhieu : can you share your launch.json with me? Mine is like below:
{
            "name": "lldb Debug",
            "type": "cppdbg",
            "request": "launch",
            "program": "${workspaceFolder}/build/main",
            "args": [],
            "stopAtEntry": false,
            "cwd": "${workspaceFolder}",
            "environment": [],
            "externalConsole": true,
            "MIMode": "lldb",
            // "miDebuggerPath": "/Applications/Xcode.app/Contents/Developer/usr/bin/lldb-mi",
            "preLaunchTask": "Debug"
        }
ghost
on 23 Nov 2018
I am under the same problem. After a long time search, I find the answer here. And I use the solution from @ngtrhieu . It works well and finally solve my problem. Thank you.
 shicheng0829
on 1 Dec 2018
shicheng0829
on 1 Dec 2018
Would setting "miDebuggerPath": "/usr/local/bin/lldb-mi" work? On my Mac, lldb-mi is a link to Xcode's lldb:
/usr/local/bin/lldb-mi -> /Applications/Xcode.app/Contents/Developer/usr/bin/lldb-mi. Are they compatible?As suggested here, adding this fixed the problem for me.
"miDebuggerPath": "/Applications/Xcode.app/Contents/Developer/usr/bin/lldb-mi"This does not work for me. Once I add the line
"miDebuggerPath": "/Applications/Xcode.app/Contents/Developer/usr/bin/lldb-mi"
the debugger just hangs and cannot launch external console.
@ngtrhieu : can you share your launch.json with me? Mine is like below:
{ "name": "lldb Debug", "type": "cppdbg", "request": "launch", "program": "${workspaceFolder}/build/main", "args": [], "stopAtEntry": false, "cwd": "${workspaceFolder}", "environment": [], "externalConsole": true, "MIMode": "lldb", // "miDebuggerPath": "/Applications/Xcode.app/Contents/Developer/usr/bin/lldb-mi", "preLaunchTask": "Debug" }
hey, @kyennguyen, i met the same problem, the external console did not launch. Have you fix that?
 RRRaymond
on 19 Dec 2018
RRRaymond
on 19 Dec 2018
@RRRaymond The version of lldb that is shipped with XCode does not include a way to launch the external Terminal, so if you want to use that version, you need to set "externalConsole": false
pieandcakes
on 3 Jan 2019
@pieandcakes
For mine launch.json has default "externalConsole": false The debugger hang after adding "miDebuggerPath": "/Applications/Xcode.app/Contents/Developer/usr/bin/lldb-mi"
 tclu82
on 3 Jan 2019
tclu82
on 3 Jan 2019
I’m now stick with externalConsole: false + Xcode lldb-mi when I debug vector and use another json with externalConsole: true + built-in lldb when debug without vector. Just a workaround until @pieandcakes release a real fix :)
ghost
on 3 Jan 2019
I still have same problem. omg 19 feb
 ChzenChzen
on 19 Feb 2019
ChzenChzen
on 19 Feb 2019
There is another extension which can be used for debugging:
https://marketplace.visualstudio.com/items?itemName=vadimcn.vscode-lldb
I found it to be more capable than the cpptools debugger.
 lmglmg
on 20 Feb 2019
lmglmg
on 20 Feb 2019
There is another extension which can be used for debugging:
https://marketplace.visualstudio.com/items?itemName=vadimcn.vscode-lldb
I found it to be more capable than the cpptools debugger.
it works for me. tks.
 tpqw
on 21 Feb 2019
tpqw
on 21 Feb 2019
There is another extension which can be used for debugging:
https://marketplace.visualstudio.com/items?itemName=vadimcn.vscode-lldb
I found it to be more capable than the cpptools debugger.
it works awesome! thanks!!!!
RRRaymond
on 21 Feb 2019
It is not working for me... I'm still trying to find a way to be able to watch local variables and handle user inputs from a terminal at the same time
 xishec
on 27 Feb 2019
xishec
on 27 Feb 2019
Would setting "miDebuggerPath": "/usr/local/bin/lldb-mi" work? On my Mac, lldb-mi is a link to Xcode's lldb:
/usr/local/bin/lldb-mi -> /Applications/Xcode.app/Contents/Developer/usr/bin/lldb-mi. Are they compatible?As suggested here, adding this fixed the problem for me.
"miDebuggerPath": "/Applications/Xcode.app/Contents/Developer/usr/bin/lldb-mi"
Thanks to you, you can take advantage of STL debug. : D
 seongho-joo
on 24 Mar 2019
seongho-joo
on 24 Mar 2019
It only works for local containers. If a container is passed by reference, it still doesn't show accurately.
In a simple backtracking algorithm that passes integers in vector container, and adds integers.
The vector size is still the same after a couple of recursive calls that pass new values to the vector, which is passed by &.

Here is my launch.json
{
    "version": "0.2.0",
    "configurations": [
        {
            "type": "java",
            "name": "Debug (Java Launch)",
            "request": "launch",
            "mainClass": ""
        },
        {
            "name": "Python: Terminal (external)",
            "type": "python",
            "request": "launch",
            "program": "${file}",
            "console": "externalTerminal"
        },
        {
            "name": "Python: Terminal (integrated)",
            "type": "python",
            "request": "launch",
            "program": "${file}",
            "console": "integratedTerminal"
        },
        {
            "name": "(gdb) C++ Launch",
            "preLaunchTask": "build",
            "type": "cppdbg",
            "request": "launch",
            "args": [],
            "stopAtEntry": true,
            "cwd": "${workspaceRoot}",
            "environment": [],
            "externalConsole": false,
            "setupCommands": [
                {
                    "description": "Enable pretty-printing for gdb",
                    "text": "-enable-pretty-printing",
                    "ignoreFailures": true
                },
                { "text": "handle SIGPIPE nostop noprint pass",
                  "description": "ignore SIGPIPE",
                  "ignoreFailures": true
                }
            ],
            "logging": {
                "engineLogging": false,
                "trace": false
            },
            "windows": {
                "program": "${workspaceFolder}/${relativeFile}.exe",
                "MIMode": "gdb",
                "miDebuggerPath": "D:\\Program Files\\mingw-w64\\x86_64-8.1.0-posix-seh-rt_v6-rev0\\mingw64\\bin\\gdb.exe"
            },
            "linux": {
                "program": "${workspaceRoot}/${fileBasenameNoExtension}.out",
                "MIMode": "gdb"
            },
            "osx": {
                "program": "${workspaceRoot}/${fileBasenameNoExtension}.out",
                "MIMode": "lldb",
                "miDebuggerPath": "/Applications/Xcode.app/Contents/Developer/usr/bin/lldb-mi"
            }
        }
    ]
}
@pieandcakes any comment?
 ismailhkose
on 26 Mar 2019
ismailhkose
on 26 Mar 2019
It is not working for me... I'm still trying to find a way to be able to watch local variables and handle user inputs from a terminal at the same time
I think the lldb plugin mentioned above (https://marketplace.visualstudio.com/items?itemName=vadimcn.vscode-lldb) would satisfy your needs. With it I can watch the local variables including those with types of map or vector. I can also handle user inputs and outputs by setting two key-values "stdio": null, "terminal": "integrated". It will redirect your user i/o to the vscode terminal. You may find more details in the github link of this plugin
 NicholasLao
on 3 Apr 2019
NicholasLao
on 3 Apr 2019
lldb doesn't work on windows with msys64\mingw64.
For crying out loud, all I want to do is to look at a mat4.
 axedaddy
on 5 May 2019
axedaddy
on 5 May 2019
@axedaddy Are you trying to use lldb with mingw? I don't know if that is supposed to work in the first place.
pieandcakes
on 6 May 2019
@pieandcakes (Updated with compiler, and thanks for the help) Hi, I am using VS code on ubuntu 14.04 with lldb. The compiler I use is gcc version 4.8.4 (Ubuntu 4.8.4-2ubuntu1~14.04.4) . As reported by others, I am unable to see contents in maps, sets etc... For vectors as local variable, most of the times I only see 0 as its size under watch, however when I print those vectors, clearly they are not empty. Perhaps there is something wrong with the way I have set up my launch.json file, so I am attaching it below. Any help is appreciated.
"version": "0.2.0",
"configurations": [
{
"name": "(lldb) Launch",
"type": "cppdbg",
"request": "launch",
"preLaunchTask": "build",
"program": "${workspaceFolder}/Decision_Diagram",
"args": [],
"stopAtEntry": true,
"cwd": "${workspaceFolder}",
"MIMode": "lldb",
"miDebuggerPath":"/usr/bin/lldb-mi-3.9.1-3.9",
"setupCommands": [
{
"description": "Enable pretty-printing for lldb",
"text": "-enable-pretty-printing",
"ignoreFailures": true
}
]
}
]
 jmogali
on 9 May 2019
jmogali
on 9 May 2019
I have the same problem. All all the vectors are "size=0" in the "local variables". This problem is still on in May 2019.
lldb version: lldb-1000.11.38.2 Swift-4.2
Mac OS version: 10.14.2
cpptools version: 0.23.0
VS code version: 1.33.1
g++ --version:
Configured with: --prefix=/Applications/Xcode.app/Contents/Developer/usr --with-gxx-include-dir=/usr/include/c++/4.2.1
Apple LLVM version 10.0.0 (clang-1000.11.45.5)
Target: x86_64-apple-darwin18.2.0
Thread model: posix
InstalledDir: /Applications/Xcode.app/Contents/Developer/Toolchains/XcodeDefault.xctoolchain/usr/bin
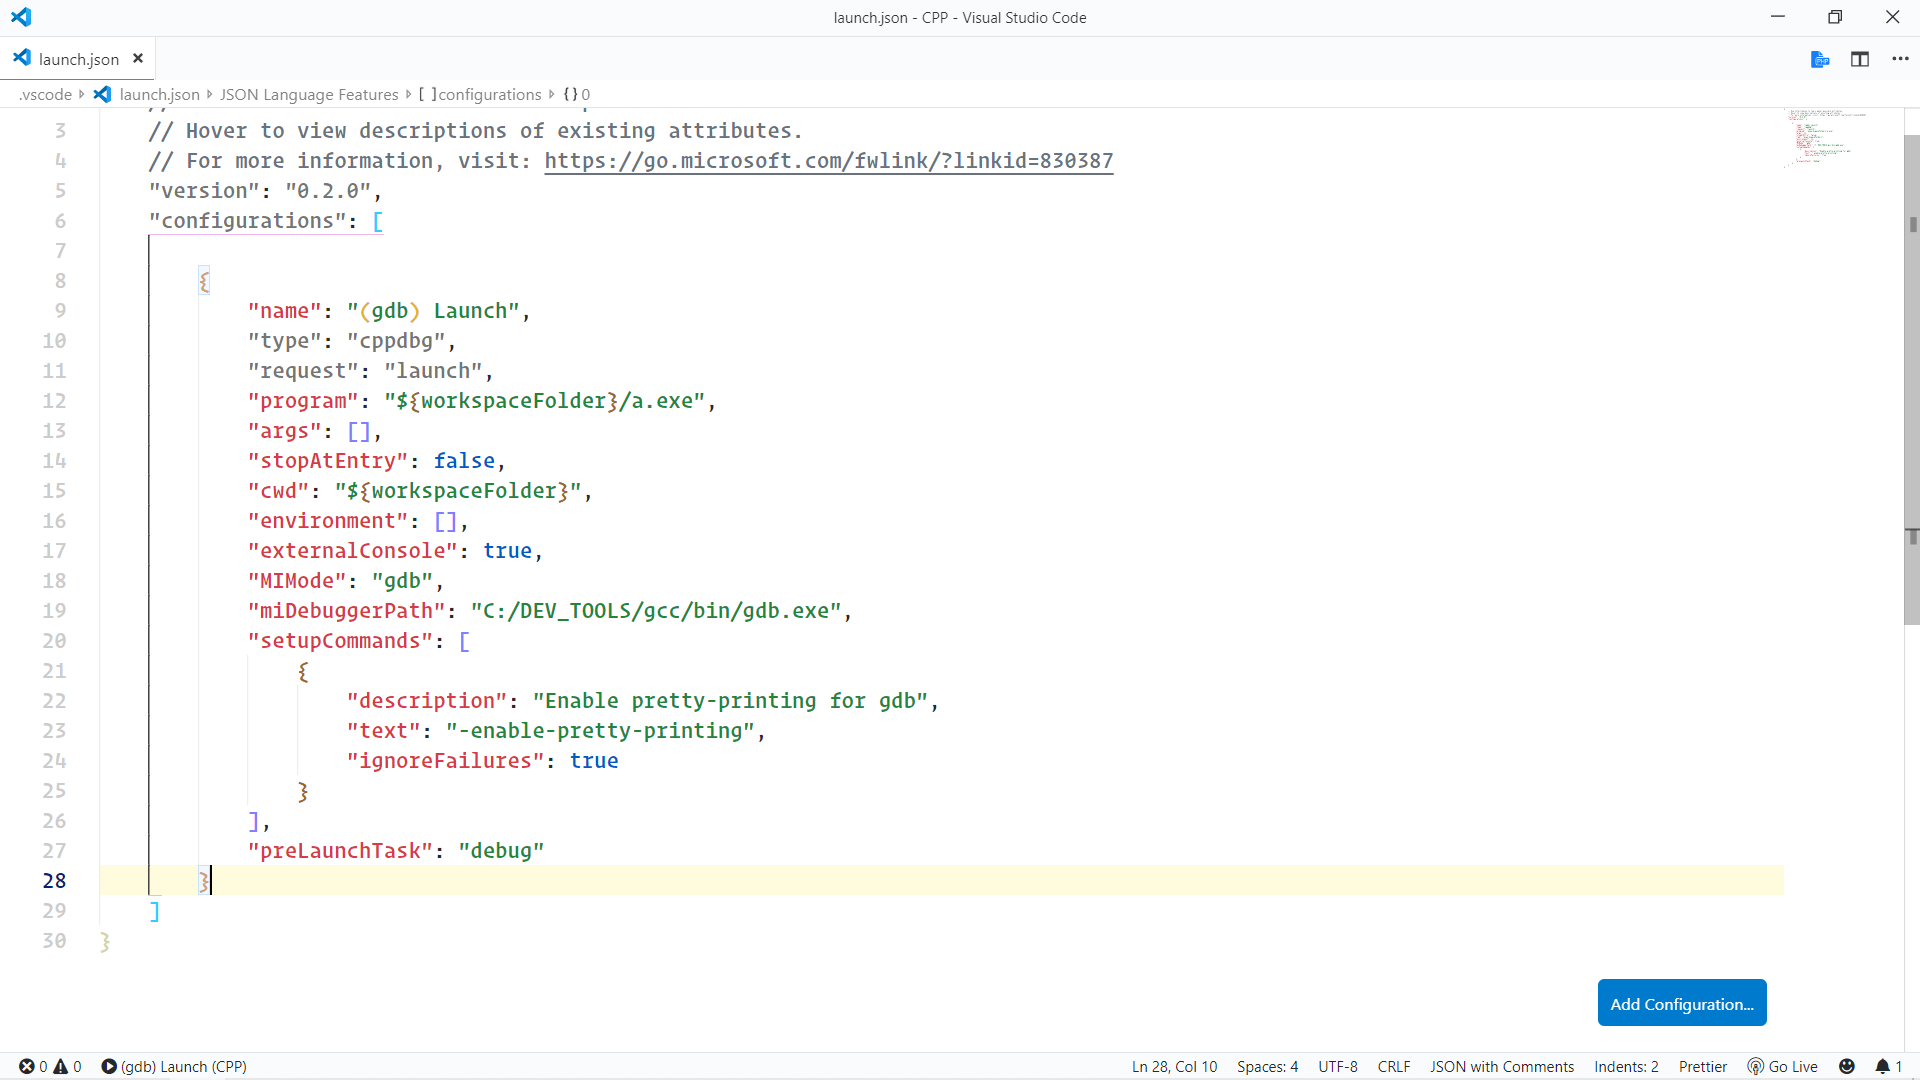
launch.json:
/* launch.json */
{
    "version": "2.0.0",
    "configurations": [
        {
            "name": "C++ Launch",
            "type": "cppdbg",
            "request": "launch",
            "program": "${workspaceRoot}/solution",
            "preLaunchTask": "build",
            "internalConsoleOptions": "openOnSessionStart",
            "logging": {
                "moduleLoad": false,
                "programOutput": true,
                "trace": false
            },
            "showDisplayString": false,
            "args": [],
            "stopAtEntry": false,
            "cwd": "${workspaceRoot}",
            "environment": [],
            "externalConsole": true, // set true to enable keyboard input
            "osx": {
                "MIMode": "lldb"
            }
        }
    ]
}
Reproduce code:
#include <vector>
#include <list>
#include <string>
#include <iostream>
#include <set>
using namespace std;
int main(int argc, char const *argv[])
{
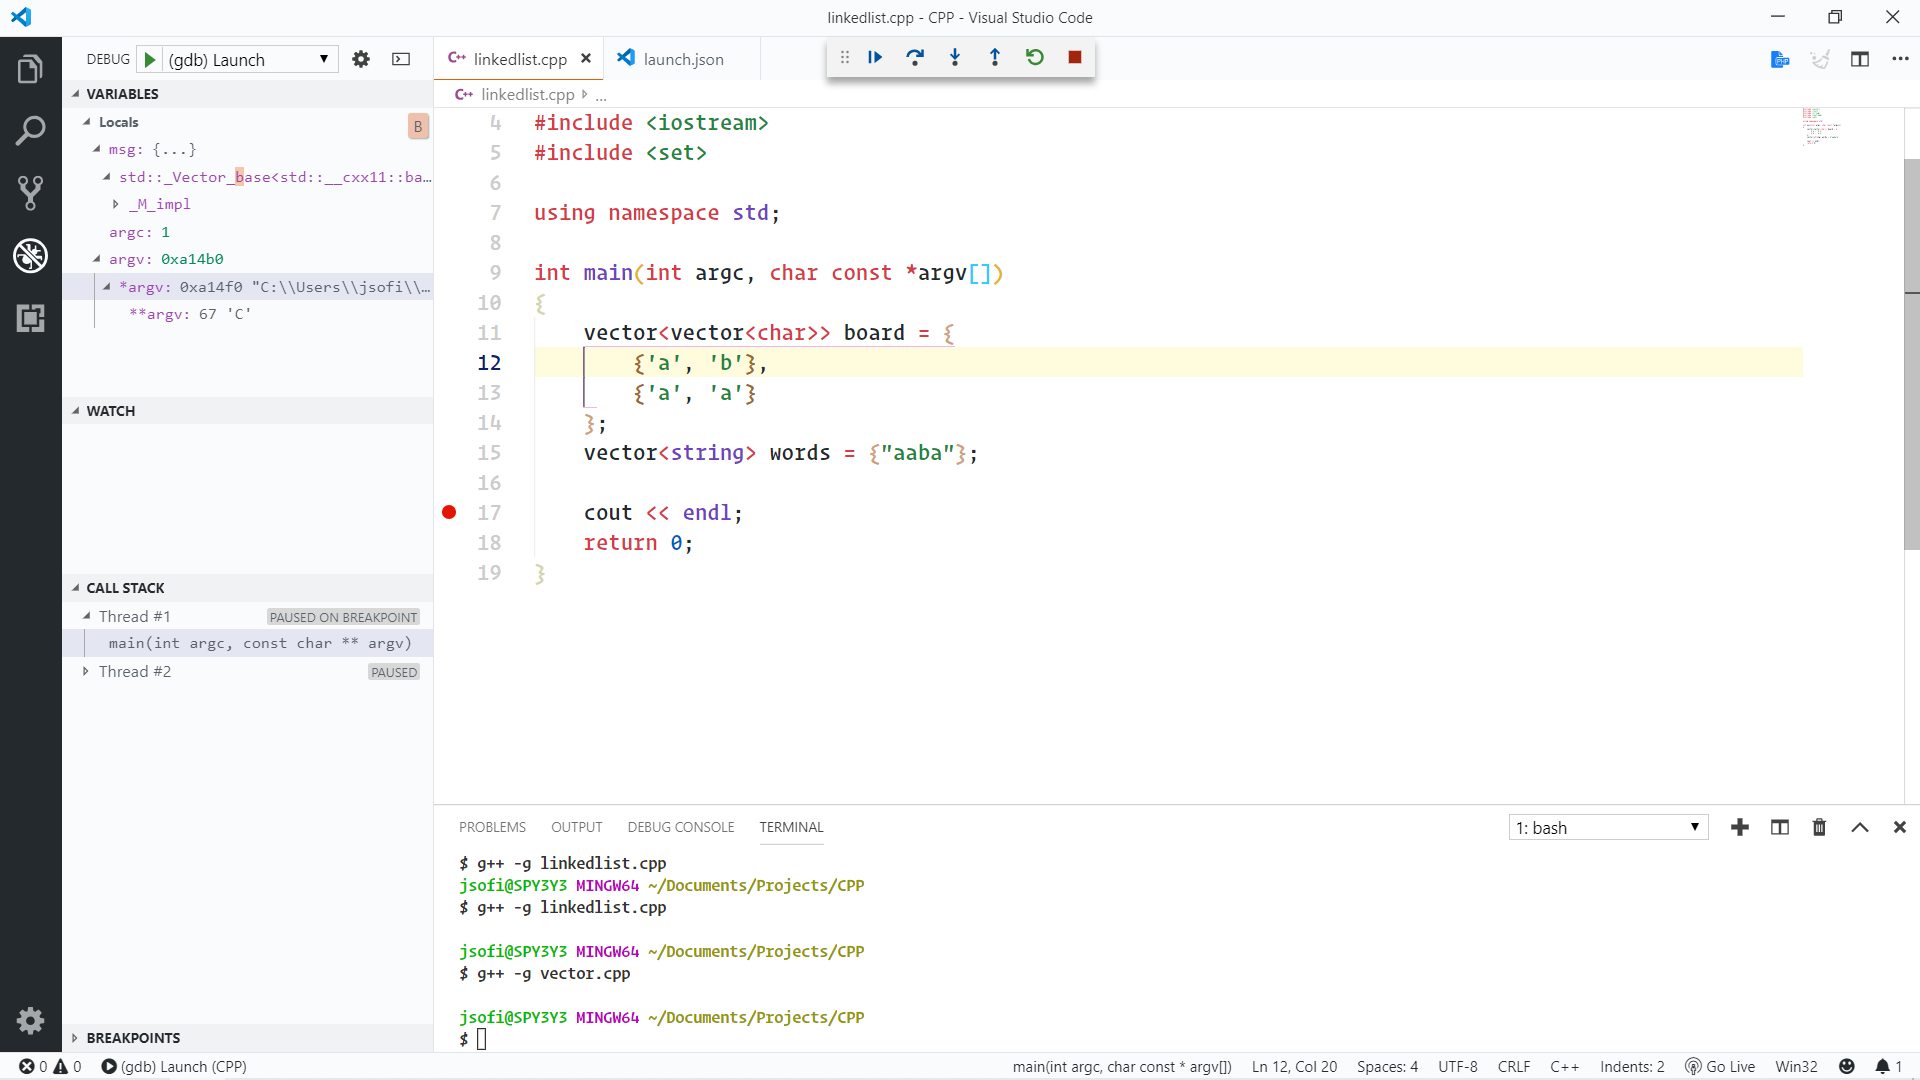
vector<vector<char>> board = {
{'a', 'b'},
{'a', 'a'}
};
vector<string> words = {"aaba"};
cout << endl;
return 0;
}
Screen capture:

There is another extension which can be used for debugging:
https://marketplace.visualstudio.com/items?itemName=vadimcn.vscode-lldb
I found it to be more capable than the cpptools debugger.
This extension works for me!
 YoungForest
on 10 May 2019
YoungForest
on 10 May 2019
For those of you that have issues, please post the version of the compiler you are using also so that we can try and duplicate the issue.
pieandcakes
on 10 May 2019
For those of you that have issues, please post the version of the compiler you are using also so that we can try and duplicate the issue.
lldb version: lldb-1001.0.13.3 - Swift-5.0
Mac OS version: 10.14.4
cpptools version: 0.23.0
VS code version: 1.33.1
g++ --version:
Configured with: --prefix=/Applications/Xcode.app/Contents/Developer/usr --with-gxx-include-dir=/Applications/Xcode.app/Contents/Developer/Platforms/MacOSX.platform/Developer/SDKs/MacOSX10.14.sdk/usr/include/c++/4.2.1
Apple LLVM version 10.0.1 (clang-1001.0.46.4)
Target: x86_64-apple-darwin18.5.0
Thread model: posix
InstalledDir: /Applications/Xcode.app/Contents/Developer/Toolchains/XcodeDefault.xctoolchain/usr/bin
Thanks!
 idfx
on 11 May 2019
idfx
on 11 May 2019
Same issue here!!
cpptools version: 0.23.0
OS version: 10.13.4
VS code version: 1.33.1
Apple LLVM version 9.1.0 (clang-902.0.39.2)
Target: x86_64-apple-darwin17.5.0
Thread model: posix
InstalledDir: /Applications/Xcode.app/Contents/Developer/Toolchains/XcodeDefault.xctoolchain/usr/bin
Following the official tutorial here
The vector msg always show size=0
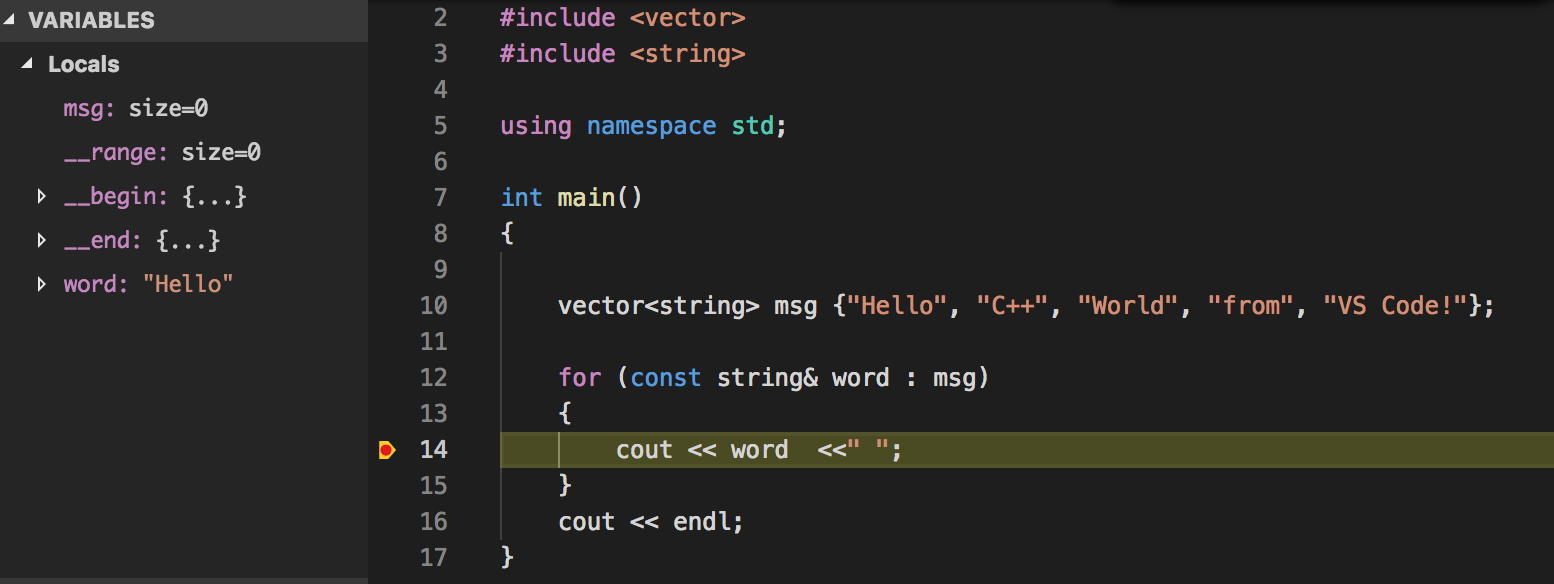
 sincewhenUCLA
on 14 May 2019
sincewhenUCLA
on 14 May 2019
Same problem! Vectors doesn't show its elements.
I'm currently using this task file:
"version": "2.0.0",
"tasks": [
    {
        "label": "echo",
        "type": "shell",
        "command": "g++",
        "args": [
            "-g", "${relativeFile}", "-o", "example"
        ],
        "group": {
            "kind": "build",
            "isDefault": true
        }
    }
]
}
and this launch file:
{
"version": "0.2.0",
"configurations": [
{
"name": "(gdb) Launch",
"type": "cppdbg",
"request": "launch",
"program": "${workspaceFolder}/example.exe",
"args": [],
"stopAtEntry": false,
"cwd": "${workspaceFolder}",
"environment": [],
"externalConsole": true,
"MIMode": "gdb",
"miDebuggerPath": "C:\MinGW\bin\gdb.exe",
"preLaunchTask": "echo",
"setupCommands": [
{
"description": "Enable pretty-printing for gdb",
"text": "-enable-pretty-printing",
"ignoreFailures": true
}
]
}
]
}
Has anybody found any solution for MinGW (windows 10)? Enabling pretty printing didn't help.
Thanks!
 tomas-silveira
on 1 Jul 2019
tomas-silveira
on 1 Jul 2019
@tomas-silveira I can't find the issue now but i remember that users were saying they needed to include a gdb specific python or pretty printing package to enable it in MinGW/Cygwin by default.
pieandcakes
on 1 Jul 2019
@sincewhenUCLA everything is working fine for me
tasks.json
{
// See https://go.microsoft.com/fwlink/?LinkId=733558
// for the documentation about the tasks.json format
"version": "2.0.0",
"tasks": [
{
"type": "shell",
"label": "debug",
"command": "",
"args": [
"g++",
"-g",
"${relativeFile}",
"-o",
"a.exe"
]
},
{
"label": "Compile and run",
"type": "shell",
"command": "",
"args": [
"g++",
"-g",
"${relativeFile}",
"-o",
"${fileBasenameNoExtension}.exe",
"&&" ,
"${fileBasenameNoExtension}.exe"
        ],
        "group": {
            "kind": "build",
            "isDefault": true
        },
        "problemMatcher": {
            "owner": "cpp",
            "fileLocation": [
                "relative",
                "${workspaceRoot}"
            ],
            "pattern": {
                "regexp": "^(.*):(\\d+):(\\d+):\\s+(warning|error):\\s+(.*)$" ,
                "file": 1,
                "line": 2,
                "column": 3,
                "severity": 4,
                "message": 5
            }
        }
    }
]
}
 sofijahangir
on 11 Jul 2019
sofijahangir
on 11 Jul 2019
@johnsofi I think @sincewhenUCLA is using lldb on macOs and not gdb on Windows.
pieandcakes
on 11 Jul 2019
@johnsofi I think @sincewhenUCLA is using
lldbon macOs and notgdbon Windows.
Thanks for Pierson's reply @pieandcakes . Yes, I am using lldb on macOS @johnsofi . I works fine for me when I switched to Ubuntu with gdb.
sincewhenUCLA
on 11 Jul 2019
Same problem here: no string values in debugger/variables window.
OS: Windows 10, VS Code 1.36, g++ 8.2.0, gdb 7.6.1
I got just MinGW from https://osdn.net/projects/mingw/
Should I try another distro with more recent versions, switch to a different OS or abandon any hope for now?
 tdjastrzebski
on 12 Jul 2019
tdjastrzebski
on 12 Jul 2019
@tdjastrzebski Do you see a difference in how it is visualized if you remove the pretty-printer line in your launch.json ?
To add to that, it looks like MinGW ships a separate gdb that has Python enabled as Python is what does the pretty-printing. You may need to point your miDebuggerPath to that. Online searches tells me it should be in the same folder as gdb but called something like gdb-python27.exe.
pieandcakes
on 12 Jul 2019
There is another extension which can be used for debugging:
https://marketplace.visualstudio.com/items?itemName=vadimcn.vscode-lldb
I found it to be more capable than the cpptools debugger.
nice CodeLLDB is work! Thanks
 graykode
on 12 Jul 2019
graykode
on 12 Jul 2019
@pieandcakes Thank you for your help. There is no apparent difference after removing pretty-printer.
This particular MinGW distribution I installed does not contain any other gdb*, besides gdbserver.exe.
The other two distributions I found:
https://sourceforge.net/projects/mingw-w64/
https://mingw-w64.org/doku.php/download
do not install at all or are very difficult to configure - at best.
Please advise.

tdjastrzebski
on 12 Jul 2019
There is another extension which can be used for debugging:
https://marketplace.visualstudio.com/items?itemName=vadimcn.vscode-lldb
I found it to be more capable than the cpptools debugger.nice CodeLLDB is work! Thanks
How did you managed to get it to work? I've tried, but still can't see the elements in a vector (in the debugger). I'm using minGW btw
tomas-silveira
on 12 Jul 2019
@graykode This is as far as I could get with CodeLLDB for now :/
- see the screenshot

tdjastrzebski
on 12 Jul 2019
@graykode This is as far as I could get with CodeLLDB for now with :/
* see the screenshot 
I found that I would hit lots of different points in my code with CodeLLDB, until I realised the C++: on throw was selected by default. I see you've also got it enabled, try without it.
I've been using CodeLLDB for a long time now to get around a lot of the lackings in the cpptools debugging functionality, and have only had the odd problem here and there (stability has been a tiny bit worse in the most recent build, but will hopefully be sorted).
 RobRuckOB
on 12 Jul 2019
RobRuckOB
on 12 Jul 2019
@graykode Do you mean setting "stopOnEntry":true ? I have tried that, no improvement.
tdjastrzebski
on 12 Jul 2019
@RobRuckOB @tdjastrzebski
There are two solutions in Mac OS that i think.
before, tasks.json is same both solutions
// .vscode/tasks.json
{
    // See https://go.microsoft.com/fwlink/?LinkId=733558
    // for the documentation about the tasks.json format
    "version": "2.0.0",
    "tasks": [
        {
            "label": "build_c++",
            "type": "shell",
            "command": "g++",
            "args": [
                "-g",
                "${file}",
                "-o",
                "a.out",
                "&&",
                "./a.out",
                "<",
                "${workspaceFolder}/input.txt",
                ">",
                "${workspaceFolder}/output.txt"
            ],
            "group": {
                "kind": "build",
                "isDefault": true
            },
        }
    ]
}
I prepare coding test then my purpose is 1) it can debug 2) it also input, output redirection when using debugging.
1. using CodeLLDB : Download from https://marketplace.visualstudio.com/items?itemName=vadimcn.vscode-lldb
set launch.json
{
    "version": "0.2.0",
    "configurations": [
        {
            "name": "CodeLLDB",
            "type": "lldb",
            "request": "launch",
            "program": "${workspaceFolder}/a.out",
            "args": [
            ],
        }
    ]
}

its working not show empty vector but it can't redirection input and output with argument
2. using xcode lldb-mi, this is one that i use now.
{
    "version": "0.2.0",
    "configurations": [
        {
            "name": "Launch",
            "type": "cppdbg",
            "request": "launch",
            "program": "${workspaceFolder}/a.out",
            "args": [
            ],
            "stopAtEntry": false,
            "cwd": "${workspaceFolder}",
            "environment": [],
            "externalConsole": false,
            "osx": {
                "program": "${workspaceFolder}/a.out",
                "MIMode": "lldb",
                "miDebuggerPath": "/Applications/Xcode.app/Contents/Developer/usr/bin/lldb-mi"
            },
            "preLaunchTask": "build_c++",
            "setupCommands": [
                {
                    "text": "settings set target.input-path ${workspaceFolder}/input.txt"
                }
            ]
        }
    ]
}

It also can both (show not empty vector, map, input and output redirection)
I hope this solution to be helpful for all.
graykode
on 12 Jul 2019
Also my code in my gist, please visit if you want to see https://gist.github.com/graykode/359abd55b3613176717d0b1238cad77b
graykode
on 12 Jul 2019
@graykode thanks but I am on Windows 10 :/
tdjastrzebski
on 12 Jul 2019
@tomas-silveira @tdjastrzebski This issue is originally for lldb. I've created #3921 for MinGW.
pieandcakes
on 12 Jul 2019
For our group, seeing inside std::vector in vscode using lldb:
- works -
lldb-1000.0.38.2 Swift-4.2("type": "lldb") - _doesn't_ work -
lldb-1001("type": "cppdbg") - _doesn't_ work -
lldb-1100.0.25.3 Apple Swift version 5.1 (swiftlang-1100.0.38.29 clang-1100.0.20.14)("type": "cppdbg") - _doesn't_ work -
lldb-1100.0.25.3 Apple Swift version 5.1 (swiftlang-1100.0.38.29 clang-1100.0.20.14)("type": "lldb")
(works for 1 co-worker, doesn't work for 3 others)
Possible Issue: Compatibility with newer versions of lldb??
Workaround _(OS X)_
thanks @graykode, @ftrofin, @ngtrhieu and others, using xcode's lldb-mi seems to work (as of 20190717), I also hear another workaround may be to brew install an old version of llvm@.
Thank you @pieandcakes for your work! Let us know if you have any questions.
 djohover
on 17 Jul 2019
djohover
on 17 Jul 2019
same problem with gdb in windows
 mumin16
on 1 Sep 2019
mumin16
on 1 Sep 2019
I suspect there is a problem with Visual Studio Code's implementation/interface with C++ debugger extensions because other C++ debugging extensions have also been affected.
djohover
on 4 Sep 2019
I suspect there is a problem with Visual Studio Code's implementation/interface with C++ debugger extensions because other C++ debugging extensions have also been affected.
totaly agree, when i removed 3rd party debugger extension, my problem is solved.
mumin16
on 4 Sep 2019
@mumin16 which one did you remove?
pieandcakes
on 4 Sep 2019
@mumin16 which one did you remove?
Nice question. Actually, I've installed and uninstalled so many extensions. My favorites are codelldb, native debug or maybe the swift toolchains.
mumin16
on 5 Sep 2019
Any updates on this issue?
lldb version:
lldb-1001.0.13.3 - Swift-5.0lldb-1100.0.30.11
Apple Swift version 5.1.3 (swiftlang-1100.0.282.1 clang-1100.0.33.15)
Mac OS version: 10.14.6
cpptools version: 0.26.2
VS code version:
1.41.1
26076a4de974ead31f97692a0d32f90d735645c0
x64
g++ --version:
Configured with: --prefix=/Applications/Xcode.app/Contents/Developer/usr --with-gxx-include-dir=/Library/Developer/CommandLineTools/SDKs/MacOSX.sdk/usr/include/c++/4.2.1
Apple clang version 11.0.0 (clang-1100.0.33.16)
Target: x86_64-apple-darwin18.7.0
Thread model: posix
InstalledDir: /Applications/Xcode.app/Contents/Developer/Toolchains/XcodeDefault.xctoolchain/usr/bin
 A-Mendi
on 18 Jan 2020
A-Mendi
on 18 Jan 2020
How do you install lldb-mi?
This command doesn't work anymore:
brew install llvm --with-lldb
Error: invalid option: --with-lldb
 ourarash
on 6 Feb 2020
ourarash
on 6 Feb 2020
Fixed in our latest Insiders release: https://github.com/microsoft/vscode-cpptools/releases/tag/0.27.0-insiders. But there's a known issue
Pause (break all) doesn't work when debugging on Mac. Workaround: use kill -2 <pid> to trigger the break.
Fixed in our latest Insiders release: https://github.com/microsoft/vscode-cpptools/releases/tag/0.27.0-insiders. But there's a known issue
Pause (break all) doesn't work when debugging on Mac. Workaround: use kill -2 <pid> to trigger the break.
Thank you. It now shows the values of vectors. However, when I 'Step Over', the debugger quits unexpectedly:
Execute debugger commands using "-exec
", for example "-exec info registers" will list registers in use (when GDB is the debugger)
ERROR: LLDB exited unexpectedly with exit code 137 (0x89).
ERROR: LLDB exited unexpectedly with exit code 137 (0x89). Debugging will now abort.
The program '/Users/XXXXXXXXX/cpp/test' has exited with code -1 (0xffffffff).
Strangely, when I click "Step Into", no error occurs. If I set multiple break point, I can safely jump from break point to break point clicking "Continue". Kind of does what I need, but it would be great if it's fixed completely.
 RomanKoshkin
on 13 Apr 2020
RomanKoshkin
on 13 Apr 2020
Related issues
 arl
·
3Comments
arl
·
3Comments
 DemoCrazer
·
3Comments
DemoCrazer
·
3Comments
 vicatcu
·
3Comments
vicatcu
·
3Comments
 timothy
·
3Comments
timothy
·
3Comments
 peterwoods1
·
3Comments
peterwoods1
·
3Comments
Most helpful comment
I hv the same problem --- all the vectors are "size=0" in the "local variables"