Vscode-cpptools: Debug inside WSL
Problem
Since it is now possible to launch VS Code from within WSL starting from Insider build 17063, I wanted to try side-by-side debugging, but for some reason VS Code cannot debug inside WSL. When I start to debug a Hello World application, this is what shows inside the debug output pane:
=thread-group-added,id="i1"
GNU gdb (Ubuntu 7.11.1-0ubuntu1~16.5) 7.11.1
Copyright (C) 2016 Free Software Foundation, Inc.
License GPLv3+: GNU GPL version 3 or later <http://gnu.org/licenses/gpl.html>
This is free software: you are free to change and redistribute it.
There is NO WARRANTY, to the extent permitted by law.  Type "show copying"
and "show warranty" for details.
This GDB was configured as "x86_64-linux-gnu".
Type "show configuration" for configuration details.
For bug reporting instructions, please see:
<http://www.gnu.org/software/gdb/bugs/>.
Find the GDB manual and other documentation resources online at:
<http://www.gnu.org/software/gdb/documentation/>.
For help, type "help".
Type "apropos word" to search for commands related to "word".
=cmd-param-changed,param="pagination",value="off"
ERROR: Unable to start debugging. Unexpected GDB output from command "-exec-run". During startup program exited normally.
The program '/mnt/c/Users/nagy-/Source/MinimalCpp14/.vscode/build/Debug/MinimalCpp14' has exited with code 0 (0x00000000).
Am I doing something wrong?
 MathiasMagnus
All 25 comments
Can you share your launch.json? Are you setting this up exactly like debugging locally on Linux?
You can also get more information from what gdb is returning by enabling logging "logging": { "engineLogging": true } and seeing what -exec-run is returning unexpectedly
 pieandcakes
on 5 Jan 2018
pieandcakes
on 5 Jan 2018
This is the debug console output after logging being enabled: (omitting previous messages)
1: (975) <-1010-exec-run
1: (978) ->=thread-group-started,id="i1",pid="975"
1: (978) ->=thread-created,id="1",group-id="i1"
1: (978) ->=thread-group-exited,id="i1"
1: (979) ->1010^error,msg="During startup program exited normally."
1: (979) ->(gdb)
1: (983) <-1011-thread-info 1
1: (983) ->1011^done,threads=[]
1: (983) ->(gdb)
1: (986) 1010: elapsed time 11
1: (991) 1011: elapsed time 7
1: (994) <--gdb-exit
1: (994) ->^exit
ERROR: Unable to start debugging. Unexpected GDB output from command "-exec-run". During startup program exited normally.
The program '/mnt/c/Users/nagy-/Source/MinimalCpp14/.vscode/build/Debug/MinimalCpp14' has exited with code 0 (0x00000000)
The example is no black magic.
Main.cpp
#include <iostream>
#include <functional>
int main()
{
[console = std::ref(std::cout)]()
{
console.get() <<
"Hello, generic lambda capture!" <<
std::endl;
}();
return 0;
}
CMakeLists.txt
cmake_minimum_required(VERSION 3.5)
project(MinimalCpp14 LANGUAGES CXX)
add_executable(${PROJECT_NAME} Main.cpp)
set_target_properties(${PROJECT_NAME} PROPERTIES
CXX_STANDARD 14
CXX_STANDARD_REQUIRED ON
CXX_EXTENSIONS OFF)
lanch.json
{
"version": "0.2.0",
"configurations": [
{
"name": "MinimalCpp14",
"type": "cppdbg",
"request": "launch",
"program": "${workspaceFolder}/.vscode/build/Debug/MinimalCpp14",
"args": [],
"stopAtEntry": false,
"cwd": "${workspaceFolder}",
"environment": [],
"externalConsole": true,
"MIMode": "gdb",
"setupCommands": [
{
"description": "Enable pretty-printing for gdb",
"text": "-enable-pretty-printing",
"ignoreFailures": true
}
],
"logging": {
"engineLogging": true,
"trace": false
}
}
]
}
settings.json
{
"cmake.buildDirectory": "${workspaceRoot}/.vscode/build/${buildType}"
}
As far as I know this should be working. The source files are located on my NTFS drive, as the /mnt/c/... path of the executable suggests.
MathiasMagnus
on 6 Jan 2018
Top
- Ubuntu Server 16.04
- VS Code 1.19.1
- CMake Tools 0.11.0-beta4
- C/C++ 0.14.5
- GCC 7.2.0

Bottom
- Ubuntu (WSL) 16.04
- VS Code 1.19.1
- CMake Tools 0.11.0-beta4
- C/C++ 0.14.5
- GCC 7.2.0
It cannot be anymore identical I believe. The only difference is that one is a native Ubuntu connected to via SSH and the other is running from WSL without SSH.
Host
- Windows 10 (Insider build 17063)
- VcXsrv 1.19.3.1
MathiasMagnus
on 8 Jan 2018
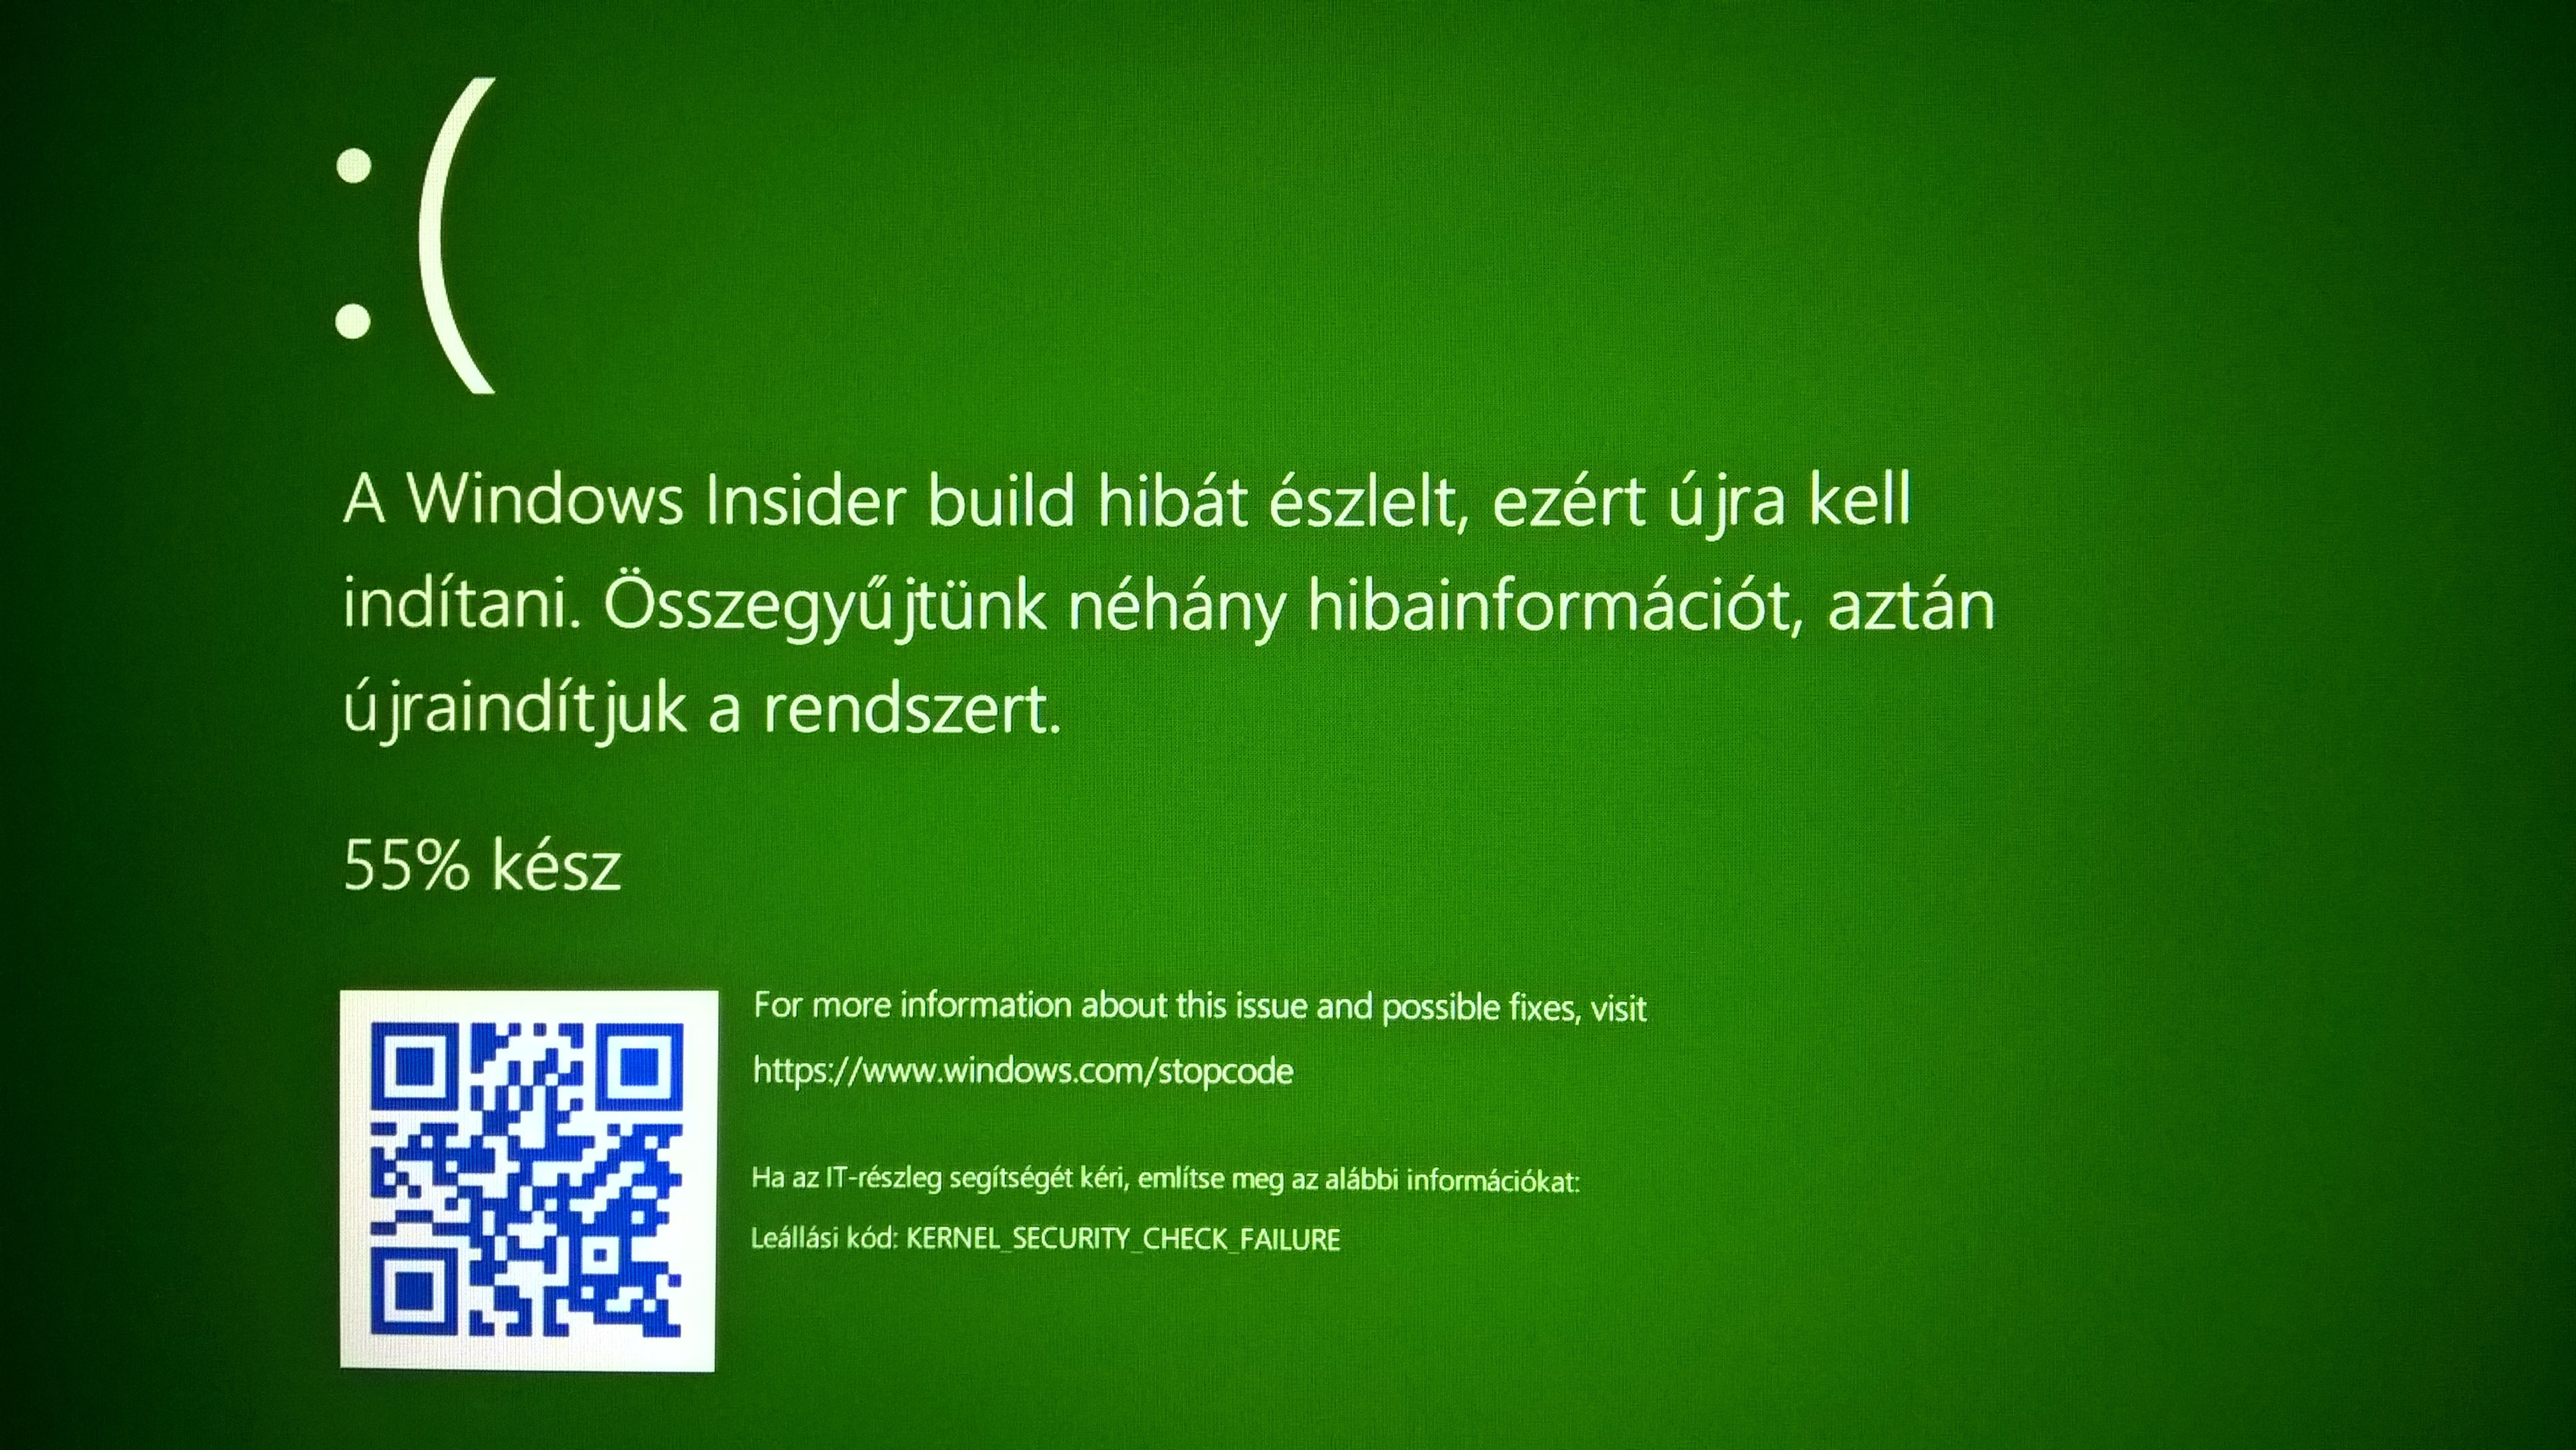
@bitcrazed As a sidenote, while I was trying to put together the environment of VS Code in WSL, I got about 3 _Green Screen of Deaths_ in roughly 20-30 minutes of experimenting. KERNEL_SECURITY_CHECK_FAILURE
Should one expect WSL folks to dig into crash dumps created while using VS Code in WSL? Is there any group within MS that might potentially provide a repro to catch in a debugger?
_Sidenote of sidenote: still waiting for the GPGPU in WSL blog post, hopefully mentioning Khronos tech as well, not just propriatary CUDA._
MathiasMagnus
on 8 Jan 2018
@MathiasMagnus I don't know if VSCode has done any testing to support itself inside WSL or if they have been working with the WSL team to resolve this.
Your example above looks like it doesn't have symbols so it isn't stopping. Can you make sure you are compiling with Debug symbols (compiler flag -g) and try again?
We are getting a gdb error when we try and run the debuggee of:
1: (979) ->1010^error,msg="During startup program exited normally."
pieandcakes
on 11 Jan 2018
@MathiasMagnus HIGHLY unlikely that these security checks were due to WSL, though if you can repro after update to most recent build , please file an issue on the WSL repo with as much info and repro steps as possible.
As we've stated previously, we're looking at GPU access, but it's a really tough nut to crack that will take engineering from Microsoft and partners, so please bear with us for now.
 bitcrazed
on 11 Jan 2018
bitcrazed
on 11 Jan 2018
Hey @Tyriar - any chance you could take a look at this issue please? :)
bitcrazed
on 11 Jan 2018
I was under the impression that debugging simply does not work under WSL/git bash currently https://github.com/Microsoft/vscode/issues/30592
 Tyriar
on 12 Jan 2018
Tyriar
on 12 Jan 2018
@Tyriar Is that true if I install VSCode for Ubuntu on WSL also? I'm just asking but I haven't tried it yet as I am not running the insiders Windows build
pieandcakes
on 12 Jan 2018
I don't think it's related to the issue you linked. Ubuntu inside WSL (the native VS Code I'm talking about) should have no knowledge about being inside WSL, and hence the path formats should not cause an issue on any level. Am I missing something?
MathiasMagnus
on 12 Jan 2018
@pieandcakes we don't support running the Linux binaries on WSL.
Tyriar
on 13 Jan 2018
@Tyriar Not (officially) supporting is one thing (means that the issue can be closed at will) and not wanting to support is another. The prior means users looking for it might have to wait arbitrarily long, and the latter means waiting for forever.
VS Code under WSL was one of the most trending issues, so there must be value to it.
MathiasMagnus
on 13 Jan 2018
@MathiasMagnus I believe the team behind WSL does not recommend embracing launching Linux GUI apps, @bitcrazed can correct me if I'm wrong (this may be old information?). Where we (the vscode team) do want to improve support eventually is in the launching of WSL-based tooling from within the Windows GUI.
Tyriar
on 15 Jan 2018
Context
I am a long time VS user (not Code), but have kept VS Code as a secondary editor around since the first version of the C++ ext and have followed along C++ dev capabilities in tandem with CMake. As an academic HPC/GPGPU dev (also teaching), my main dev platform has always been Windows and using only portable SW to target Linux clusters. (ISO C++XY, OpenCL/SYCL, OpenGL/Vulkan, MPI, OpenMP, OpenCL-GL interop, etc.) I frequently port Linux-only SW from Linux to Windows (mostly analysis SW) so the new trend around VS (& Code) is a dream come true for me for 2 reasons:
- Developing (my stuff) natively in Windows and testing inside WSL before deployment. Currently I use OpenCL CPU runtimes and OpenGL SW rasterizers for testing. It works, but has its limits.
- When porting (students and other stuff), running the original Linux binary and the Windows port side-by-side. I have not revisited big brother VS debug inside WSL without copying sources on every build, but might do shortly.
A colleague of mine even cooked up a minimal editor (fast start times) that does just what big VS achieved in version 15.6 preview 2: squigglies from multiple CMake configurations at once. Although I have lived 2 months now without big VS (I almost sound like a drug addict), this feature might cause me to gravitate back to using it. It would rock if xplat conformance tests need not involve web technologies like Compiler Explorer, but one could just as quickly pop open the same feature set locally. (One editor, squigglies from 1-2-3-4 compilers, and perhaps their assembly output)
GUI
I believe running GUI apps from within WSL is discouraged/unsupported is to maintain the freedom of allocating as many resources to making it work as seen fit. There is still console work to be done and once those are finished, I'd expect more GUI work be done. A wild guess is that once the tough nut of GPGPU is cracked, that might also open up the way to proper graphics acceleration. A 1st party Wayland and/or XServer implementation could mean graphics acceleration of WSL binaries as Windows windows. (But yeah, first compute only.) But yeah, I would like to know the official state of GUI efforts within WSL.
Console
I am fine with Windows binaries calling the WSL tools and tunneling their results into the debugger as long as it works. However, getting stuff like multi-squiggly support to work requires MUCH more work and collaboration with @vector-of-bool to make it work, even inside WSL with the Windows binary. His bug refactor of his extension really payed off, Kits support is awesome, variants also very useful... however they alone do not enable targeting Windows-Linux both from within a Windows instance of VS Code. Perhaps if there were an orthogonal option to Kits specifying remote execution of builds. Something like:
{
"name": "My Compiler Kit",
"compilers": {
"C": "/usr/bin/gcc",
"CXX": "/usr/bin/g++",
"Fortran": "/usr/bin/gfortran"
},
"machine": {
"address": "127.0.0.1",
"port": 2222,
"key": "C:/Users/username/.ssh/id_rsa"
}
}
_(The same addition should be working for toolchain and VS Kits.)_
Now that Windows has out-of-the-box support for SSH servers, the very same could work in reverse direction, kicking off MSVC builds on a remote Windows node from a Linux VS Code binary. (Windows folk would have less porting work to do if Linux devs interested in making their apps work on Windows could do their homework more easily. Just have a Windows VM running or have Wine installed.) If the Visual C++ debugger has a server mode for remote debugging, the Linux UI could also light up with the proper symbols loaded.
MathiasMagnus
on 15 Jan 2018
@MathiasMagnus thanks for your thoughts on this, but @Tyriar is correct: WSL currently has no plans to support X/GUI apps: we're focusing all our efforts on fixing WSL's myriad fundamental compat & performance issues.
Also, while some advocate running VSCode for Linux atop WSL, that's most often either a) a religious/philosophical preference, or b) a desire to work on/with files stored in the Linux filesystem. The former we cannot solve with technology, the latter we can, and are actively exploring:
If we can expose your distro's filesystems to Windows in an interoperable manner, you'll be able to work on/with your files stored in the Linux via Windows apps & tools so will have fewer reasons to run VSCode for Linux … assuming that @Tyriar & team will be able to fix-up WSL debugging too ;)
cc/ @tara-raj
bitcrazed
on 16 Jan 2018
Although I believe there is still value in being able run arbitrary X/Wayland/XWayland app from WSL, as far as this issue stands, it really doesn't matter which VS Code binary has WSL debugging capabilities. The Linux binary doesn't need any remoting, so it seemed to be an easier fix once the window shows. It is slightly more effort to have the Windows binary kick off both build via CMake Tools and the debugger to be able to tunnel the symbols over the wire. But hey, if it works... especially now that the CMake Servers lifespan need not be bound to a terminal, thanks to the work done by the WSL folks.
Shall I open a new issue for remote build/debug here and perhaps on the CMake Tools repo to clarify and make a platform for the joint effort?
MathiasMagnus
on 17 Jan 2018
@MathiasMagnus We (the C/C++ extension) support remote debugging today through the use of the bash.exe executable to do remoting. Instructions can be found here. If you have suggestions for improvements let us know.
We don't provide any additional building support beyond what task.json supports. The task.json system is owned by the VS Code team and not by us.
pieandcakes
on 17 Jan 2018
@MathiasMagnus
ERROR: Unable to start debugging. Unexpected GDB output from command "-exec-run". During startup program exited normally.
I am going to say this is Microsoft/WSL#2870. gdb causes the debugee to "exit normally" from the command line on 17063/17074 as well. Work-around is to not disable (ie retain) ASLR behaviour (set disable-randomization off).
 therealkenc
on 23 Jan 2018
therealkenc
on 23 Jan 2018
Can confirm that is the problem. In launch.json:
            .....blah blah blah
            "externalConsole": true,
            "MIMode": "gdb",
            "setupCommands": [
                {
                    "description": "Enable pretty-printing for gdb",
                    "text": "-enable-pretty-printing",
                    "ignoreFailures": true
                },
                {
                    "description": "Do not disable ASLR for WSL",
                    "text": "set disable-randomization off",
                    "ignoreFailures": true
                },
            ]

therealkenc
on 23 Jan 2018
@therealkenc thanks for figuring it out. I'll add it to the documentation for WSL
pieandcakes
on 23 Jan 2018
I'll add it to the documentation for WSL
Can do. But note it is probably a very small window. gdb broke in 17063, which just happened _entirely coincidentally_ to be the release that VS Code lit up on WSL. It will almost certainly get resolved in a near-future Insiders release (with complete acknowledgement I have no standing to predict when it will be fixed). I'm just saying gdb isn't going to stay broken forever, so don't enshrine "on WSL you have to not-disable ASLR" too permanently. It's just an Insider regression, and those are dime a dozen.
therealkenc
on 23 Jan 2018
@therealkenc Ah. Then maybe not. I'll also assume that with the official release it should be fixed.
pieandcakes
on 24 Jan 2018
Thank you @therealkenc, makes my life a whole lot easier. I finally got the AMD-v enabled BIOS, so I have an insider build inside Hyper-V (still not verified myself, cause it's merging snapshots on a HDD, takes forever), but I believe you. I'll update my launch.json accordingly (or create a .gdbinit if that works).
Back to porting GNU C to ISO C! Hooray! _Or hooray?_
MathiasMagnus
on 24 Jan 2018
@MathiasMagnus I don't envy you! :)
pieandcakes
on 24 Jan 2018
Just confirmed this is fixed in Insiders 17083 released today. So my posted work-around had a lifespan of around 24 hours....
therealkenc
on 25 Jan 2018
Related issues
 montery8
·
3Comments
montery8
·
3Comments
 jrieken
·
3Comments
jrieken
·
3Comments
 wdc596933938
·
3Comments
wdc596933938
·
3Comments
 lutianqi
·
3Comments
lutianqi
·
3Comments
 timothy
·
3Comments
timothy
·
3Comments
Most helpful comment
Can confirm that is the problem. In
launch.json: