Vscode-cpptools: [OS X] Stackframe with a relative path to code file is not returning the code file
On Mac, when a breakpoint is hit, clicking on the stack entries fails to find the source code. This worked fine with the previous and all other versions of the extension.
Is there a way to downgrade to the last version?
 zajo
zajo
All 24 comments
@zajo can you be more specific about it not finding source code?
 pieandcakes
on 9 Nov 2017
pieandcakes
on 9 Nov 2017
http://ms-vscode.gallery.vsassets.io/_apis/public/gallery/publisher/ms-vscode/extension/cpptools/0.14.0/assetbyname/Microsoft.VisualStudio.Services.VSIXPackage (renaming the file to a .vsix and using the Install from vsix command and setting extensions.autoUpdate to false).
 sean-mcmanus
on 9 Nov 2017
sean-mcmanus
on 9 Nov 2017
Wow thank you guys so much for the quick response. I'll downgrade to confirm that it works again.
@pieandcakes when the breakpoint hits, the stack, the variables -- all that stuff works, but it doesn't show the source code at all. It seems that it attempts to, but instead all that happens is that it switches from the debug panel to the source tree (which is strange, the debug panel should stay on, right?) Let me know if I can help further troubleshoot this.
zajo
on 9 Nov 2017
@zajo it should switch you to the file where the stackframe is OR it should tell you it can't find the file. If you are getting neither behavior i'm wondering if it is a problem with VS Code and if you downgrade, if it will work or not.
pieandcakes
on 9 Nov 2017
BTW which version of OS X are you running?
pieandcakes
on 9 Nov 2017
macOS High Sierra Version 10.13.1.
It most definitely doesn't tell me it can't find the file. I'm using latest VSCode too. How do I downgrade that? Also, is there a link with more detailed instructions on how to downgrade the extension itself? What do I do with the VSIXPackage file?
zajo
on 9 Nov 2017
@zajo You'll have to check with VS Code for that as I don't know how to downgrade VS Code.
To install the extension, go to the extensions tab and then locate ... and click Install from VSIX
pieandcakes
on 9 Nov 2017
Mac debugging works for me (source files open from the call stack too). I'm not sure what could be causing the issue.
sean-mcmanus
on 9 Nov 2017
Confirming that downgrading the extension fixed my problem. Thanks!
zajo
on 9 Nov 2017
Similar problem here on MacOS 10.13.2 Beta after updating the C++ extension to 0.14.2, but it also happens when stepping into some functions, not just when clicking on a call stack entry.
Stepping into a function doesn't land in the right source code and or line number sometimes (not for all functions, but consistently fails for the same function in different debugging sessions).
Blindly hitting "step" until the called function returns, or Shift-F11 then picks up the right location back in the caller file.
 floooh
on 11 Nov 2017
floooh
on 11 Nov 2017
Here are repro steps for my case:
On OSX, with VSCode installed:
> mkdir ~/scratch
> cd ~/scratch
> brew install cmake
> brew install ninja
> git clone https://github.com/floooh/sokol-samples
> cd sokol-samples
> ./fips diag tools
=== tools:
git:    found
cmake:  found
...
ninja:  found
xcodebuild: found
...
python2:    found
...
vscode: found
> ./fips set config osx-vscode-debug
'config' set to 'osx-vscode-debug' in project 'sokol-samples'
> ./fips gen
...
> ./fips open
You should be in VSCode now.
Build the project Cmd-Shift-B.
Debug a target Cmd-P: debug triangle-glfw.
Step Over until you reach the function sg_setup() (right below the block of GLFW and FlextGL function calls).
Step Into the function sg_setup() and note how you're in the wrong location and the debug step marker is gone.
floooh
on 11 Nov 2017
Similar issue here on MacOS, using latest stable versions.
When it does not find a file (shows "..." in the call stack instead of the file name), it changes from the DEBUG panel to the EXPLORER panel and shows no error.
I've also noticed that it is not finding any header file. Calling '-exec source info' in lldm shows different paths for headers and cpp's (they are on the same folder):
.h: /Users/abmantis/project/builds/cmake/core/../../../src/debug_trace.h:21:27
.cc: /Users/abmantis/project/cor3/src/debug_trace.cc:125:43
Should I open a separate issue?
 abmantis
on 30 Nov 2017
abmantis
on 30 Nov 2017
Same here, clicking on a frame in the call stack changes to the explorer view without opening a file. Version 0.14.5 on Mac OS High Sierra. Downgrading to 0.14.0 didn't work for me, encountered an error:
Debug adapter process has terminated unexpectedly
 jspohr
on 31 Dec 2017
jspohr
on 31 Dec 2017
@abmantis
I've also noticed that it is not finding any header file. Calling '-exec source info' in lldm shows different paths for headers and cpp's (they are on the same folder):
The different paths are generated by your compile tool. When you say its not able to find any header file, are you using go to definition? if that's the case, please open a different issue.
pieandcakes
on 2 Jan 2018
I'm still seeing the problem on OSX High Sierra with VSCode Insiders, here is a bit more info, may be it helps to pinpoint the issue
First, everything works when invoking lldb directly from the command line, note how I'm stepping into the z80.h header from the main file kc87.c, all the displayed source paths and locations are correct:
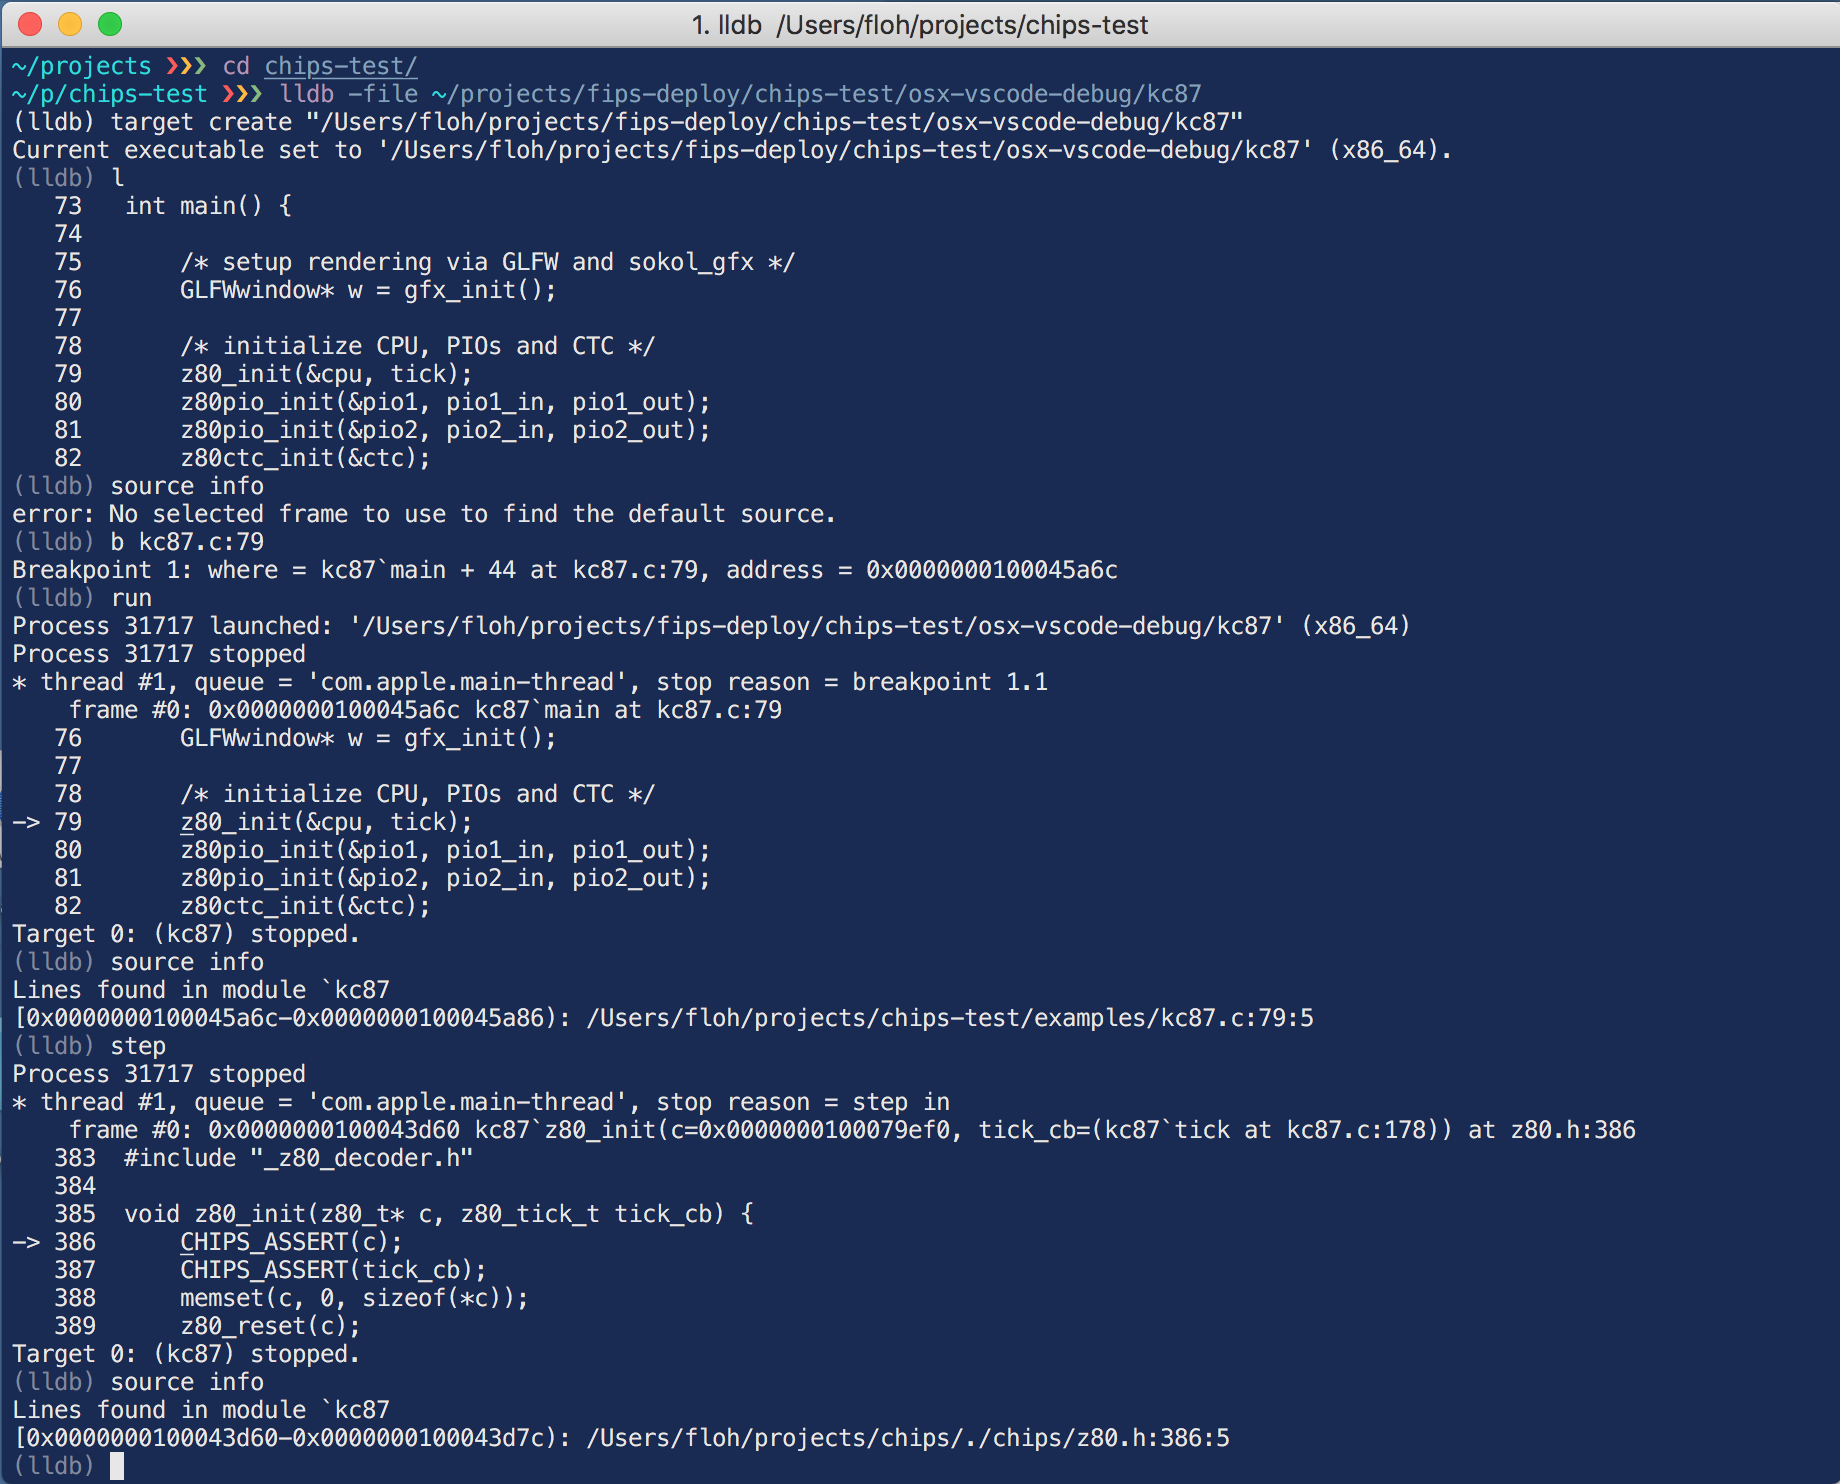
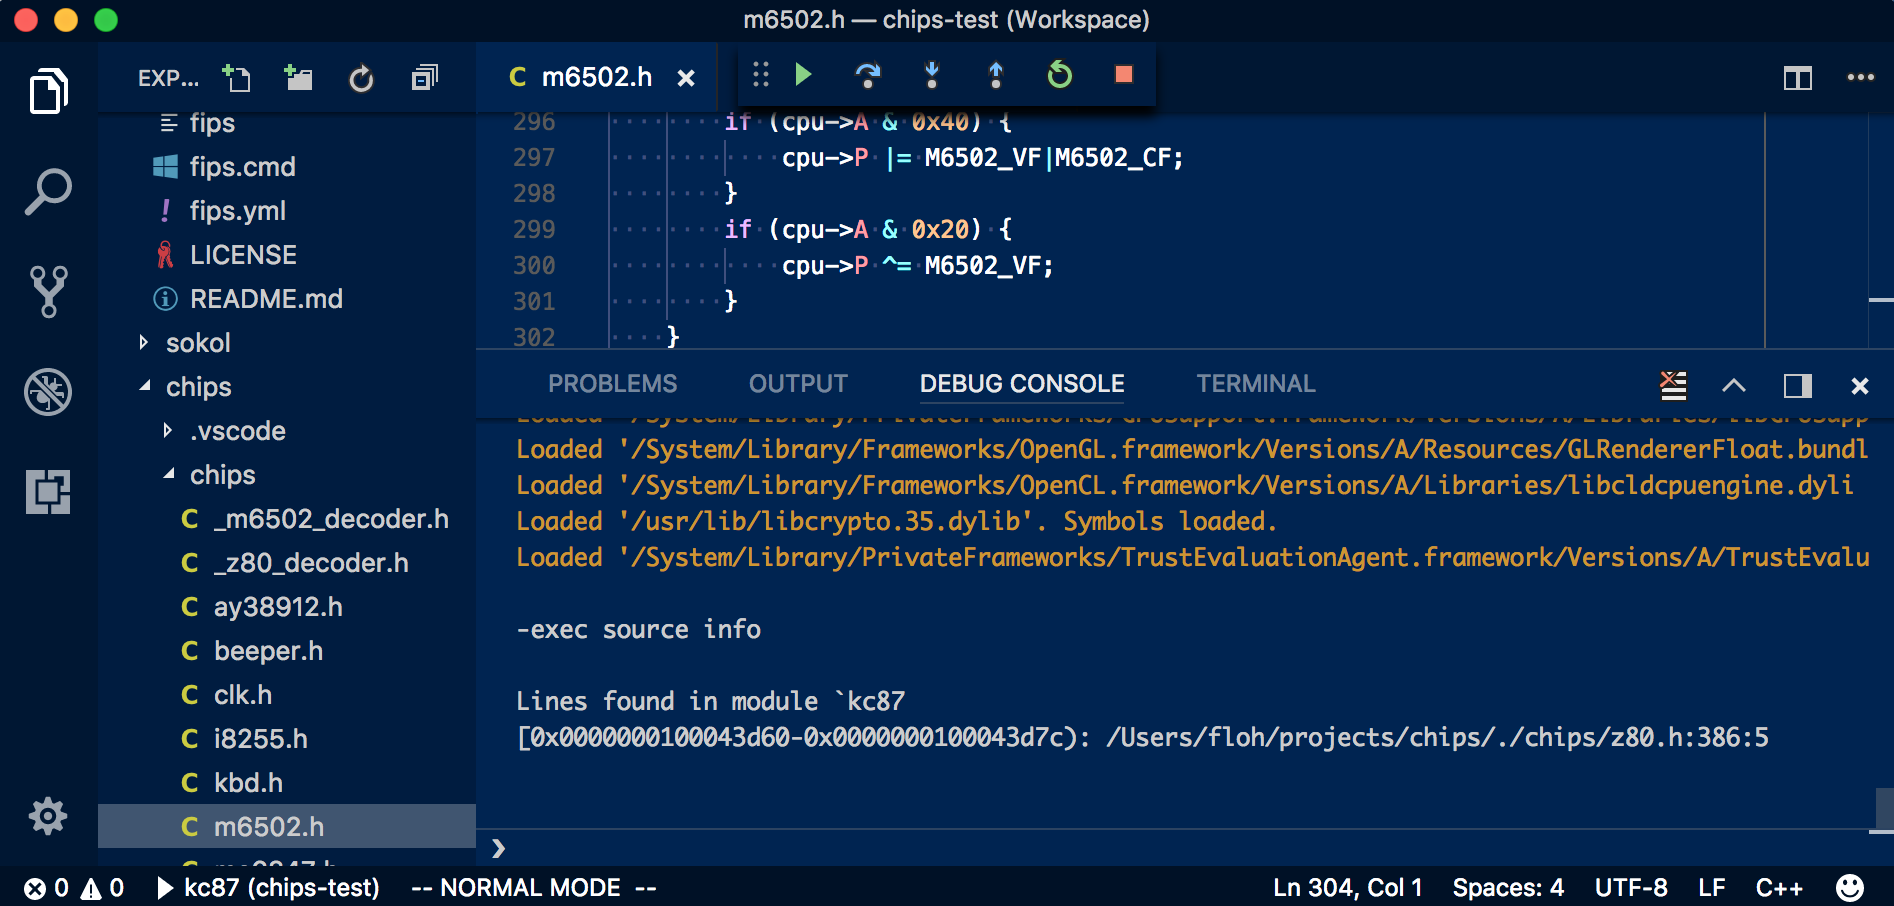
Doing the same in VSCode with the C/C++ extension lands in the wrong source file when stepping into the z80.h header (for some reason it jumps to the header m6502.h, this is not used by the program being debugged; at other times, the default start page of VSCode is displayed, or the launch.json file (so it seems completely random what file is loaded)). But also note how -exec source info in the VSCode debugger console shows the correct location (z80.h):
The launch.json entry for this program is:
  {
   "stopAtEntry":true,
   "program":"/Users/floh/projects/fips-deploy/chips-test/osx-vscode-debug/kc87",
   "name":"kc87",
   "externalConsole":false,
   "request":"launch",
   "args":[],
   "type":"cppdbg",
   "cwd":"/Users/floh/projects/fips-deploy/chips-test/osx-vscode-debug",
   "MIMode":"lldb"
  },
On Windows it works as expected.
Also the separate LLDB extension (https://github.com/vadimcn/vscode-lldb) works as expected.
PS: clicking on stack entries within the problematic header has the same problem as described in the original bug, only clicking on the toplevel call stack entry opens the expected source file.
floooh
on 3 Jan 2018
@floooh One of the differences between your standalone lldb versus the use in VS Code is that it is using two separate versions of lldb. We ship a version of lldb for the VS Code extension based off of version 3.8.0.
I'll get a machine setup with High Sierra today and try and repro this with your instructions above.
pieandcakes
on 3 Jan 2018
So it looks like if there is a relative path in the stack frame, its not liking it. In @floooh's repro above with the triangle example, we are returning a file path terminating at the /./ instead of the filename. To see this, if you enable "logging": { "engineLogging": true, "trace": true, "traceResponse": true } you will see that we get the full path from lldb but during translation back to VS Code, we are trimming off the filename.
Workaround for now: compile without relative file paths. I'm looking at how to fix this.
pieandcakes
on 4 Jan 2018
I see, thanks for finding that out. Those paths are a side effect of include search path definition in my python cmake wrapper (some header search paths are defined as just '.' for current directory, or relative paths like '../xxx', I'll see if I can normalize the paths on my side as well.
Of course a more robust solution would be to do this path normalization on your side, because the other tools (compiler, debugger, linker etc...) don't have a problem with such paths :)
Cheers!
floooh
on 4 Jan 2018
Ok I can confirm that normalizing the paths to not include '.', '..' etc works (python has a handy os.path.normpath() for that). Please be aware that the above repro steps don't work anymore if you do a fresh checkout though.
floooh
on 4 Jan 2018
No problem. Since I know what is happening I have a test app written now to try and figure out how to normalize it properly. This code was added to fix the VS Code bug of opening files with different casing and it has a bug in it.
pieandcakes
on 4 Jan 2018
Can those of you still having the problem try this release?
https://github.com/Microsoft/vscode-cpptools/releases/tag/v0.14.6-insiders
Thanks
pieandcakes
on 9 Jan 2018
Works for me, thanks.
zajo
on 9 Jan 2018
@pieandcakes Seems to be fixed in 0.14.6.
abmantis
on 10 Jan 2018
sean-mcmanus
on 18 Jan 2018
Related issues
 vicatcu
·
3Comments
vicatcu
·
3Comments
 jyavenard
·
3Comments
jyavenard
·
3Comments
 thndrwrks
·
3Comments
thndrwrks
·
3Comments
 chrisckc
·
3Comments
chrisckc
·
3Comments
 narutse
·
3Comments
narutse
·
3Comments
Most helpful comment
Can those of you still having the problem try this release?
https://github.com/Microsoft/vscode-cpptools/releases/tag/v0.14.6-insiders
Thanks