Vscode-cpptools: cppvsdbg can't step over Standard Library calls
Looks like Visual Code is not working as expecting when I try to Step Over a call to std::cout (F10) with Visual Studio Debugger. gdb on the other hand is working fine.
Visual Studio Code Version: 1.13.1
cpptools version: 0.12.0
Compiler: Microsoft (R) C/C++ Optimizing Compiler Version 19.00.24210 for x86
OS: Windows 7 Enterprise
Steps to reproduce:
- Run the _build_cl_ task (Ctrl+P _task build_cl_)
- Put a breakpoint in
helloworld.cppline 5 - Open the debug view (Ctrl+Shift+D)
- Select configuration _(Windows) Launch_
- Start Debugging (F5)
- Step Over until the first
coutinstruction (F10 3 times)
What happens
Visual Studio Code can't step over this call. F10 does not advance. Debug console outputs Access violation in ntdll.dll. Call Stack displays threads _Paused on Exception_.

What should happen
It should step Over std::cout just like it does when we compile with _task build_gcc_ and debug with _(gdb) Launch_ configuration.
Example Project
helloworld.cpp
#include <iostream>

int main()
{
  int x = 10;
  int y = 20;
  std::cout << "Hello World!" << std::endl;
  std::cout << x << " " << y << std::endl;
  int z = 30;
  std::cout << z << std::endl;
}
tasks.json
{
    "version": "0.1.0",
    "tasks": [
        {
            "taskName": "build_cl",
            "command": "build.bat",
            "isShellCommand": true,
            "showOutput": "always"
        },
        {
            "taskName": "build_gcc",
            "command": "g++.exe",
            "isShellCommand": true,
            "args": ["-g", "-o", "output/hello.exe", "helloworld.cpp"],
            "showOutput": "always"
        }
    ]
}
build.bat
@echo off
cd output
call "C:\Program Files (x86)\Microsoft Visual Studio 14.0\VC\vcvarsall.bat" x64
set compilerflags=/Od /Zi /EHsc
set linkerflags=/OUT:hello.exe /DEBUG
cl.exe %compilerflags% ..\helloworld.cpp /link %linkerflags%
launch.json
{
    "version": "0.2.0",
    "configurations": [
        {
            "name": "(gdb) Launch",
            "type": "cppdbg",
            "request": "launch",
            "program": "${workspaceRoot}/output/hello.exe",
            "args": [],
            "stopAtEntry": false,
            "cwd": "${workspaceRoot}",
            "environment": [],
            "externalConsole": true,
            "MIMode": "gdb",
            "miDebuggerPath": "gdb.exe",
            "setupCommands": [
                {
                    "description": "Enable pretty-printing for gdb",
                    "text": "-enable-pretty-printing",
                    "ignoreFailures": true
                }
            ]
        },
        {
            "name": "(Windows) Launch",
            "type": "cppvsdbg",
            "request": "launch",
            "program": "${workspaceRoot}/output/hello.exe",
            "symbolSearchPath": "${workspaceRoot}/output",
            "externalConsole": true,
            "args": [],
            "stopAtEntry": false,
            "cwd": "${workspaceRoot}",
            "environment": []
        }
    ]
}
Debug logs
````
You may only use the C/C++ Extension for Visual Studio Code with Visual Studio
Code, Visual Studio or Xamarin Studio software to help you develop and test your
applications.
Loaded 'C:\Users\N662831\Documents\Projects\C-C++\test-vscode\output\hello.exe'. Symbols are loaded.
Loaded 'C:\Windows\System32ntdll.dll'. Symbols are not loaded.
Loaded 'C:\Windows\System32\kernel32.dll'. Symbols are not loaded.
Loaded 'C:\Windows\System32\KernelBase.dll'. Symbols are not loaded.
Loaded 'C:\Windows\System32\sysfer.dll'. Symbols are not loaded.
Loaded 'C:\Windows\System32\advapi32.dll'. Symbols are not loaded.
Loaded 'C:\Windows\System32\msvcrt.dll'. Symbols are not loaded.
Loaded 'C:\Windows\System32\sechost.dll'. Symbols are not loaded.
Loaded 'C:\Windows\System32\rpcrt4.dll'. Symbols are not loaded.
Exception thrown at 0x000007FEFCC6A06D in hello.exe: Microsoft C++ exception: SysferException at memory location 0x00000000001DD540.
Exception thrown at 0x000007FEFCC6A06D in hello.exe: Microsoft C++ exception: SysferException at memory location 0x00000000001DD540.
Exception thrown at 0x000007FEFCC6A06D in hello.exe: Microsoft C++ exception: SysferException at memory location 0x00000000001DD540.
Exception thrown at 0x000007FEFCC6A06D in hello.exe: Microsoft C++ exception: SysferException at memory location 0x00000000001DD540.
Exception thrown at 0x000007FEFCC6A06D in hello.exe: Microsoft C++ exception: SysferException at memory location 0x00000000001DD540.
Exception thrown at 0x000007FEFCC6A06D in hello.exe: Microsoft C++ exception: SysferException at memory location 0x00000000001DD540.
````
 aaccioly
All 20 comments
Just to confirm the behavior in 1.14.0.
Setting up he symbolsSearchPath also does not make much difference:
Environment:
_NT_SYMBOL_PATH="srv*c:\symbols*https://msdl.microsoft.com/download/symbols"
I can see PDB files getting cached locally.
Change to launch configuration:
{
    "name": "(Windows) Launch",
    "type": "cppvsdbg",
    "request": "launch",
    "program": "${workspaceRoot}/output/hello.exe",
    "symbolSearchPath": "C:\\Symbols",
    "args": [],
    "stopAtEntry": false,
    "cwd": "${workspaceRoot}",
    "environment": [],
    "externalConsole": true
},
````

#### Debug logs
You may only use the C/C++ Extension for Visual Studio Code with Visual Studio
Code, Visual Studio or Xamarin Studio software to help you develop and test your
applications.
Loaded 'C:\Users\N662831\Documents\Projects\C-C++\test-vscode\output\hello.exe'. Symbols are loaded.
Loaded 'C:\Windows\System32ntdll.dll'. Symbols are loaded.
Loaded 'C:\Windows\System32\kernel32.dll'. Symbols are loaded.
Loaded 'C:\Windows\System32\KernelBase.dll'. Symbols are loaded.
Loaded 'C:\Windows\System32\sysfer.dll'. Symbols are not loaded.
Loaded 'C:\Windows\System32\advapi32.dll'. Symbols are loaded.
Loaded 'C:\Windows\System32\msvcrt.dll'. Symbols are loaded.
Loaded 'C:\Windows\System32\sechost.dll'. Symbols are loaded.
Loaded 'C:\Windows\System32\rpcrt4.dll'. Symbols are not loaded.
Exception thrown at 0x000007FEFCC6A06D in hello.exe: Microsoft C++ exception: SysferException at memory location 0x000000000017D980.
Exception thrown at 0x000007FEFCC6A06D in hello.exe: Microsoft C++ exception: SysferException at memory location 0x000000000017D980.
Exception thrown at 0x000007FEFCC6A06D in hello.exe: Microsoft C++ exception: SysferException at memory location 0x000000000017D980.
Exception thrown at 0x000007FEFCC6A06D in hello.exe: Microsoft C++ exception: SysferException at memory location 0x000000000017D980.
Exception thrown at 0x000007FEFCC6A06D in hello.exe: Microsoft C++ exception: SysferException at memory location 0x000000000017D980.
Exception thrown at 0x000007FEFCC6A06D in hello.exe: Microsoft C++ exception: SysferException at memory location 0x000000000017D980.
Loaded 'C:\Windows\System32\psapi.dll'. Symbols are loaded.
Loaded 'C:\Windows\System32\api-ms-win-core-synch-l1-2-0.dll'. Symbols are not loaded.
Unloaded 'C:\Windows\System32\api-ms-win-core-synch-l1-2-0.dll'.
Loaded 'C:\Windows\System32\api-ms-win-core-synch-l1-2-0.dll'. Symbols are loaded.
Loaded 'C:\Windows\System32\privman64.dll'. Symbols are not loaded.
Exception thrown at 0x0000000076E02525 (ntdll.dll) in hello.exe: 0xC0000005: Access violation writing location 0x0000000000000000.
```
aaccioly
on 13 Jul 2017
@aaccioly I'll take a look if it repros in our latest build of the Visual C++ debugger bits.
 pieandcakes
on 13 Jul 2017
pieandcakes
on 13 Jul 2017
Hi @pieandcakes, brilliant. Unfortunately I don't have access to VS Studio 2017 or insiders build.
Anyway, debugging works with VS 2015 Update 3:
devenv.exe /debugexe output\hello.exe- New Function Breakpoint (Ctrl+B). Function name _main_
- Start Debugging (F5)
- Step Over 4 times (F10)
Joy.
I've also noticed that VS 2015 download way more PDBs than Visual Studio Code
aaccioly
on 13 Jul 2017
@aaccioly AFAIK we don't have symbol server support in VSCode. Symbols would need to be provided locally. If you need symbol server support, our recommendation is to use Visual Studio itself.
pieandcakes
on 13 Jul 2017
@pieandcakes Fair enough. Symbol servers are actually a completely new concept to me. I've only played with it to to try the troubleshoot the issue (just wondering it the lack of symbols was getting in the way). Besides, there is a symbolsSearchPath option in vscode. Can we make it work with the syntax that I've passed to _NT_SYMBOL_PATH? (I know, separate issue all together, but certainly useful).
aaccioly
on 13 Jul 2017
@aaccioly It looks like it just hangs with 0.12.0 on my machine. I tested it with the update that will be coming out this week and it works. Please wait for the update and let me know if that works.
We currently don't support _NT_SYMBOL_PATH and I can add it to the backlog of work items.
pieandcakes
on 17 Jul 2017
Hi @pieandcakes, brilliant. As soon as I get an opportunity to test it I'll let you know.
aaccioly
on 17 Jul 2017
Hi @pieandcakes, unfortunately it is still not working for me after updating to version 0.12.1.
Debug logs
````
You may only use the C/C++ Extension for Visual Studio Code with
Visual Studio Code, Visual Studio or Visual Studio for Mac software
to help you develop and test your applications.
Loaded 'C:\Users\N662831\Documents\Projects\C-C++\test-vscode\output\hello.exe'. Symbols loaded.
Loaded 'C:\Windows\System32ntdll.dll'. Symbols loaded.
Loaded 'C:\Windows\System32\kernel32.dll'. Symbols loaded.
Loaded 'C:\Windows\System32\KernelBase.dll'. Symbols loaded.
Loaded 'C:\Windows\System32\sysfer.dll'. Cannot find or open the PDB file.
Loaded 'C:\Windows\System32\advapi32.dll'. Symbols loaded.
Loaded 'C:\Windows\System32\msvcrt.dll'. Symbols loaded.
Loaded 'C:\Windows\System32\sechost.dll'. Symbols loaded.
Loaded 'C:\Windows\System32\rpcrt4.dll'. Cannot find or open the PDB file.
Exception thrown at 0x000007FEFD64A06D in hello.exe: Microsoft C++ exception: SysferException at memory location 0x00000000002AD930.
Exception thrown at 0x000007FEFD64A06D in hello.exe: Microsoft C++ exception: SysferException at memory location 0x00000000002AD930.
Exception thrown at 0x000007FEFD64A06D in hello.exe: Microsoft C++ exception: SysferException at memory location 0x00000000002AD930.
Exception thrown at 0x000007FEFD64A06D in hello.exe: Microsoft C++ exception: SysferException at memory location 0x00000000002AD930.
Exception thrown at 0x000007FEFD64A06D in hello.exe: Microsoft C++ exception: SysferException at memory location 0x00000000002AD930.
Exception thrown at 0x000007FEFD64A06D in hello.exe: Microsoft C++ exception: SysferException at memory location 0x00000000002AD930.
Loaded 'C:\Windows\System32\psapi.dll'. Symbols loaded.
Loaded 'C:\Windows\System32\api-ms-win-core-synch-l1-2-0.dll'. Module was built without symbols.
Unloaded 'C:\Windows\System32\api-ms-win-core-synch-l1-2-0.dll'.
Loaded 'C:\Windows\System32\api-ms-win-core-synch-l1-2-0.dll'. Symbols loaded.
Loaded 'C:\Windows\System32\privman64.dll'. Cannot find or open the PDB file.
Exception thrown at 0x0000000077792525 (ntdll.dll) in hello.exe: 0xC0000005: Access violation writing location 0x0000000000000000.
````
aaccioly
on 31 Jul 2017
@aaccioly Sorry I've been on vacation. I'll take a look today/tomorrow and see if I can duplicate this.
pieandcakes
on 17 Aug 2017
@aaccioly Can you tell me if you are running x86 or x64 Windows 7 Enterprise?
pieandcakes
on 18 Aug 2017
So this is what I tried.
- I installed Windows 7 Enterprise with SP1 x64
- I downloaded the latest VS Code version 1.15.1.
- I downloaded the newest C/C++ extension version 0.12.3
- I downloaded the Visual C++ build tools 2015 version
I copied out all your files and then ran the build_cl task.
I then ran the (Windows) Launch configuration after setting the function breakpoint at main. I pressed F10 4 times and I didn't see any issues.

I don't know what is different in your configuration but I can't seem to duplicate the issue.
pieandcakes
on 19 Aug 2017
Hi @pieandcakes. I'm running x64. Looks like we are using the exact same versions.


Some things that I've noticed:
- I'm getting some exceptions even before the
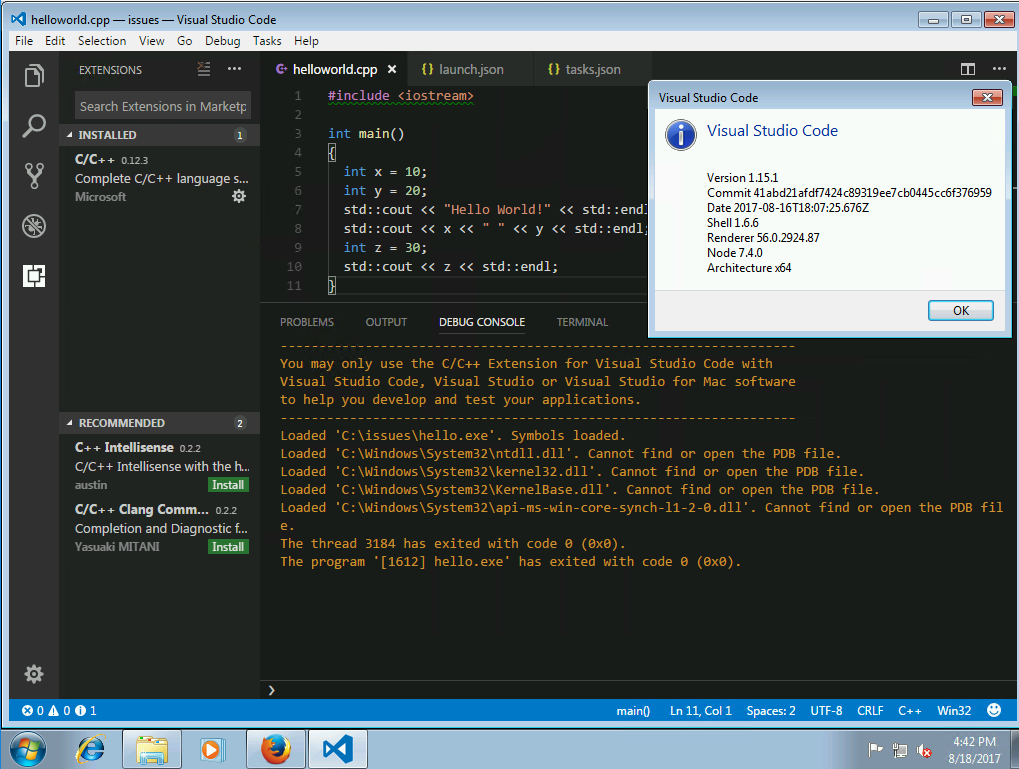
std::coutline. Your debug logs looks way cleaner than mine. - When the debugger works it loads a second tab containing
helloworld.cpp(check the first screenshot) - After it fails or if I hit Stop (Shift+F5) both tabs are left often.
- Then if I try to debug again the debugger fails to stop at the breakpoint. Debug logs are exactly like https://github.com/Microsoft/vscode-cpptools/issues/879#issuecomment-319095860
- After that I can't launch the debugger in a reliable way anymore. Sometimes vscode stops at the breakpoint, but often it doesn't.
aaccioly
on 21 Aug 2017
After a failure the Call Stack looks interesting. I don't even have an f drive mapped :D

aaccioly
on 21 Aug 2017
My setup is creating a new install of Win7 x64 Enterprise, installing .Net framework 4.5.1 (which is needed to install the 2015 Visual C++ build tools), installing the build tools and then the extension and then I debug. I have to use a VM because I don't have an extra physical machine to install Win7 on. If you are on a physical machine, that might be the difference? I did make sure to install all Windows updates before trying the scenario.
The f: drive is the location on our build machines when building the crt. Its looking for library source which I assume you don't have and can't find (that's why you get the error). This is normal.
pieandcakes
on 21 Aug 2017
Hi @pieandcakes, yes, I'm on physical hardware. I have .Net Framework 4.6.01055 (Release DWORD: 394271) installed in C:\Windows\Microsoft.NET. This bug is bizzare. Is there any kind of logs that I can enable / collect that may help to troubleshoot the problem?
aaccioly
on 22 Aug 2017
Hi @pieandcakes, just to report that _something_ fixed the issue between 0.13.1 and 0.14.0 (not very useful info, sorry).
I'm still getting weird errors related to the f: driver, for instance, that's what i get when I Step Over ( (F10) the last line:
Unable to open 'exe_common.inl': File not found (file:///f:/dd/vctools/crt/vcstartup/src/startup/exe_common.inl).
However, this is probably a separate and unrelated bug. Feel free to close this issue.
aaccioly
on 23 Oct 2017
What about debugging C++ applications built on QT? What settings are to be changed in launch.json?
 10manjunath
on 20 Dec 2017
10manjunath
on 20 Dec 2017
@10manjunath This issue is regarding compiled and debugging Visual C++ code. Is that what QT uses?
pieandcakes
on 27 Dec 2017
yes @pieandcakes. https://github.com/Microsoft/vscode-cpptools/issues/1371
10manjunath
on 28 Dec 2017
@10manjunath based on #1371, you are using Gnu C++ and not Visual C++. thank you for filing a different issue.
pieandcakes
on 28 Dec 2017
Related issues
 CDitzel
·
3Comments
CDitzel
·
3Comments
 igorPhelype
·
3Comments
igorPhelype
·
3Comments
 narutse
·
3Comments
narutse
·
3Comments
 BDZNH
·
3Comments
BDZNH
·
3Comments
 lutianqi
·
3Comments
lutianqi
·
3Comments