Vscode-cpptools: Disable "Unable to open file" during debug
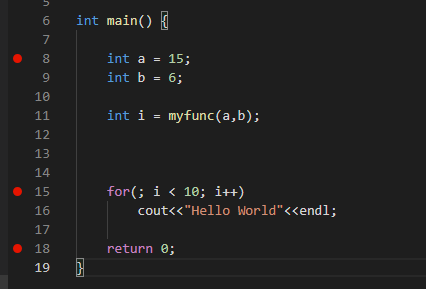
So I'm creating a very simple c++ app for learning on Ubuntu using c++ and gdb:
~~~
include
using namespace std;
int main ()
{
int score = 0;
cout << "Enter an integer score between 0 and 100." << endl;
cin >> score;
if(score >= 90 && score <= 100)
{
    cout << "Awesome!" << endl;
}
if(score >= 80 && score <= 89)
{
    cout << "Well Done." << endl;
}
if(score >= 70 && score <= 79)
{
    cout <<  "Average." << endl;
}
if(score >= 60 && score <= 69)
{
    cout << "Bummer." << endl;
}
if(score >= 0 && score <= 59)
{
    cout << "Sad Times." << endl;
}

return 0;
}
~~~
When pausing and stepping into/over I have to hit cancel each time for things like this:


Is there a way to disable these so I can step through the program? Thank you.
 DigiAngel
All 79 comments
@DigiAngel That would probably be a VSCode question. We send back a path that VSCode can't find (which for these is probably the case).
 pieandcakes
on 9 Jun 2017
pieandcakes
on 9 Jun 2017
Brilliant thanks...I'll close and approve from that end.
DigiAngel
on 9 Jun 2017
So they say it's you...so...now what :)
DigiAngel
on 13 Jun 2017
The question from me (from VS Code) is are those files absolutely relevant for the user to debug a simple code sample as above. This can be answered by the extension owners.
If it is absolutely required, then the current behavior is right. As in the extension requests VS Code to open a file that VS Code cannot find and communicates the same to the user using the current notification model.
If the notification model is what is bothersome, then you can pitch in here: https://github.com/Microsoft/vscode/issues/22388 where we talk about improvements to the notification model.
 ramya-rao-a
on 13 Jun 2017
ramya-rao-a
on 13 Jun 2017
Oh, yeah, I've hit this "can't open file" thing. I assumed it was "by design". I think the popup model is annoying because it requires manual clicking to get rid of. Outputting the error to the Output window is less intrusive.
 sean-mcmanus
on 13 Jun 2017
sean-mcmanus
on 13 Jun 2017
@ramya-rao-a These file don't exist on the users machine. The users are debugging in to library code that they may (but most likely) don't have. In that instance, I think @DigiAngel wants an option to stop getting notified that the files can't be found. I think this is a good feature per debug session or per instance of file but if the user starts another debug session, they should be notified once just in case its a file they care about.
pieandcakes
on 13 Jun 2017
@sean-mcmanus the notification is by VS Code. Changing it to the output window may be better but I know people who have the debug Console up and not the Output window so it might be invisible to the user which isn't a good experience either.
pieandcakes
on 13 Jun 2017
cc @isidorn for thoughts on https://github.com/Microsoft/vscode-cpptools/issues/811#issuecomment-308218314
ramya-rao-a
on 14 Jun 2017
@pieandcakes if the file is not available please send the presentationHint of deemphasize and vscode shuold not automatically show it (note that I have only now pushed this change to vscode so you can pick it up in vscode insiders)
 isidorn
on 14 Jun 2017
isidorn
on 14 Jun 2017
Thanks for the chatter and discussion around this...really appreciate it.
DigiAngel
on 14 Jun 2017
@isidorn I can see what we can do. Which response does this lie in?
The problem is that we don't know if it should be available or not. We as the debugger don't know if its user or library code in C++ so we send back every path. If the user is doing remote debugging and didn't setup source mapping correctly, we do want those errors but with library code we don't. The simplest way would be for the user to decide which warnings they want to see again versus the debugger trying to figure it out and getting it wrong.
pieandcakes
on 14 Jun 2017
@pieandcakes you can have the presentationHint as part of the StackFrame or the Source
If we want to give more control to the user to choose which warnings to see that would be a feature request on the vscode (which we can look into if more users ask for this or we accept PRs of course)
isidorn
on 15 Jun 2017
Any movement on this? Thank you.
DigiAngel
on 13 Jul 2017
@DigiAngel It looks like we need to make a feature request with VSCode. @isidorn 's suggestion of presentationHint would not work in our scenario because as far as I know, gdb doesn't tell me the difference between user and library code.
pieandcakes
on 13 Jul 2017
@pieandcakes Thank you....is there something I can do on my end? And maybe just a path check would suffice to determine user code?
DigiAngel
on 13 Jul 2017
I guess to get rid of the message, you could download glibc source but I don't think that's a good fix. I need to do some searching (or if you want to, that would help) on whether there is a way to tell from gdb if code is from a library or not. If there is, then we might be able to take advantage of @isidorn 's suggestion but from my quick look, I didn't see anything
pieandcakes
on 13 Jul 2017
Yea I looked and didn't find anything...even this: gdb-dashboard will display the error. So it looks like a suppression option is the route to go. I wouldn't complain if it was just a popup, but it completely halts debugging until you hit Create or Cancel each step. Thank you.
DigiAngel
on 16 Jul 2017
I'd put those annoying interface-hiding messages in their own tab.
 CTimmerman
on 12 Aug 2017
CTimmerman
on 12 Aug 2017
@pieandcakes
This issue still persists in vscode 1.15.1 with c/c++-tools 0.12.3.
Has there been any progress on this issue, or, is there some form of workaround available?
 ntphx
on 22 Aug 2017
ntphx
on 22 Aug 2017
@radiowest I have not had time to investigate a solution.
pieandcakes
on 22 Aug 2017
This is causing troubles for me, too. I have downloaded glibc source but not entirely sure where to symlink it. Anybody at least have success doing that as a workaround?
 anselanza
on 8 Jan 2018
anselanza
on 8 Jan 2018
Updating to the latest version of VSCode fixed this problem for me.
From: Stephen Buchanan notifications@github.com
Reply-To: Microsoft/vscode-cpptools reply@reply.github.com
Date: Monday, 8 January 2018 at 12:12
To: Microsoft/vscode-cpptools vscode-cpptools@noreply.github.com
Cc: radiowest bramvandecapelle@gmail.com, Mention mention@noreply.github.com
Subject: Re: [Microsoft/vscode-cpptools] Disable "Unable to open file" during debug (#811)
This is causing troubles for me, too. I have downloaded glibc source but not entirely sure where to symlink it. Anybody at least have success doing that as a workaround?
—
You are receiving this because you were mentioned.
Reply to this email directly, view it on GitHub, or mute the thread.
ntphx
on 22 Jan 2018
I have the same problem with the most recent versions of both the standard and Insider build.
glibc-source is on the path /usr/src/glibc/glibc-2.26/ for me and I would be happy to symlink it somewhere to resolve this if possible.
Edit: Resolved this by following what ChanJuiHuang did to resolve the same issue, as explained in #1094
Specifically, the error I received was that a file couldn't be found on the path "file:///build/glibc-8C7Cr9/glibc-2.26/.../..." - creating /build/glibc-8C7Cr9/, and making a symlink between /usr/src/glibc/glibc-2.26 and /build/glibc-8C7Cr9/glibc-2.26 fixed this.
The fix has persisted across restarts of VSC, though I haven't tested across restarts of the machine. Other similar issues have mentioned error messages with a similar format path, so it seems that the path is generated on install and then not updated.
Another potential solution is to display functions in the call stack debug window in reverse alphabetical order instead of alphabetical order, so that main (or some other user-defined function) is the first entry and builtin functions are last. Didn't see a user-controllable setting for this though.
@anselanza @DigiAngel this should work.
 jharveyb
on 23 Jan 2018
jharveyb
on 23 Jan 2018
I solved my issues by laboriously going through each third-party library linked in my project and adding their paths (under includePath) to c_ppp_properties.json
anselanza
on 23 Jan 2018
@jharveyb Your other option to fix the missing code file is to setup a "sourceFileMap" from the expected location to your actual location for the root of the files for glibc.
This happens when you stop in glibc library code during debugging and gdb returns to us a location for this code file. Because we don't know that it is a glibc library versus your code, we still return the path to VSCode. VSCode then looks for the file and can't find it. It is ignorable and should not be blocking debugging as you can change your call stack frame to a different line where it is in your source code.
@anselanza That should not fix this issue as we don't access that property during debugging.
pieandcakes
on 23 Jan 2018
Hi,
I have the same problem with latest version of vscode when I tried do debug 64 bit program. I received the error: "Unable to open 'main.cc': File not found (file:///d/.../main.cc)." But it works fine when I debug 32 bit program. I guess this might have something to do with my gdb debugger. But I have no idea how to pin down the problem, as I am a novice in gdb debuger(I relied on Visual Studio to do everything for me before I switch to vscode). Can someone give a hint on how to solve the problem, or getting around of it? Thank you!
 ZhijiaCHEN
on 14 Feb 2018
ZhijiaCHEN
on 14 Feb 2018
Its telling you it cannot find the file you're trying to debug. You need to
go and check your debugging config file and make sure you're providing the
correct workspace root etc...
On 14 Feb 2018 06:35, "ZhijiaCHEN" notifications@github.com wrote:
Hi,
I have the same problem with latest version of vscode when I tried do
debug 64 bit program. I received the error: "Unable to open 'main.cc': File
not found (file:///d/.../main.cc)." But it works fine when I debug 32 bit
program. I guess this might have something to do with my gdb debugger. But
I have no idea how to pin down the problem, as I am a novice in gdb
debuger(I relied on Visual Studio to do everything for me before I switch
to vscode). Can someone give a hint on how to solve the problem, or getting
around of it? Thank you!—
You are receiving this because you were mentioned.
Reply to this email directly, view it on GitHub
https://github.com/Microsoft/vscode-cpptools/issues/811#issuecomment-365501377,
or mute the thread
https://github.com/notifications/unsubscribe-auth/AdyxgC5ZvZBq4HA_k7vUgcRa-WSthL6_ks5tUnCKgaJpZM4N1SLo
.
ntphx
on 14 Feb 2018
@ZhijiaCHEN what @radiowest says is correct. You need to determine if the "file" gdb is saying is on your machine is actually on your machine in the location it is looking for it or not. We pass back whatever paths are passed into your compiler that are compiled into the symbols for your binary. That is what we get from gdb. Most likely you moved the executable and need to then set up sourceFileMaps to point to where the source is located on your machine.
pieandcakes
on 14 Feb 2018
@radiowest what does this mean? Can you please clarify? This issue is driving me crazy
 sebasijan
on 27 Mar 2018
sebasijan
on 27 Mar 2018
@sebasijan If the library is loaded with symbols and the debugger detects the file which a breakpoint/error occurred, it will return the path to where the source is for you to use. However, debugging shared libraries expects to find sources on your machine, but it does not exist. So when the debugger retrieves the path and tells VS Code to search there, VS Code complains that the file does not exist.
You can ignore these errors by adding the following to your launch.json.
"setupCommands": [
{
"description": "Skip <path> files",
"text": "-interpreter-exec console \"skip -gfi <path-to-ignore>/**/*\""
}
]
You replace
With the example from the original post, you would replace /build/glibc-9tT8Do/glibc-2.23/. The glob pattern **/* will ignore all files in all directories under
If more errors appear, you can add more commands to setupCommands to ignore those paths.
 WardenGnaw
on 27 Mar 2018
WardenGnaw
on 27 Mar 2018
I've fixed this in the follow way ..
my error is
"Unable to open 'libc-start.c': File not found (file:///build/glibc-OTsEL5/glibc-2.27/csu/libc-start.c"
so I make a dir in the root directory
$cd /
$sudo mkdir build
$cd build
$sudo mkdir glibc-OTsEL5
$cd glibc-OTsEL5
and then download the glibc from internet
$sudo wget http://ftp.gnu.org/gnu/glibc/glibc-2.27.tar.gz
then unpack it
$sudo tar -xzvf glibc-2.27.tar.gz
every thing seems to be ok
 qzxuhui
on 20 Jul 2018
qzxuhui
on 20 Jul 2018
This is the debugger telling us where it is stopped in library or framework code. it isn't necessary to download the source and you can probably ignore it safely by stepping back into your code.
pieandcakes
on 20 Jul 2018
Hmm it seems more trouble than is worth, apparently for no reason. You would think they would handle this issue...
 ManuelBerrueta
on 28 Jul 2018
ManuelBerrueta
on 28 Jul 2018
It works for me ,3ks!
 FusEcho
on 13 Sep 2018
FusEcho
on 13 Sep 2018
@qzxuhui's method works for me as well. Thanks a lot!
 abaga129
on 5 Mar 2019
abaga129
on 5 Mar 2019
Even if as suggested provide glibc source under /build/glibc-OTsEL5/ (btw, why is this path? is it expected by vscode or by gdb?), this "can't open" message still appears for me if F10 on "return 0". (F5 does not show this message.)
 zxbuaa
on 27 Apr 2019
zxbuaa
on 27 Apr 2019
This is the debugger telling us where it is stopped in library or framework code. it isn't necessary to download the source and you can probably ignore it safely by stepping back into your code.
The debugger is stopped and whatever I clicked, step out, continue will simply exit the program. How could I ignore it safely by stepping back into my code?
 leonplust
on 20 Jun 2019
leonplust
on 20 Jun 2019
@leonplust You can choose where your code lies by using the Call Stack window. If you are wanting to ensure you stop at a specific line of code, you can set a breakpoint. By using step out you will at some point step out of your program running.
pieandcakes
on 20 Jun 2019
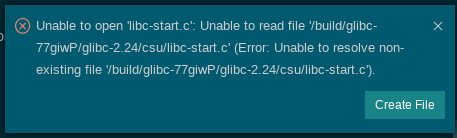
I have the same problem in a Remote WSL project with a slightly different error message.
Unable to open 'libc-start.c': Unable to read file (Error: File not found (vscode-remote://wsl+default/build/glibc-77giwP/glibc-2.24/csu/libc-start.c)).
I have tried to skip the source as recommended before with this gdb command but with no effect.
skip -gfi build/glibc-77giwP/glibc-2.24/**/*
In the gdb I have checked if the skipping is activated with:
sh
-exec info skip
Num Enb Glob File RE Function
1 y y build/glibc-77giwP/glibc-2.24/**/* n <none>
Can somebody help me why this is not working?
 humanosc
on 23 Jun 2019
humanosc
on 23 Jun 2019
@humanosc can you try less in your glob pattern? try glibc-2.24/**/* ?
Beyond that, it will need to be what gdb is doing with the skip command. For reference: https://sourceware.org/gdb/onlinedocs/gdb/Skipping-Over-Functions-and-Files.html
pieandcakes
on 24 Jun 2019
The problem still exists:
-exec info skip
Num Enb Glob File RE Function
1 y y glibc-2.24/**/* n <none>
with this simple program it always prompts this error message when I continue debugging with Step over (F10) at the last breakpoint.
Is there no way to skip such files?
humanosc
on 26 Jun 2019
@humanosc using skip was the information I found when doing a search. Unfortunately there isn't another way currently.
pieandcakes
on 26 Jun 2019
According to the doc from official gdb.
https://sourceware.org/gdb/onlinedocs/gdb/Source-Path.html
And I'm quite sure that I can specify the exactly location of the rust runtime source & rust deps sources. Will you please give me a example of launch.json to add extra source folder while debug ?
use setupCommands?
Here is my current configuration
{
// Use IntelliSense to learn about possible attributes.
// Hover to view descriptions of existing attributes.
// For more information, visit: https://go.microsoft.com/fwlink/?linkid=830387
"version": "0.2.0",
"configurations": [
{
"name": "[Debug] Libra Test Net",
"type": "cppdbg",
"request": "launch",
"program": "${workspaceFolder}/target/debug/client",
"args": [
"--host",
"ac.testnet.libra.org",
"--port",
"8000",
"-s",
"${workspaceFolder}/scripts/cli/trusted_peers.config.toml"
],
"stopAtEntry": false,
"cwd": "${workspaceFolder}",
"environment": [],
"externalConsole": false,
"linux": {
"MIMode": "gdb",
"miDebuggerPath": "/usr/local/gdb-8.3/bin/gdb",
},
"logging": {
"trace":true,
"moduleLoad": false,
"engineLogging": false,
"programOutput": true,
// "traceResponse": true,
"exceptions": true
},
"setupCommands": [
{
"description": "Enable pretty-printing for gdb",
"text": "-enable-pretty-printing",
"ignoreFailures": true
}
],
}
]
}
 jianglinchun
on 6 Aug 2019
jianglinchun
on 6 Aug 2019
You actually want our implementation and not gdbs. The article linked says specifically that the command you reference is not to find source files.
An example would be the below block, where <compileTimeSource> is the folder structure currently in the symbol file and <currentSource> will be where the source will be on your local machine.
"sourceFileMap": {
"<compileTimeSource>": "<currentSource>"
}
We do a startsWith style implementation so it will pattern match the left value and replace it with a right value. You will need to specify full directory names and not partial.
pieandcakes
on 6 Aug 2019
I'm having this problem, too.
 george-code
on 6 Aug 2019
george-code
on 6 Aug 2019
I got the alerts to go away using this solution . . .
https://github.com/microsoft/vscode-cpptools/issues/811#issuecomment-406544778
. . . but the debugger keeps stepping into the library source code, and that's annoying and unnecessary.
It would best if there were some way to tell VSC/gdb not to step through library code.
george-code
on 6 Aug 2019
@pieandcakes thank you. sourceFileMap solved my problem.
jianglinchun
on 7 Aug 2019
I don't understand why the skip command does not work as described in the doc. It seems exactly what should solve this problem. How does other Debuggers handle this like the Big Brother Visual Studio?
 daniel-brosche
on 7 Aug 2019
daniel-brosche
on 7 Aug 2019
@daniel-brosche I don't know why skip doesn't work either.
Visual Studio has its own debugger that has a feature called Just My Code that ignores it. If gdb had the same feature, we would be able to use it.
pieandcakes
on 7 Aug 2019
I have found another nice documentation about the skip command and how to generate a skip list by python: https://reversed.top/2016-05-26/skipping-standard-library-in-gdb/
Just another Doc about using glob patterns related to the "Just My Code" VS-Feature https://codeyarns.com/2018/07/03/how-to-skip-stepping-into-files-in-gdb/
daniel-brosche
on 7 Aug 2019
I use similar solution.
Firstly, install sources:
$ sudo apt install glibc-source
$ cd /usr/src/glibc
$ sudo tar xvf glibc-2.27.tar.xz
Then make link for folders using sourceFileMap in launch.json:
"sourceFileMap": {
    "/build/glibc-OTsEL5": "/usr/src/glibc"
},
 Maratk1n
on 14 Aug 2019
Maratk1n
on 14 Aug 2019
@Maratk1n can you share an engine log?
pieandcakes
on 14 Aug 2019
@Maratk1n can you share an engine log?
Where can I find it?
Maratk1n
on 15 Aug 2019
This is how you enable engine logging
pieandcakes
on 15 Aug 2019
@pieandcakes I sent log via email.
Maratk1n
on 16 Aug 2019
This notification/pop-up is shown every time an an assert is triggered in my current project. (VSCode, Win10, VS2017 compiler). Since I don't have access to MS internal libs code, I'd prefer to be able to disable these messages. Maybe a setting per project?
 mattiasljungstrom
on 2 Sep 2019
mattiasljungstrom
on 2 Sep 2019
@mattiasljungstrom Suppression per project would need to be a VS Code level item because that dialog does not send anything back to the debugAdapter. We don't check for the existence of a file and we need to return a path to VS Code. If we checked for the validity of each file during debugging, I expect debugging to slow down considerably.
pieandcakes
on 4 Sep 2019
@pieandcakes Thanks for the reply. I don't know what the solution is, but the current user experience is not great. It's not uncommon to debug projects where parts of the source code is not available. (commercial libraries, or system libraries.)
mattiasljungstrom
on 4 Sep 2019
@Maratk1n Thx, this solved my problem
 mtt0
on 11 Sep 2019
mtt0
on 11 Sep 2019
To have a 'Just My Code'-Feature in vscode is still highly desirable as so many poeple affect this scenario
daniel-brosche
on 11 Sep 2019
I desperately need a solution to this issue. GDB's skip command doesn't work at all.
"text": "skip -gfi /usr/include/c++/8.2.0/bits/*.h",
 ismailhkose
on 30 Sep 2019
ismailhkose
on 30 Sep 2019
@pieandcakes
It seems VSCode do not use next command in GDB, and uses step command. This behavior need to be fixed in VSCode.
ismailhkose
on 30 Sep 2019
@ismailhkose we support next when you perform a step-over command (F10) versus a step which is a step-in command (F11).
pieandcakes
on 2 Oct 2019
@Maratk1n
I use similar solution.
Firstly, install sources:$ sudo apt install glibc-source $ cd /usr/src/glibc $ sudo tar xvf glibc-2.27.tar.xzThen make link for folders using
sourceFileMapinlaunch.json:"sourceFileMap": { "/build/glibc-OTsEL5": "/usr/src/glibc" },
If running Visual Studio Code on windows and accessing Linux on WSL then the "sourceFileMap" should be changed to:
"/build/glibc-LK5gWL": "C:\Users\<
or similar. The above is for Ubuntu.
This change worked for me. The linux styled path in the OP was confusing the VSC for windows application.
 RichardEWillis
on 8 Oct 2019
RichardEWillis
on 8 Oct 2019
From the C++ side of things, if I'm debugging and I step into a file I don't have the source for, I'd prefer to just see disassembly view and continue stepping there. (Just like in real Visual Studio - with right-click menus to switch between the two - when source is available.)
From the VSCode point of view, I'd like to be able to disable this feature completely whether I'm debugging or not. In the (extremely) rare instances when the file view isn't up-to-date (please make refreshing automatic) a standard error box saying the file doesn't exist is sufficient.
 crazydef
on 27 Nov 2019
crazydef
on 27 Nov 2019
I encountered the same problem and I solved it by adding
"miDebuggerPath": "/usr/bin/gdb"
in my launch.json
 leond08
on 14 Apr 2020
leond08
on 14 Apr 2020
I tried this in my simple example without complete success:
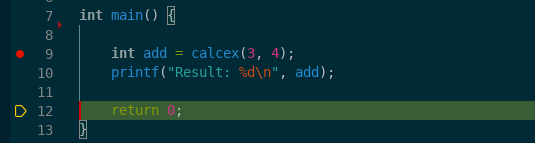
However stepping over the last return statement does still show the annoying message.
Therefore the miDebuggerPath setting is in my case not the solution.
However I had some success by using the gdb skip command.
For example stepping into printf will produce this error:
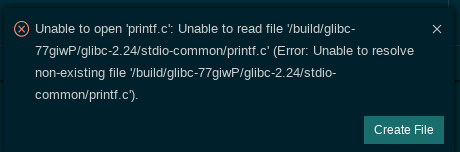
Before stepping into printf I have executed in the vscode debug console:
-exec skip file printf.c
After this command the error message does not appear when I tried to step into printf.
New GDB versions (7.12) supports file globbing to specify the files to skip in the debugger.
In my case I was able to ignore all stdio-common files by executing:
-exec skip -gfi stdio-common/*.c
The skip command seems to be deactivated when a Breakpoint is activated in the skipped file.
The skip commands can be executed in a .gdbinit file or even in the launch-configuration as described above.
 "setupCommands": [
                {
                    "description": "Enable pretty-printing for gdb",
                    "text": "-enable-pretty-printing",
                    "ignoreFailures": true
                },
                {
                    "description": "Skip stdio-common files",
                    "text": "-interpreter-exec console \"skip -gfi stdio-common/*.c\""
                }
            ]
However I seems to be impossible to skip in all situations like libc-start.c and therefore it seems to impossible to suppress all error message by using just the gdb skip commands.
But at least in some scenarios it should work.
I think it would be helpful when the launch-configuration would support a skip-configuration which then configures gdb or lldb accordingly, like:
 "skip": [
               "printf.c",
               "stdio-common/*.c"
            ],
Additionally vscode could use this setting to suppress error message or handle error scenarios internally.
daniel-brosche
on 15 Apr 2020
I use similar solution.
Firstly, install sources:$ sudo apt install glibc-source $ cd /usr/src/glibc $ sudo tar xvf glibc-2.27.tar.xzThen make link for folders using
sourceFileMapinlaunch.json:"sourceFileMap": { "/build/glibc-OTsEL5": "/usr/src/glibc" },
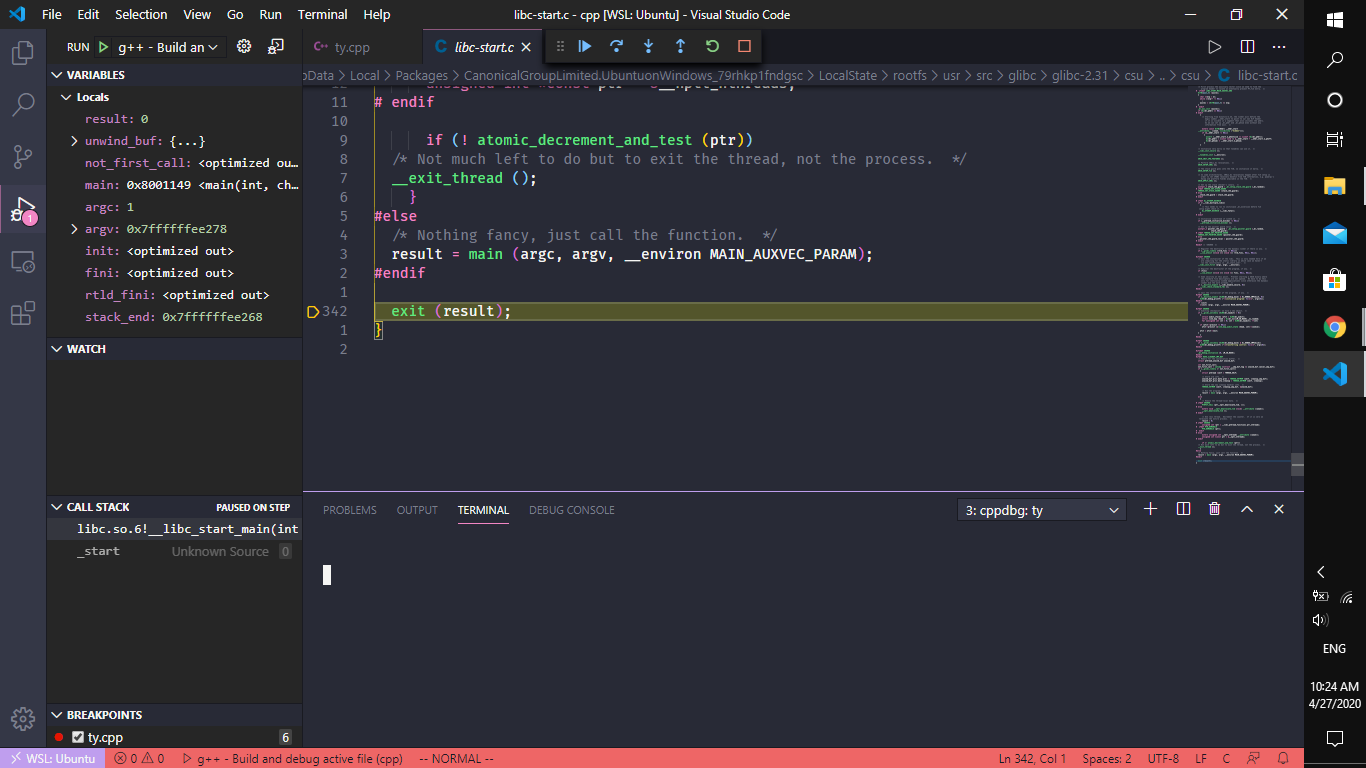
This worked for me, but after I got out of the main function, I went back to libc-start.c.
How to ignore it.
"version": "0.2.0",
    "configurations": [
        {
            "name": "g++ - Build and debug active file",
            "type": "cppdbg",
            "request": "launch",
            "program": "${fileDirname}/${fileBasenameNoExtension}",
            "args": [],
            "stopAtEntry": false,
            "cwd": "${workspaceFolder}",
            "environment": [],
            "externalConsole": false,
            "MIMode": "gdb",
            "setupCommands": [
                {
                    "description": "Enable pretty-printing for gdb",
                    "text": "-enable-pretty-printing",
                    "ignoreFailures": true
                }
            ],
            "preLaunchTask": "g++ build active file",
            "miDebuggerPath": "/usr/bin/gdb",
            "sourceFileMap": {
                "/build/glibc-YYA7BZ": "C:/Users/nguye/AppData/Local/Packages/CanonicalGroupLimited.UbuntuonWindows_79rhkp1fndgsc/LocalState/rootfs/usr/src/glibc"
            }
        }
    ]
}
 TyNguyen2k1
on 27 Apr 2020
TyNguyen2k1
on 27 Apr 2020
I opened this two and a half years ago and still no real solution sadly. I've come to the conclusion that while VSC is good for somethings, actually running and debugging code isn't one of them. It's far too cumbersome with having to manually create launch files and what not.
DigiAngel
on 27 Apr 2020
I tried also several things and for me this problem only appears when I debug with the gdb.
As @daniel-brosche described, it is possible to instruct the gcc to skip files, which can solve this problem regarding missing files in many situations.
E.g. when stepping into std::div:
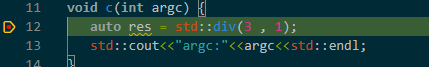
The following error pops up (I'm also using the remote ssh plugin):
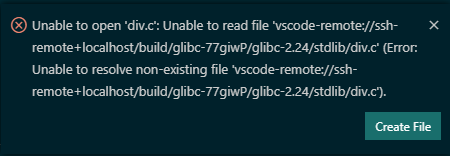
By executing the following gdb command all stdlib related files will be ignored / skipped and therefore no error pops up:
-exec skip -gfi stdlib/*.c
Here my debug configuration to use gdb and to skip all stdlib/*c files:
{
            "name": "Launch MS CPP GDB",
            "type": "cppdbg",
            "request": "launch",
            "program": "${workspaceRoot}/build/my_app",
            "args": [],
            "stopAtEntry": false,
            "cwd": "${workspaceFolder}",
            "environment": [],
            "externalConsole": false,
            "MIMode": "gdb",
            "setupCommands": [
                {
                    "description": "Enable pretty-printing for gdb",
                    "text": "-enable-pretty-printing",
                    "ignoreFailures": true
                },
                {
                    "description": "Skip stdio-common files",
                    "text": "-interpreter-exec console \"skip -gfi stdlib/*.c\""
                }
            ],
            "miDebuggerPath": "/usr/bin/gdb"
        },
Alternatively it is possible to load the skip commands via the .gdbinit-File.
Obviously it is a bit easier to maintain when many gdb commands are needed.
I figured out, that loading the .gdbinit file by passing the path of the .gdbinit file as gdb argument is quite reliable (depending on the local/systemwide configuration the auto-loading can be declined -> for more information about this security protection see the
"Auto-loading safe path" section in the GDB manual).
Over this way, I can also switch easily between configurations.
Here the content of my .gdbinit file which I mostly save in the workspace directory:
skip -gfi stdlib/*.c
Here my debug configuration to reliably load the .gdbinit file:
 {
            "name": "Launch MS CPP GDB with gdbinit",
            "type": "cppdbg",
            "request": "launch",
            "program": "${workspaceRoot}/build/my_app",
            "args": [],
            "stopAtEntry": false,
            "cwd": "${workspaceFolder}",
            "environment": [],
            "externalConsole": false,
            "MIMode": "gdb",
            "miDebuggerArgs": "-x ${workspaceFolder}/.gdbinit",
            "setupCommands": [
                {
                    "description": "Enable pretty-printing for gdb",
                    "text": "-enable-pretty-printing",
                    "ignoreFailures": true
                }
            ],
            "miDebuggerPath": "/usr/bin/gdb"
        }
I have also notived that when I debug with the lldb this problem does not appear at all (out of the box), no matter what debug extension I use (MS CPP, Native Debug, CodeLLDB).
Here my debug configuration to use lldb via vscode-cpptools:
{
            "name": "Launch MS CPP LLDB",
            "type": "cppdbg",
            "request": "launch",
            "program": "${workspaceRoot}/build/my_app",
            "args": [],
            "stopAtEntry": false,
            "cwd": "${workspaceFolder}",
            "environment": [],
            "externalConsole": false,
            "MIMode": "lldb"
},
So I can highly recommend to use the lldb or using the gdb skip commands.
humanosc
on 23 May 2020
From the C++ side of things, if I'm debugging and I step into a file I don't have the source for, I'd prefer to just see disassembly view and continue stepping there. (Just like in real Visual Studio - with right-click menus to switch between the two - when source is available.)
I agree it should behave just like VS once #206 is implemented.
In the meantime maybe this error popup could be changed to auto-close after a few seconds.
 Trass3r
on 21 Jul 2020
Trass3r
on 21 Jul 2020
I use similar solution.
Firstly, install sources:$ sudo apt install glibc-source $ cd /usr/src/glibc $ sudo tar xvf glibc-2.27.tar.xzThen make link for folders using
sourceFileMapinlaunch.json:"sourceFileMap": { "/build/glibc-OTsEL5": "/usr/src/glibc" },
This solution didn't work for me. I am using Ubuntu 20.04 LTS and VS Code 1.48.2.
Here is my launch.json looks like:
{
    // Use IntelliSense to learn about possible attributes.
    // Hover to view descriptions of existing attributes.
    // For more information, visit: https://go.microsoft.com/fwlink/?linkid=830387
    "version": "0.2.0",
    "configurations": [
        {
            "name": "g++ - Build and debug active file",
            "type": "cppdbg",
            "request": "launch",
            "program": "${fileDirname}/${fileBasenameNoExtension}",
            "args": [],
            "stopAtEntry": false,
            "cwd": "${workspaceFolder}",
            "environment": [],
            "externalConsole": false,
            "MIMode": "gdb",
            "setupCommands": [
                {
                    "description": "Enable pretty-printing for gdb",
                    "text": "-enable-pretty-printing",
                    "ignoreFailures": true
                }
            ],
            "preLaunchTask": "C/C++: g++ build active file",
            "miDebuggerPath": "/usr/bin/gdb",
            "sourceFileMap": {
                "/build/glibc-YYA7BZ": "/usr/src/glibc"
            }
        }
    ]
}
And here is my c_cpp_properties.json looks like:
{
    "configurations": [
      {
        "name": "Linux",
        "includePath": ["${workspaceFolder}/**"],
        "defines": [],
        "compilerPath": "/usr/bin/g++",
        "cStandard": "c11",
        "cppStandard": "c++17",
        "intelliSenseMode": "gcc-x64"
      }
    ],
    "version": 4
  }
And my tasks.json file looks like the following:
{
    "version": "2.0.0",
    "tasks": [
        {
            "type": "shell",
            "label": "C/C++: g++ build active file",
            "command": "/bin/g++",
            "args": [
                "-g",
                "${file}",
                "-o",
                "${fileDirname}/${fileBasenameNoExtension}"
            ],
            "options": {
                "cwd": "${workspaceFolder}"
            },
            "problemMatcher": [
                "$gcc"
            ],
            "group": {
                "kind": "build",
                "isDefault": true
            }
        }
    ]
}
And the following error message is displayed when I am debugging:
Unable to open 'exit.c': Unable to read file '/usr/src/glibc/glibc-2.31/stdlib/exit.c' (Error: Unable to resolve non-existing file '/usr/src/glibc/glibc-2.31/stdlib/exit.c').
Unable to open 'libc-start.c': Unable to read file '/usr/src/glibc/glibc-2.31/csu/libc-start.c' (Error: Unable to resolve non-existing file '/usr/src/glibc/glibc-2.31/csu/libc-start.c').
Any idea?
 aliyyousuff
on 27 Aug 2020
aliyyousuff
on 27 Aug 2020
In the meantime it could be resolved by setting Source.PresentationHintValue.Deemphasize.
Trass3r
on 27 Aug 2020
In the meantime it could be resolved by setting
Source.PresentationHintValue.Deemphasize.
How could it be done? Could you please explain more?
aliyyousuff
on 27 Aug 2020
This was referring to an internal fix until disassembly debugging is ready.
If you want to use that you'd have to compile MIEngine yourself and put the files into ~/.vscode-server/extensions/ms-vscode.cpptools-*/debugAdapters/bin.
Trass3r
on 27 Aug 2020
Can this problem be resolved if the files that are unable to be opened are in C standard library?
 Xiaohong-Deng
on 21 Sep 2020
Xiaohong-Deng
on 21 Sep 2020
Doesn't matter where they come from.
Will be fixed with microsoft/MIEngine#1038.
Trass3r
on 21 Sep 2020
This issue has been closed automatically because it's labeled as 'external'.
![github-actions[bot] picture](https://avatars2.githubusercontent.com/in/15368?v=4&s=40) github-actions[bot]
on 9 Dec 2020
github-actions[bot]
on 9 Dec 2020
gcc flag -save-temps autogenerates all .S files required
---- tasks.json ----
{
    "tasks": [
        {
            "type": "cppbuild",
            "label": "C/C++: gcc build active file",
            "command": "/usr/bin/gcc",
            "args": [
                "-g",
                "-save-temps",
                "*.c",
                "-o",
                "${fileDirname}/lisp"
            ],
            "options": {
                "cwd": "${workspaceFolder}"
            },
            "problemMatcher": [
                "$gcc"
            ],
            "group": {
                "kind": "build",
                "isDefault": true
            },
            "detail": "Task generated by Debugger."
        }
    ],
    "version": "2.0.0"
}
 funcelot
on 25 Dec 2020
funcelot
on 25 Dec 2020
Related issues
 ecbrodie
·
3Comments
ecbrodie
·
3Comments
 thndrwrks
·
3Comments
thndrwrks
·
3Comments
 jheinzel
·
3Comments
jheinzel
·
3Comments
 BDZNH
·
3Comments
BDZNH
·
3Comments
 vicatcu
·
3Comments
vicatcu
·
3Comments
Most helpful comment
I use similar solution.
Firstly, install sources:
Then make link for folders using
sourceFileMapinlaunch.json: