Vscode-cpptools: Cannot inspect the content of STL containers in debugger
Currently when I tried to inspect a STL container or a C++ string, the debugger are not able to provide useful information such as the content of a STL vector or string variable. As shown in the screenshot, I have a pretty printer registered to .gdbinit and I'm able to use -exec print v to see the content of a vector (even a string), but it seems the VSCode debugger doesn't know them.

It will be helpful when debugging if the debugger provides such features :)
 hungys
All 38 comments
@hungys, sorry for the delayed response. Try typing "-exec set print pretty" in the debug console. This will turn on pretty printing for gdb. We turned it off by default because of performance issues.
 delmyers
on 6 Jul 2016
delmyers
on 6 Jul 2016
The option pretty print only affect the way how gdb print structures.
The output in Varaiables windows remains unaffected.
 dmazuronak
on 7 Jul 2016
dmazuronak
on 7 Jul 2016
I'm seeing the same thing, it would be really nice if VSCode could use the pretty printers when show STL variables in mouse hovers and the Watch window.
 mschuckmann
on 7 Jul 2016
mschuckmann
on 7 Jul 2016
Type "-exec -enable-pretty-printing" in the debug console.
 paulmaybee
on 14 Jul 2016
paulmaybee
on 14 Jul 2016
@delmyers @paulmaybee Thanks. It works now with -exec -enable-pretty-printing.
Btw, can we set it as the default configurations, or is there any roadmap to add this feature? Seems that we need to type that command in the debug console every time.

hungys
on 15 Jul 2016
Yes works for me too and I second the need for some way to set it as the default configuration or event some way to provide a list of command gdb at launch.
I tried adding it my ~/.gdbinit file and it doesn't seem to work.
mschuckmann
on 15 Jul 2016
You can setup initial gdb commands this way in the launch.json
            "linux": {

                "MIMode": "gdb",

                "setupCommands": [

                    { "text": "-enable-pretty-printing", "description": "enable pretty printing", "ignoreFailures": true },

                    { "text": "handle SIGPIPE nostop noprint pass", "description": "ignore SIGPIPE", "ignoreFailures": true }
                ]
            },
 filipsky
on 26 Oct 2016
filipsky
on 26 Oct 2016
@filipsky
That's great, where did you find this documented?
Also where in the launch.json file does this block?
mschuckmann
on 26 Oct 2016
I found it here {just search for setupCommands on the page):
https://github.com/Microsoft/vscode-cpptools/blob/master/launch.md
I have added the setupCommands block in my OS specific ("linux": {} in my case) branch
Best, Honza
filipsky
on 26 Oct 2016
Thank you, I figured out that it works if the OS specific block is in the
configuration block, which means it has to be repeated for each
configuration, not terrible.
Also thank you for the link.
Matt S.
On Wed, Oct 26, 2016 at 9:27 AM filipsky [email protected] wrote:
I found it here {just search for _setupCommands_ on the page):
https://github.com/Microsoft/vscode-cpptools/blob/master/launch.mdI have added the setupCommands block in my OS specific ("linux": {} in my
case) branchBest, Honza
—
You are receiving this because you commented.
Reply to this email directly, view it on GitHub
https://github.com/Microsoft/vscode-cpptools/issues/69#issuecomment-256403336,
or mute the thread
https://github.com/notifications/unsubscribe-auth/APF3Sgmi-jnWvDL6nF8T86aiJTPIi8ncks5q33-HgaJpZM4IztDQ
.
Matt S.
mschuckmann
on 27 Oct 2016
macOS for lldb
have any function?
 yoyo930021
on 27 Jan 2017
yoyo930021
on 27 Jan 2017
@yoyo930021 If you download our new version, cpptools 0.10.0 , we have enabled the python pretty printers on macOS. You can also look at natvis and write your own visualizer file which we also support.
 pieandcakes
on 2 Feb 2017
pieandcakes
on 2 Feb 2017
This issue should be resolved as we have added the gdb pretty printer commands by default in the launch.json file. Please comment/reopen if this is still an issue.
pieandcakes
on 2 Feb 2017
Hi, how do I set up pretty printing for VS Code? I'm running GDB on Cygwin (Windows 10) . Specifically, I don't understand what to do with said ".gdbinit" file. Thank you very much!
 jhscsc
on 1 Feb 2018
jhscsc
on 1 Feb 2018
@jhscsc If you are using the default pretty-printers you don't need to do anything with a .gdbinit file. If you want to extend and add your own pretty-printers, you will need to create a .gdbinit file. Since that is a gdb feature and not one provided by the extension, you may need to do some searching online for the file format. On Windows, that should go in the root of your home directory c:\users\<username>.
In your launch.json you should see:
"setupCommands": [

                    { "text": "-enable-pretty-printing", "description": "enable pretty printing", "ignoreFailures": true }
]
If not, then add that and it should tell gdb to enable pretty-printing. This does rely on your version of gdb shipping the Python script files that tell it how to visualize the STL objects.
pieandcakes
on 1 Feb 2018
Thank you for your quick response. I currently have that snippet in my launch.json; however, when I type -exec print v in the example program shown below, I'm still unable to look into the vector. Do you have any suggestions on how to get it to work?

jhscsc
on 1 Feb 2018
If you expand the variable in your locals, does it show a formatted value? -exec print v is telling gdb to print v. It could be you are missing the Python files that do the formatting, and if that is the case you may need to figure out where they come from. My experience with Cygwin gdb is limited. It looks like according to the answer on this link that you need to do additional work to get the files.
pieandcakes
on 1 Feb 2018
Installing gcc-debuginfo like the link instructed enabled formatting when looking in STL containers in locals - that's what I was going for. Thanks so much @pieandcakes!
jhscsc
on 2 Feb 2018
I am using gdb 8.0.1 on my PC, and if I use gdb from command line, it can print the inner content of the STL classes correctly. But when I am using vscode, both -exec print v and the variables window will not show the inner content. What should I do? Thx
OS: Arch Linux
VSCode Version 1.19.3
cpptools Version 0.14.6
No ~/.gdbinit file and /etc/gdb/gdbinit is empty.
"pretty printing" is enable in launch.json just as mentioned above.
 Snape3058
on 2 Feb 2018
Snape3058
on 2 Feb 2018
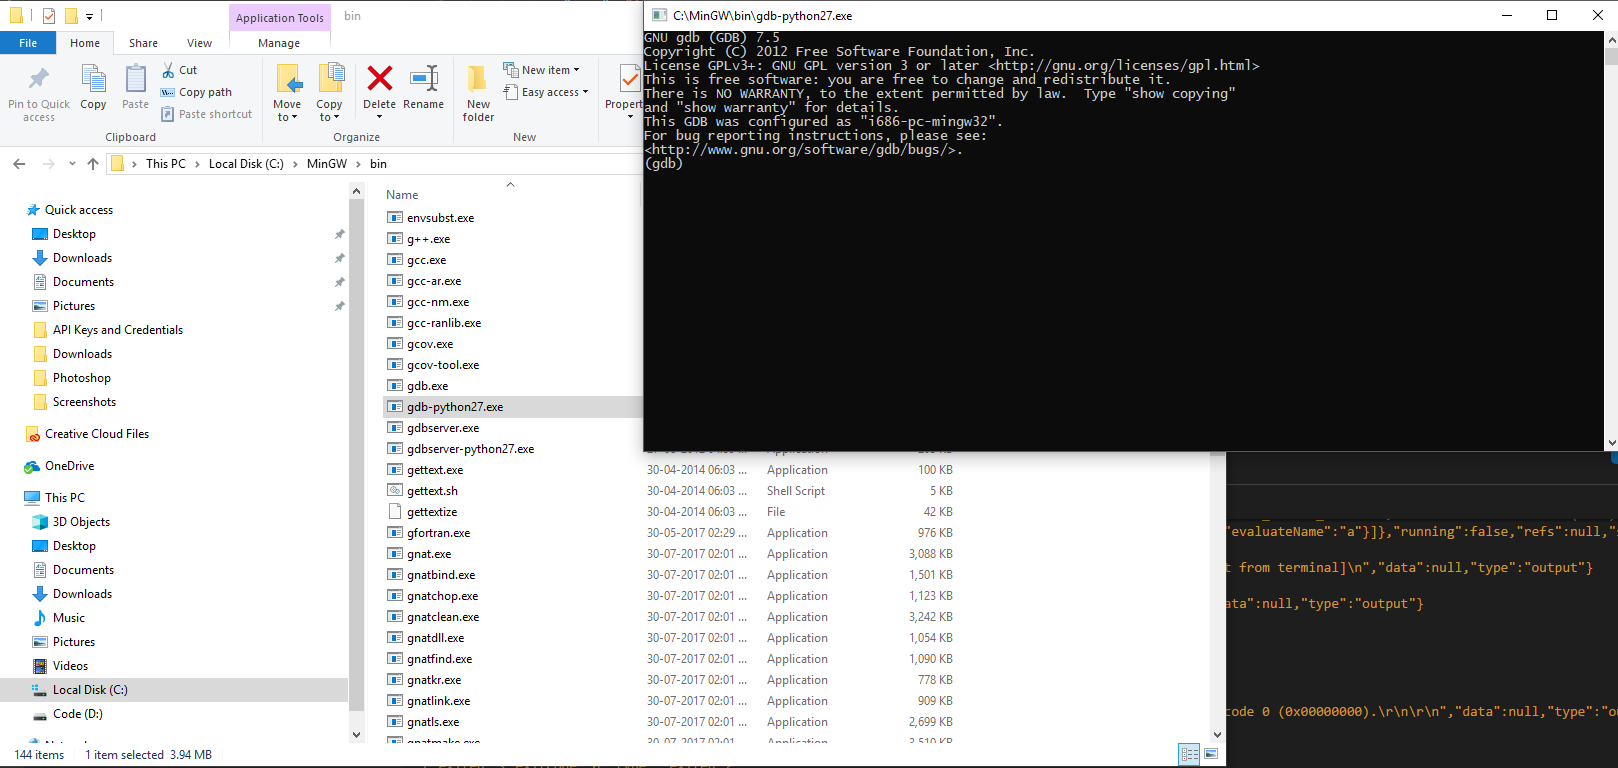
I tried all the steps in this github issue. I am using the MinGW compiler and I made sure to install the mingw32-gdb-python package via the MinGW Installation Manager which I assume is required to view the STL container. After all that. All I can see is this

I have Python 3.6. Do I seriously need to install Python 2.7 ? IS there a solution that uses Python 3 ? :/
Update
I have installed Python 2.7 and gdb-python.exe is running fine right now (also followed the additional steps from this stackoverflow question). I still can't look at the STL vector
Also this is the command I am using to build the C++ executable : g++ '${file}' -g -o out
 DollarAkshay
on 3 Feb 2018
DollarAkshay
on 3 Feb 2018
@DollarAkshay That looks correct.
To be clear: Pretty printing is something that gdb provides, although from this thread it looks like it isn't the same across different implementations. Your question about which version of Python should probably be asked to MinGW as that is the tool set that you are using and they control the dependencies for the toolset? From searching online, it looks like the MinGW pretty-printing is a lot harder to setup and you will need to set "miDebuggerPath" to point to the python version of gdb in your launch.json.
The document I found that sort of explains some steps for MinGW is here, scroll to the section labeled "This is for MinGW users...".
pieandcakes
on 5 Feb 2018
@Snape3058 The only documentation I found is this. I don't know if that is something you can check/verify/try but that might get you started in the right direction.
pieandcakes
on 5 Feb 2018
@pieandcakes Okay. I finally switched to Cygwin GDB and installed the gcc-debuginfo. It works on windows now 😄 Thank you.
Now it shows only the basic array for a vector. If I want it to show like the capacity, size and other data members, like how VisualStudio does it, I will have to use a custom .gdbinit file ?
DollarAkshay
on 5 Mar 2018
@DollarAkshay I assume so. We don't do anything special for visualization so it is whatever gdb provides us through pretty printing. There may be some expression shortcuts that you can find online that might give you what you are looking for too that you can add to the watch pane.
pieandcakes
on 5 Mar 2018
I've also encountered this problem on Debian, however, the solution is to install the GDB package which is linked to python2.
When you install the gdb package with apt, you install gdb-minimal which isn't linked against python. You need to install the gdb-python2 package.
On newer GCC/GDB versions (I'm using 8.2.0/8.1) you no longer need a .gdbinit file, unless you need something custom.
 rszibele
on 15 Nov 2018
rszibele
on 15 Nov 2018
It doesn't show STL container accurately on the variable window.
For example, I added two strings to vector and it stills show "size: 0" in the variables window as seen in the following screenshot.

 ismailhkose
on 6 Jan 2019
ismailhkose
on 6 Jan 2019
@ismailhkose Can you include a log? This looks like a pretty printing issue within the debugger you are using but the log would show us what we are getting back from gdb.
pieandcakes
on 7 Jan 2019
I'm getting this issue on MacOS 10.13.6 with Python 3.6.5, LLDB 1000.11.38.2 and C/C++ extension 0.21.0. When I put -exec -enable-pretty-printing into the debug console, I get the following:
result-class: done
supported: 0
I'm assuming this means my version of LLDB doesn't support pretty printing? Is there anything else I'd need to download?
 x6herbius
on 28 Feb 2019
x6herbius
on 28 Feb 2019
@Snape3058 The only documentation I found is this. I don't know if that is something you can check/verify/try but that might get you started in the right direction.
It is the -static compiler parameter that makes gdb not able to recognize the STL objects. Thank you for your reply.
Snape3058
on 11 Mar 2019
@x6herbius the pretty printing command is a feature of gdb and not lldb.
pieandcakes
on 2 May 2019
Pretty printing is not working for me. I am using gdb in ubuntu.

 knayan111
on 21 Feb 2020
knayan111
on 21 Feb 2020
@knayan111 Please run info pretty-printer in gdb and let me know if you have them installed.
pieandcakes
on 26 Feb 2020
This also happens to me. I am using mac 10.14.6, with vscode 1.42, c/c++ plugin is 0.26.3, gdb 8.3. I cannot see the content of any STL containers, this is awful.

@pieandcakes, is there any suggestion to help me solve the problem ?
 JinLingChristopher
on 27 Feb 2020
JinLingChristopher
on 27 Feb 2020
@knayan111 @JinLingChristopher In reading this StackOverflow article it looks like you are missing the stl pretty printers. You will need to figure out where you can get those for the gdb you are using. Unfortunately I don't know where that would be.
I would expect something like libstdc++ or something to show up in your pretty printer list with references to std:: namespace items.
This article might also give you some hints on how to get it for macOS and its limitations depending on the compiler (gcc vs clang).
pieandcakes
on 27 Feb 2020
This issue is not resolved at all, please reopen. Even with the pretty printer setting in launch.json, stl containers are still not readable.
 jaques-sam
on 16 Apr 2020
jaques-sam
on 16 Apr 2020
@jaques-sam Can you paste your output for info pretty-printer in gdb? My previous comment shows that if you can't resolve stl containers, your installation of gdb is most likely missing the actual pretty printers.
pieandcakes
on 17 Apr 2020
Not working+1, my gdb launch.json looks like this:
{
    "version": "0.2.0",
    "configurations": [
        {
            "name": "(gdb) Launch",
            "type": "cppdbg",
            "request": "launch",
            "program": "${workspaceFolder}/src/target",
            "args": ["-x4", "-k12M"],
            "stopAtEntry": false,
            "cwd": "${workspaceFolder}",
            "environment": [],
            "externalConsole": false,
            "MIMode": "gdb",
            "setupCommands": [
                {
                    "description": "Enable pretty-printing for gdb",
                    "text": "-enable-pretty-printing",
                    "ignoreFailures": true
                }
            ]
        }
    ]
can't not display the contents of stl, using vscode on winodows 10 using WSL 2
 yueyingjuesha
on 26 Aug 2020
yueyingjuesha
on 26 Aug 2020
@yueyingjuesha From what source did you installed your gdb? I'm using Mingw-w64 8.1.0.0 with Windows 10 and VSCode stable + cpptools stable and have no issue. I'm also using WSL 2 and ArchLinux with all latest packages and still no issue.
    {
      "name": "Clang++: Current file",
      "type": "cppdbg",
      "request": "launch",
      "program": "${fileDirname}/${fileBasenameNoExtension}.exe",
      "cwd": "${workspaceFolder}",
      "setupCommands": [
        {
          "description": "Enable pretty-printing for gdb",
          "text": "-enable-pretty-printing",
          "ignoreFailures": true
        }
      ],
      "preLaunchTask": "clang++ build active file"
    }
 escape0707
on 26 Aug 2020
escape0707
on 26 Aug 2020
Related issues
 DemoCrazer
·
3Comments
DemoCrazer
·
3Comments
 jyavenard
·
3Comments
jyavenard
·
3Comments
 narutse
·
3Comments
narutse
·
3Comments
 montery8
·
3Comments
montery8
·
3Comments
 SkyRiderMike
·
3Comments
SkyRiderMike
·
3Comments
Most helpful comment
Type "-exec -enable-pretty-printing" in the debug console.