Visdom: how to plot multiple line seperately on one window
I use visdom to plot train loss, I start many processes in different configurations to train model, and I want to plot multiple curve of train loss in one window for comparing different model to choose the best model parameters,Could I use visdom to do this?
 lixinsu
All 9 comments
Hi @lixinsu - do you mean you want to plot multiple lines separately in different plots in the same window? (something like matlab's subplots?) Or plot multiple traces on the same plot in a window?
We don't support the former currently, but to get the desired behavior for that I'd suggest using multiple windows with a tag in the titles, this way you can filter by that tag and see them all.
To plot multiple curves on the same axes you can determine the window name you want to use, and then use viz.line(... win=<window_name>, update='append', name=<trace_name>) for each trace.
Alternately, after https://github.com/facebookresearch/visdom/pull/283 is in you can plot all the relevant data for each experiment in its own env and then use the compare features to show the data on the same plot without needing to plot from different places into the same window.
 JackUrb
on 14 Mar 2018
JackUrb
on 14 Mar 2018
thanks, I just ask for ploting multiple curves on the same axes, but I found that the code
below
viz = Visdom(port=8093)
win = viz.line(
X=np.column_stack([np.arange(0, 1) for i in range(10)]),
Y=np.column_stack([np.arange(0, 1) for i in range(10)]),
win="test"
)
viz.line(
X=np.arange(1, 38),
Y=np.random.randn(37),
win="test",
name='6',
update='append',
)
viz.line(
X=np.arange(1, 38),
Y=np.random.randn(37),
win="test",
name='11',
update='append',
)
generate the axes as following
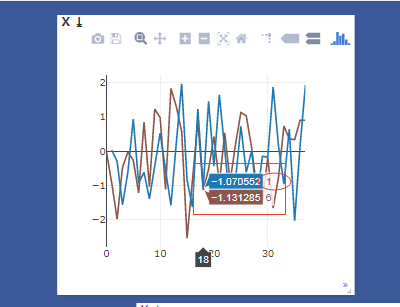
the second line ,I name it as 11, but in the graph it names 1?
lixinsu
on 14 Mar 2018
is it a bug ,or I make a mistake in the usage
lixinsu
on 14 Mar 2018
Are you using the pypi version of visdom or the one installed from source here? The naming issue is fixed in version 0.1.7.1
JackUrb
on 14 Mar 2018
That version hasn't been released yet as it breaks some behavior for proxies and I'm waiting to fix it before I release. You can use easy_install . or python setup.py install after cloning the git repo to install from source.
JackUrb
on 14 Mar 2018
I use visdom (0.1.7) installed from master branch
lixinsu
on 14 Mar 2018
thanks
lixinsu
on 14 Mar 2018
I install 0.1.7.2 from master branch, but the program still give the above result
lixinsu
on 14 Mar 2018
As in it's giving the second trace the name "1"? What happens if you enable a legend? Can you try swapping the order of the appends and seeing if you get "11" and "1"?
JackUrb
on 14 Mar 2018
Related issues
 cympfh
·
6Comments
cympfh
·
6Comments
 pedropgusmao
·
3Comments
pedropgusmao
·
3Comments
 wj926
·
7Comments
wj926
·
7Comments
 skrish13
·
4Comments
skrish13
·
4Comments
 TheShadow29
·
5Comments
TheShadow29
·
5Comments
Most helpful comment
Hi @lixinsu - do you mean you want to plot multiple lines separately in different plots in the same window? (something like matlab's subplots?) Or plot multiple traces on the same plot in a window?
We don't support the former currently, but to get the desired behavior for that I'd suggest using multiple windows with a tag in the titles, this way you can filter by that tag and see them all.
To plot multiple curves on the same axes you can determine the window name you want to use, and then use
viz.line(... win=<window_name>, update='append', name=<trace_name>)for each trace.Alternately, after https://github.com/facebookresearch/visdom/pull/283 is in you can plot all the relevant data for each experiment in its own env and then use the compare features to show the data on the same plot without needing to plot from different places into the same window.