Bugs and Questions
Checklist
[x] This is not a
victory-nativespecific issue. (Issues that only appear invictory-nativeshould be opened here)[x] I have read through the FAQ and Guides before asking a question
[x] I am using the latest version of Victory
[x] I've searched open issues to make sure I'm not opening a duplicate issue
Reproducing the issue: -
data={[
{x: "JAN", y: 0},
{x: "FEB", y: 0},
{x: "MAR", y: 0},
{x: "APR", y: 0},
{x: "MAY", y: 0},
{x: "JUN", y: 0},
{x: "JUL", y: 0},
{x: "AUG", y: 0},
{x: "SEP", y: 100},
{x: "OCT", y: 0},
{x: "NOV", y: 0},
{x: "DEC", y: 0}
]}
/>
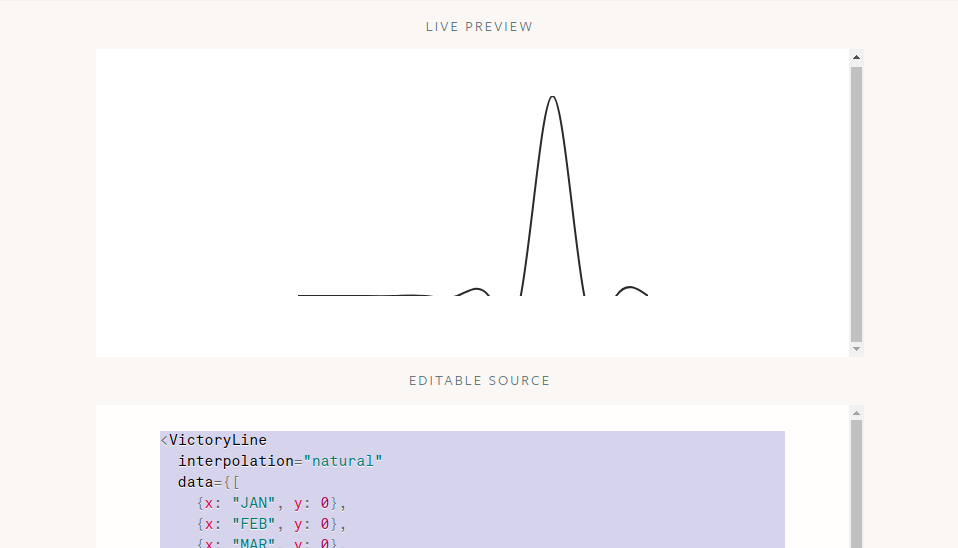
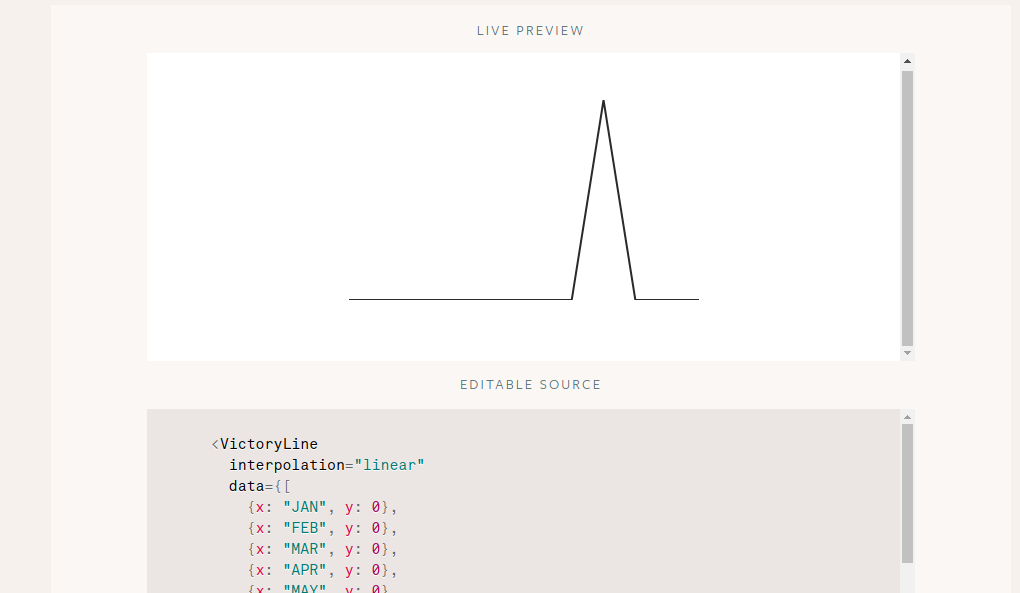
The line is going below axis however expected behaviour is correct when interpolation is set to "linear"
 Harsh1796
All 2 comments
@Harsh1796
Victory calculates a default domain based on data, and does not take the position of the interpolated path into account.
The issue you're seeing can be addressed in a few ways:
1) choose a different interpolation method that creates a path that is more faithful to your data. I suggest monotoneX It looks like this:
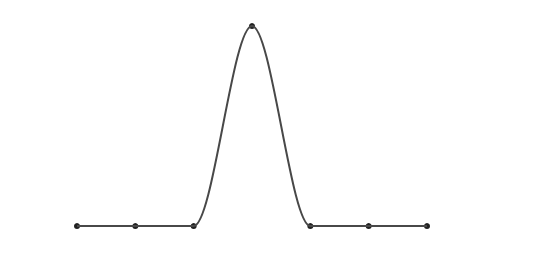
instead of (natural):
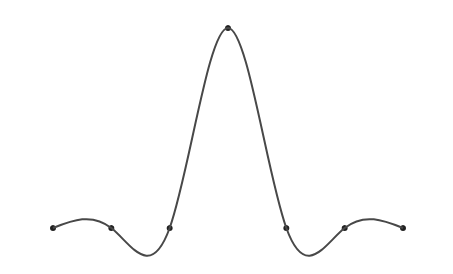
2) use groupComponent={<g/>} on VictoryLine so that the path is not clipped. (This method will not work if you have an animating line with changing numbers of data points)
3) set a minDomain that will accommodate the discrepancy between the points and the path.
 boygirl
on 11 Sep 2018
boygirl
on 11 Sep 2018
Changing "natural" to "monotoneX" works well!
Harsh1796
on 12 Sep 2018
Related issues
 iffy
·
5Comments
iffy
·
5Comments
 danielberndt
·
4Comments
danielberndt
·
4Comments
 tylermassey
·
5Comments
tylermassey
·
5Comments
 timhwang21
·
4Comments
timhwang21
·
4Comments
 esutton
·
6Comments
esutton
·
6Comments
Most helpful comment
@Harsh1796
Victory calculates a default domain based on data, and does not take the position of the interpolated path into account.
The issue you're seeing can be addressed in a few ways:
1) choose a different interpolation method that creates a path that is more faithful to your data. I suggest
monotoneXIt looks like this:instead of (
natural):2) use
groupComponent={<g/>}onVictoryLineso that the path is not clipped. (This method will not work if you have an animating line with changing numbers of data points)3) set a
minDomainthat will accommodate the discrepancy between the points and the path.