Victory-native: VictoryChart - Plotting Time series in X axis
I am trying to plot dates as x axis for Victory Chart and VictoryLine plot.
I red the Brush and Zoom example and also the issue "Using dates as x axis for VictoryChart" posted here, although none of them solved my problem.
I am getting dates in the "unix" format from a database, so my data is comming like this -->
{ "x": 1553319197, "y": 1}, { "x": 1553319198, "y": 1} , { "x": 1553319199, "y": 1} , { "x": 1553319200, "y": 1} ..........
I set the scale of VictoryChart properly --> scale={{x: 'time', y:'linear'}}
Happens that the x axis appears to be ":25 :30 :40 :45 :50" as shown in the attached image:
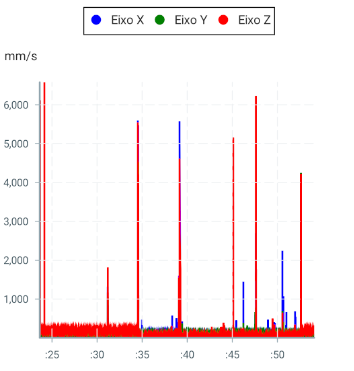
Another important thing to mention is that the user can set the range of dates to be available, so the graph can be plotted for 01 month, 7days and 1day. Therefore the visualization of the x axis in 1 month might be different than 1 day.
Plotting dates of 01 month, the user should see days.
Plotting dates of 01 day, the user shoud see hours.
Can anyone help me with that?
Best regards,
 guiamuchastegui
All 2 comments
@guiamuchastegui you will want to use the tickFormat prop on VictoryAxis to format your dates. You can read about it here: https://formidable.com/open-source/victory/docs/victory-axis#tickformat
 boygirl
on 26 Mar 2019
boygirl
on 26 Mar 2019
@boygirl thanks for the answer.
I solved my problem using tickFormat.
guiamuchastegui
on 31 Mar 2019
Related issues
 xkawi
·
4Comments
xkawi
·
4Comments
 ChrisGatzo
·
3Comments
ChrisGatzo
·
3Comments
 yvonne6344
·
4Comments
yvonne6344
·
4Comments
 aszheng
·
5Comments
aszheng
·
5Comments
 xinhash
·
4Comments
xinhash
·
4Comments
Most helpful comment
@guiamuchastegui you will want to use the
tickFormatprop onVictoryAxisto format your dates. You can read about it here: https://formidable.com/open-source/victory/docs/victory-axis#tickformat