Victory-native: Change the color of Bar graph
How do I change the graph color in react native for victory maps?
 AbhishekDS-Userfacet
All 6 comments
Do you want to change the color of the VictoryBar itself?
In the demo project, they change it in this file, maybe this example can help.
<VictoryBar
height={375}
padding={75}
style={{
data: {
fill: data => (data.y > 2 ? "red" : "blue")
}
}}
data={[
{ x: 1, y: 1 },
{ x: 2, y: 2 },
{ x: 3, y: 3 },
{ x: 4, y: 2 },
{ x: 5, y: 1 }
]}
/>
 dnlgrgly
on 6 May 2018
dnlgrgly
on 6 May 2018
Thank you @dandesz198. That worked!
Btw, Can I know How do I disable those dotted lines wrt, x-axis and y-axis?
Below is my snippet,
<VictoryChart width={Dimensions.get('window').width} theme={VictoryTheme.material} style={{ color: '#FBC530' }}>
<VictoryBar style={{ data: { fill: data => (data.y > 2 ? "#FBC530" : "#FBC530") } }} data={data[1].chart} x="quarter" y="earnings" />
</VictoryChart>
@AbhishekDS-Userfacet you will add VictoryAxis components and style them.
You can read about VictoryAxis here: https://formidable.com/open-source/victory/docs/victory-axis/
Axes FAQs might also help: https://formidable.com/open-source/victory/docs/faq/#axes
 boygirl
on 19 May 2018
boygirl
on 19 May 2018
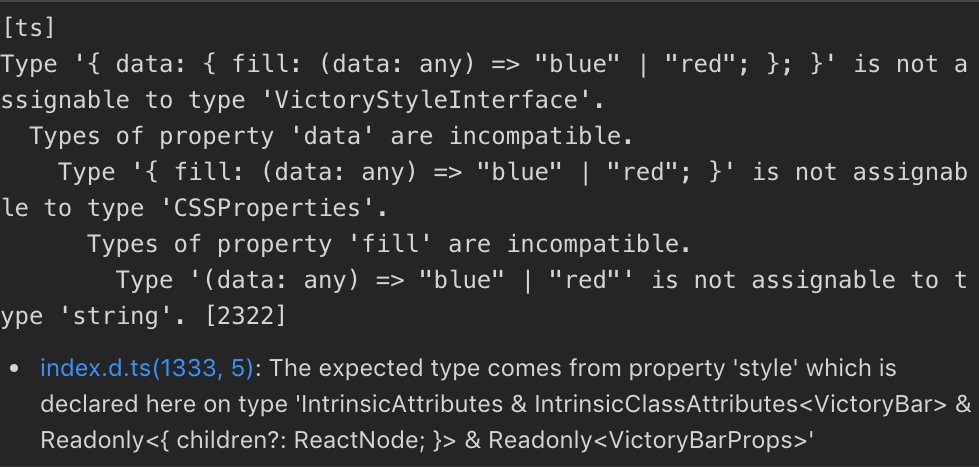
How to do this with Typescript? style={{ data: { fill: (data: any) => (data.y > 2 ? "red" : "blue") } }} doesn't compile.
 i-schuetz
on 17 Jan 2019
i-schuetz
on 17 Jan 2019
here is my trick
const colorSwitcher: any = {
fill: (data: any) => {
let color = 'blue';
if (data.value > 0 && data.value <= 25) {
color = 'red';
}
if (data.value > 25 && data.value <= 50) {
color = 'orange';
}
if (data.value > 50 && data.value <= 75) {
color = 'yellow';
}
if (data.value > 75 && data.value <= 100) {
color = 'green';
}
return color;
},
strokeWidth: 0
};
and put it inside style prop
<VictoryBar
labelComponent={<VictoryTooltip />}
style={{data: { ...colorSwitcher }}}
data={props.someData}
/>
 rdyc
on 31 Jan 2019
rdyc
on 31 Jan 2019
Make sure you are using { datum } and not { data } if you are using react-native.
Example -
<VictoryBar
              alignment="start"
              style={{
                data: {
                  fill: ({datum}) => datum.fill
                }
              }}
              data={this.state.data}
            />
 tremblerz
on 27 Mar 2020
tremblerz
on 27 Mar 2020
Related issues
 UtkarshPramodGupta
·
5Comments
UtkarshPramodGupta
·
5Comments
 jlo1
·
3Comments
jlo1
·
3Comments
 yvonne6344
·
4Comments
yvonne6344
·
4Comments
 matejkriz
·
3Comments
matejkriz
·
3Comments
 ararog
·
4Comments
ararog
·
4Comments
Most helpful comment
Make sure you are using
{ datum }and not{ data }if you are using react-native.Example -