Victoriametrics: Single node version crash with high disk usage
Describe the bug
We experienced at least 2 crashes since yesterday using VictoriaMetrics single node 1.42. There was nothing in the log before the crash and the resource usage looks fine.
However around the time of the crash disk usage for the local mount used by VictoriaMetrics container spiked (not the data disk). Does VictoriaMetrics create crash dumps when it fails that could explain a sudden increase in disk after a crash?
We ingest around 300k metrics/s. The CPU and memory were steady before the crash. Nothing seems to stand out from the monitoring dashboard.
VictoriaMetrics has been running for some time so the index is quite large (close to 200GB) and we have 5 million active time series (last hour).
We run this on a 16 cores machine with 2TB of persistent disk.
Would you suggest switching to the cluster version?
To Reproduce
Difficult to reproduce at this point.
Expected behavior
Not crash or generate a clear reason before crashing.
Screenshots
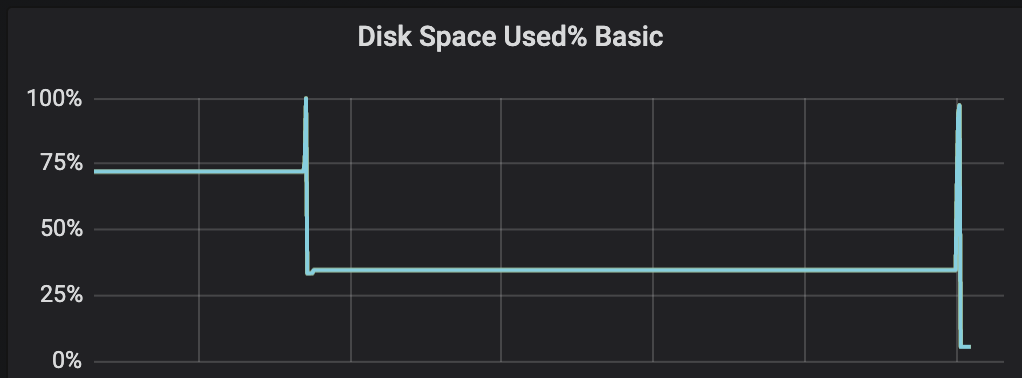
We saw around the crash a spike in local disk usage. This is not the disk used to store the data points.
It was a very sharp spike in disk usage for the VictoriaMetrics container.
Disk usage at the container level (which is not completely accurate as it crashes before sending the last disk size value):

Disk usage at the node level:
Version
/ # ./victoria-metrics-prod --version
victoria-metrics-20200929-211927-tags-v1.42.0-0-ge59de9838
Used command-line flags
flag{name="bigMergeConcurrency", value="0"} 1
flag{name="csvTrimTimestamp", value="1ms"} 1
flag{name="dedup.minScrapeInterval", value="0s"} 1
flag{name="deleteAuthKey", value="secret"} 1
flag{name="denyQueriesOutsideRetention", value="false"} 1
flag{name="enableTCP6", value="false"} 1
flag{name="envflag.enable", value="false"} 1
flag{name="envflag.prefix", value=""} 1
flag{name="forceMergeAuthKey", value="secret"} 1
flag{name="fs.disableMmap", value="false"} 1
flag{name="graphiteListenAddr", value=""} 1
flag{name="graphiteTrimTimestamp", value="1s"} 1
flag{name="http.connTimeout", value="2m0s"} 1
flag{name="http.disableResponseCompression", value="false"} 1
flag{name="http.idleConnTimeout", value="1m0s"} 1
flag{name="http.maxGracefulShutdownDuration", value="7s"} 1
flag{name="http.pathPrefix", value=""} 1
flag{name="http.shutdownDelay", value="0s"} 1
flag{name="httpAuth.password", value="secret"} 1
flag{name="httpAuth.username", value=""} 1
flag{name="httpListenAddr", value=":8428"} 1
flag{name="import.maxLineLen", value="104857600"} 1
flag{name="influxListenAddr", value=""} 1
flag{name="influxMeasurementFieldSeparator", value="_"} 1
flag{name="influxSkipMeasurement", value="false"} 1
flag{name="influxSkipSingleField", value="false"} 1
flag{name="influxTrimTimestamp", value="1ms"} 1
flag{name="insert.maxQueueDuration", value="1m0s"} 1
flag{name="loggerDisableTimestamps", value="false"} 1
flag{name="loggerErrorsPerSecondLimit", value="10"} 1
flag{name="loggerFormat", value="default"} 1
flag{name="loggerLevel", value="INFO"} 1
flag{name="loggerOutput", value="stderr"} 1
flag{name="maxConcurrentInserts", value="64"} 1
flag{name="maxInsertRequestSize", value="33554432"} 1
flag{name="maxLabelsPerTimeseries", value="30"} 1
flag{name="memory.allowedBytes", value="0"} 1
flag{name="memory.allowedPercent", value="60"} 1
flag{name="metricsAuthKey", value="secret"} 1
flag{name="opentsdbHTTPListenAddr", value=""} 1
flag{name="opentsdbListenAddr", value=""} 1
flag{name="opentsdbTrimTimestamp", value="1s"} 1
flag{name="opentsdbhttp.maxInsertRequestSize", value="33554432"} 1
flag{name="opentsdbhttpTrimTimestamp", value="1ms"} 1
flag{name="pprofAuthKey", value="secret"} 1
flag{name="precisionBits", value="64"} 1
flag{name="promscrape.config", value=""} 1
flag{name="promscrape.config.dryRun", value="false"} 1
flag{name="promscrape.config.strictParse", value="false"} 1
flag{name="promscrape.configCheckInterval", value="0s"} 1
flag{name="promscrape.consulSDCheckInterval", value="30s"} 1
flag{name="promscrape.disableCompression", value="false"} 1
flag{name="promscrape.disableKeepAlive", value="false"} 1
flag{name="promscrape.discovery.concurrency", value="100"} 1
flag{name="promscrape.discovery.concurrentWaitTime", value="1m0s"} 1
flag{name="promscrape.dnsSDCheckInterval", value="30s"} 1
flag{name="promscrape.ec2SDCheckInterval", value="1m0s"} 1
flag{name="promscrape.fileSDCheckInterval", value="30s"} 1
flag{name="promscrape.gceSDCheckInterval", value="1m0s"} 1
flag{name="promscrape.kubernetesSDCheckInterval", value="30s"} 1
flag{name="promscrape.maxScrapeSize", value="16777216"} 1
flag{name="promscrape.suppressScrapeErrors", value="false"} 1
flag{name="relabelConfig", value=""} 1
flag{name="retentionPeriod", value="12"} 1
flag{name="search.cacheTimestampOffset", value="5m0s"} 1
flag{name="search.disableCache", value="false"} 1
flag{name="search.latencyOffset", value="30s"} 1
flag{name="search.logSlowQueryDuration", value="5s"} 1
flag{name="search.maxConcurrentRequests", value="16"} 1
flag{name="search.maxExportDuration", value="720h0m0s"} 1
flag{name="search.maxLookback", value="0s"} 1
flag{name="search.maxPointsPerTimeseries", value="30000"} 1
flag{name="search.maxQueryDuration", value="30s"} 1
flag{name="search.maxQueryLen", value="16384"} 1
flag{name="search.maxQueueDuration", value="10s"} 1
flag{name="search.maxStalenessInterval", value="0s"} 1
flag{name="search.maxTagKeys", value="secret"} 1
flag{name="search.maxTagValueSuffixesPerSearch", value="100000"} 1
flag{name="search.maxTagValues", value="100000"} 1
flag{name="search.maxUniqueTimeseries", value="300000"} 1
flag{name="search.minStalenessInterval", value="0s"} 1
flag{name="search.resetCacheAuthKey", value="secret"} 1
flag{name="selfScrapeInstance", value="self"} 1
flag{name="selfScrapeInterval", value="10s"} 1
flag{name="selfScrapeJob", value="victoria-metrics"} 1
flag{name="smallMergeConcurrency", value="0"} 1
flag{name="snapshotAuthKey", value="secret"} 1
flag{name="storageDataPath", value="/storage"} 1
flag{name="tls", value="false"} 1
flag{name="tlsCertFile", value=""} 1
flag{name="tlsKeyFile", value="secret"} 1
flag{name="version", value="false"} 1
Additional context
After the automatic restart we also saw a lot of these messages:
error in "/api/v1/write": cannot handle more than 64 concurrent inserts during 1m0s; possible solutions: increase `-insert.maxQueueDuration`, increase `-maxConcurrentInserts`, increase server capacity
Which I guess are caused by the fact that so many Prometheus servers where trying to reconnect and send the missed metrics. Is it possible to throttle those logs (there were around 30k lines of logs in a few seconds)
 alexandv
All 9 comments
Additional information is that it exited with error code 139 (got it from the pod status last restart) which seems to usually mean a SEGFAULT. Could it have failed in part of the code written in C and that could generate a core dump after a SEGFAULT?
alexandv
on 17 Nov 2020
Is it possible to throttle those logs (there were around 30k lines of logs in a few seconds)
Previously VictoriaMetrics could rate limit only ERROR logs with -loggerErrorsPerSecondLimit command-line flag. The commit a6b2b2c00541931e40fe448211b8ece549e0b584 adds -loggerWarnsPerSecondLimit command-line flag, which can be used for rate limiting WARN logs like in this case.
 valyala
on 18 Nov 2020
valyala
on 18 Nov 2020
Does VictoriaMetrics create crash dumps when it fails that could explain a sudden increase in disk after a crash?
Probably, Go runtime could create core dumps on segfaults.
@alexandv , could you upgrade from v1.42.0 to the latest available release of VictoriaMetrics (v1.47.0 currently) and verify whether this issue is still reproducible? See upgrade instructions.
valyala
on 18 Nov 2020
If all logging at the same level is suppressed when the warn/error rate is exceeded, a significant message could get dropped because of some unrelated spammy logging.
Have you considered suppressing only the offending log message (assuming it is constant)?
suppressing the following log message which exceeded allowed rate:
  error in "/api/v1/write": cannot handle more than 64 concurrent inserts during 1m0s; possible solutions: increase `-insert.maxQueueDuration`, increase `-maxConcurrentInserts`, increase server capacity
 belm0
on 18 Nov 2020
belm0
on 18 Nov 2020
Previously VictoriaMetrics could rate limit only ERROR logs with -loggerErrorsPerSecondLimit command-line flag. The commit a6b2b2c adds -loggerWarnsPerSecondLimit command-line flag, which can be used for rate limiting WARN logs like in this case.
Perfect. I'll activate that once it's available.
Probably, Go runtime could create core dumps on segfaults.
Main issue I see here is that I couldn't find a stack trace in the log. Maybe it came from a part of the code that was in C and it does not generate a stack trace in this case.
@alexandv , could you upgrade from v1.42.0 to the latest available release of VictoriaMetrics (v1.47.0 currently) and verify whether this issue is still reproducible? See upgrade instructions.
I'll do that and update this issue if it happens again.
Last question: To avoid the downtime when VM restarts (that's an issue for alerting depending on metrics store in VM) I was thinking of having a second VM server that would receive the same metrics from a vmagent (or 2 for HA) that would remote write to both servers. Querying would be done through a load balancer or Promxy. Is that a viable solution or should we move to the cluster version with replication enabled?
Thanks!
alexandv
on 18 Nov 2020
I was thinking of having a second VM server that would receive the same metrics from a vmagent (or 2 for HA) that would remote write to both servers. Querying would be done through a load balancer or Promxy. Is that a viable solution or should we move to the cluster version with replication enabled?
This solution looks good. See these docs for more details about HA for single-node VictoriaMetrics. There is no need in switching to cluster version for achieving HA.
valyala
on 18 Nov 2020
Have you considered suppressing only the offending log message (assuming it is constant)?
We didn't consider this yet, but this suggestion looks good. So we are going to implement it soon. Thanks for the suggestion!
valyala
on 18 Nov 2020
@belm0 , the proposed idea with per-caller rate limiting for ERROR and WARN log messages has been implemented in the commit 09105ff49cee625fdec7ee04cb614e2f19c4eabc
valyala
on 19 Nov 2020
FYI, all the VictoriaMetrics components support per-caller rate limiting for ERROR and WARN errors starting from v1.48.0.
valyala
on 26 Nov 2020
Related issues
valyala
·
4Comments
 n4mine
·
3Comments
n4mine
·
3Comments
 genericgithubuser
·
4Comments
genericgithubuser
·
4Comments
 ozn0417
·
3Comments
ozn0417
·
3Comments
 0xBF
·
3Comments
0xBF
·
3Comments