Victoriametrics: vmalert: doesn't restore the state of alert properly
Describe the bug
It seems like vmalert doesn't restore the state of alert between restarts.
To Reproduce
I have remote write and read specified in helm chart:
      remote:
        write:
          url: "https://victoria-metrics.example.com/insert/0/prometheus"
        read:
          url: "https://victoria-metrics.example.com/select/0/prometheus"
When it starts up, I see that it was able to restore the state of alert:
"VictoriaMetrics/app/vmalert/alerting.go:439","msg":"alert \"TLAAdminDown\"(11235504160798675190) restored to state at 2020-10-29 00:37:20 +0000 UTC"}
But, in api/v1/alerts for vmalert I am seeing this:
        "id": "17739412673847745131",
        "name": "TLAAdminDown",
        "group_id": "17747172397439028248",
        "expression": "up{osfamily=\"debian\", snmp_module=\"ibm-imm\"} == 0",
        "state": "pending",
        "value": "0e+00",
Could it be that id of alert is not preserved for some reason and vmalert thinks it is a new alert?
Version
1.44
 sagor999
All 17 comments
Just restarted it again, and confirmed, that alerts are not restored correctly.
Went into alert manager and attempted to open a source for existing alert, that was firing before restart and got this:
remoteAddr: "240.1.34.2:42020", X-Forwarded-For: "10.2.246.106"; error in "/api/v1/7885659568760391262/6063482717218326380/status": can't find alert with id %!q(uint64=6063482717218326380) in group "/rules/backupdb.rules"
Seems like when vmalert is restarted, it doesn't restore existing alert id correctly.
sagor999
on 29 Oct 2020
Hi @sagor999! Confirming the issue.
 hagen1778
on 29 Oct 2020
hagen1778
on 29 Oct 2020
The fix was added in commit https://github.com/VictoriaMetrics/VictoriaMetrics/commit/f0bdc5716eabcc457e4ba07f454e594b3747e3e5
You can verify it by building vmalert from sources. The change will be also included in next release.
hagen1778
on 30 Oct 2020
FYI, then bugfix has been included in v1.45.0. @sagor999 , could you verify whether the issue has been fixed in this release of vmalert?
 valyala
on 2 Nov 2020
valyala
on 2 Nov 2020
@valyala @hagen1778 no, not fixed. :(
alert id is still not the same.
After restart in log:
"alert \"PerforceEdgeDown\" (5439354213223341447) restored to state at 2020-11-02 15:12:22 +0000 UTC"}
But in api/v1/alerts:
        "id": "8262341710787087659",
        "name": "PerforceEdgeDown",
        "group_id": "10218292025660603678",
        "state": "pending",
Hm. Interestingly, some alerts did restore properly and preserved their ID.
Is there anything else that might cause ID to change between restarts\restore?
sagor999
on 2 Nov 2020
Did that happen after first restart or every restart causes the partial restore?
hagen1778
on 2 Nov 2020
@hagen1778 every restart causes partial restore. I did 3 restarts (using 1.45) to double check.
sagor999
on 2 Nov 2020
Would really appreciate if you do a little experiment with me and verify if your case is similar.
Restore event in vmalert is based on the results of the following query: last_over_time(ALERTS_FOR_STATE{alertname="<alert_name_from_rules>", <external_labels>}[<range_vector>])
, where <alert_name_from_rules> - alert name from your rules file
<external_labels> - labels configured via -external.label flag (if any)
<range_vector> - is a time range to look for configured via -remoteRead.lookback flag which is 1h by default.
So in your case for the alert PerforceEdgeDown the following query for state restoring will be issued:
last_over_time(ALERTS_FOR_STATE{alertname="PerforceEdgeDown"}[1h]
You can verify this query yourself by just executing it in Grafana against VM datasource. The result suppose to return you active alerts over last 1h. However, it could happen that alert has been triggered multiple times during last hour but with different labels:
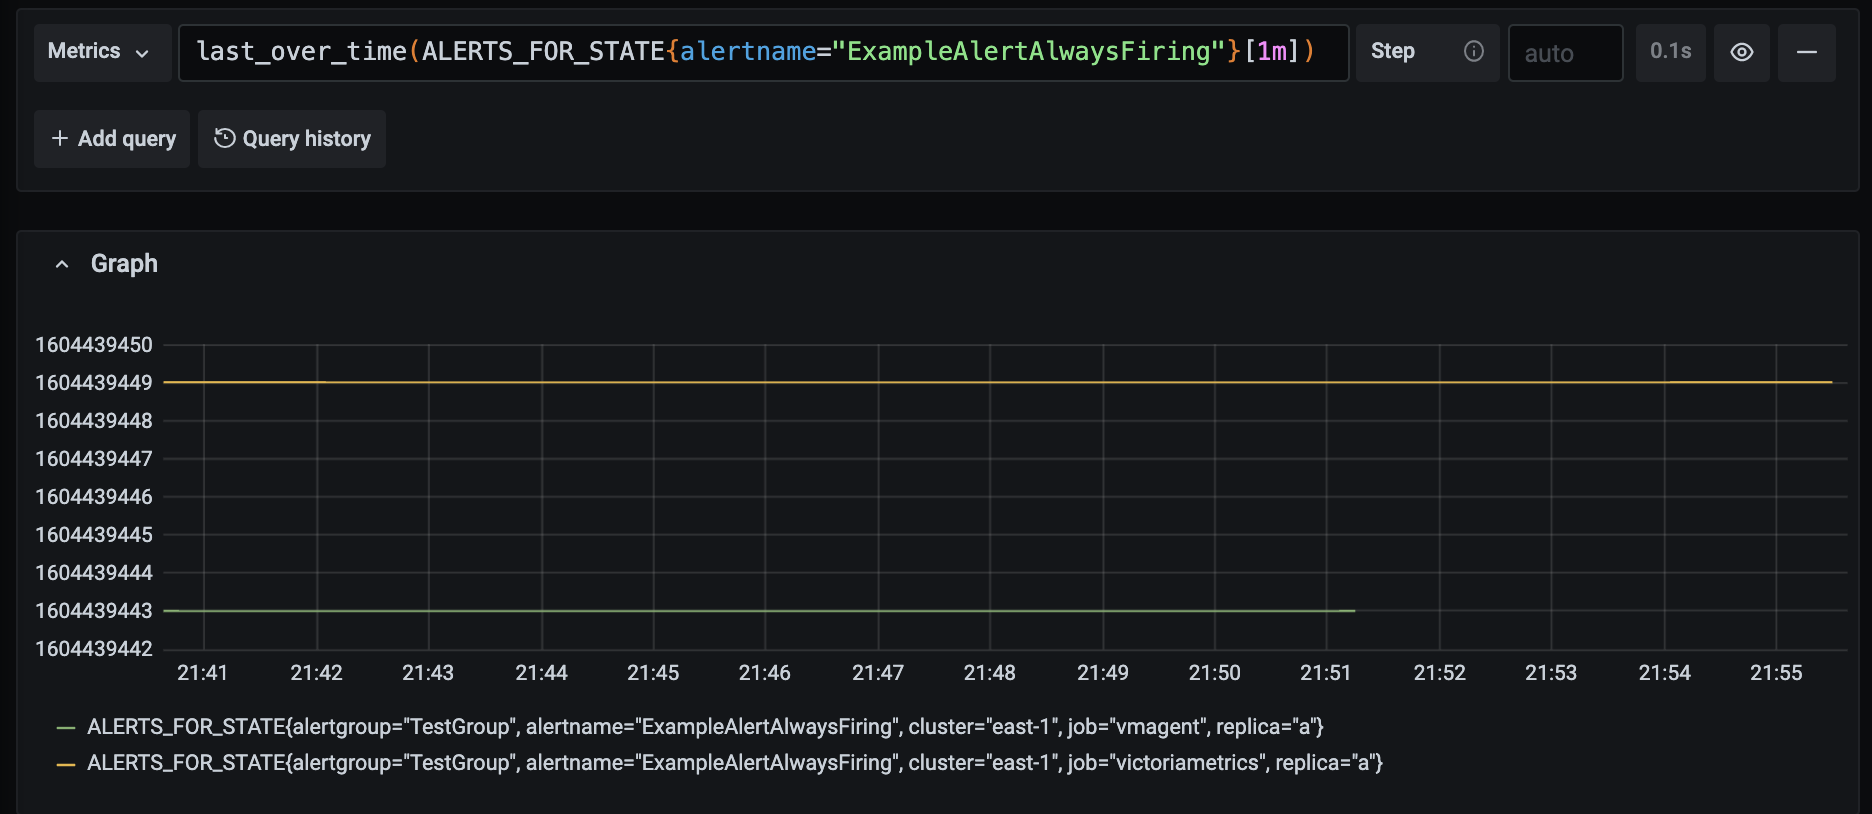
And restore query will capture both time series and restore them, so you'll see two log messages:
2020-11-03T21:57:18.733Z        info    app/vmalert/alerting.go:442     alert "ExampleAlertAlwaysFiring" (7084607968789659015) restored to state at 2020-11-03 21:37:23 +0000 GMT
2020-11-03T21:57:18.734Z        info    app/vmalert/alerting.go:442     alert "ExampleAlertAlwaysFiring" (13060390928054447743) restored to state at 2020-11-03 21:37:29 +0000 GMT
But this is fine, because alerts always restore into the pending state with intention that next evaluation will update their status either to firing or to inactive.
So you can expect that some alerts may be restored according to logs but actually missing after the next evaluation. To reduce probability such behaviour decrease value for -remoteRead.lookback flag. Try to pick lookback value in order to cover periods while vmalert may be turned off.
Would be great if you can check if this is your case.
hagen1778
on 3 Nov 2020
@hagen1778 I don't think that was the case. At that time when I was testing, there was only one alert firing for alert PerforceEdgeDown.
And when it was restored, the new alert did not switch from pending to firing until after alert's for has passed, and only then it became active. Which tells me that it was not restored properly, and restored alert somehow got lost.
But just to be sure, I just did a test.
Restarted vm alert.
"alert \"PerforceEdgeDown\" (5439354213223341447) restored to state at 2020-11-02 15:48:22 +0000 UTC"}
id of alert is different for some reason for the one that was active before restart:
"id": "8262341710787087659",
And yes, new alert is now pending and has a different id:
{
        "id": "8262341710787087659",
        "name": "PerforceEdgeDown",
        "group_id": "10218292025660603678",
        "expression": "p4_up{server_services=\"edge-server\"} == 0",
        "state": "pending",
This is from grafana:
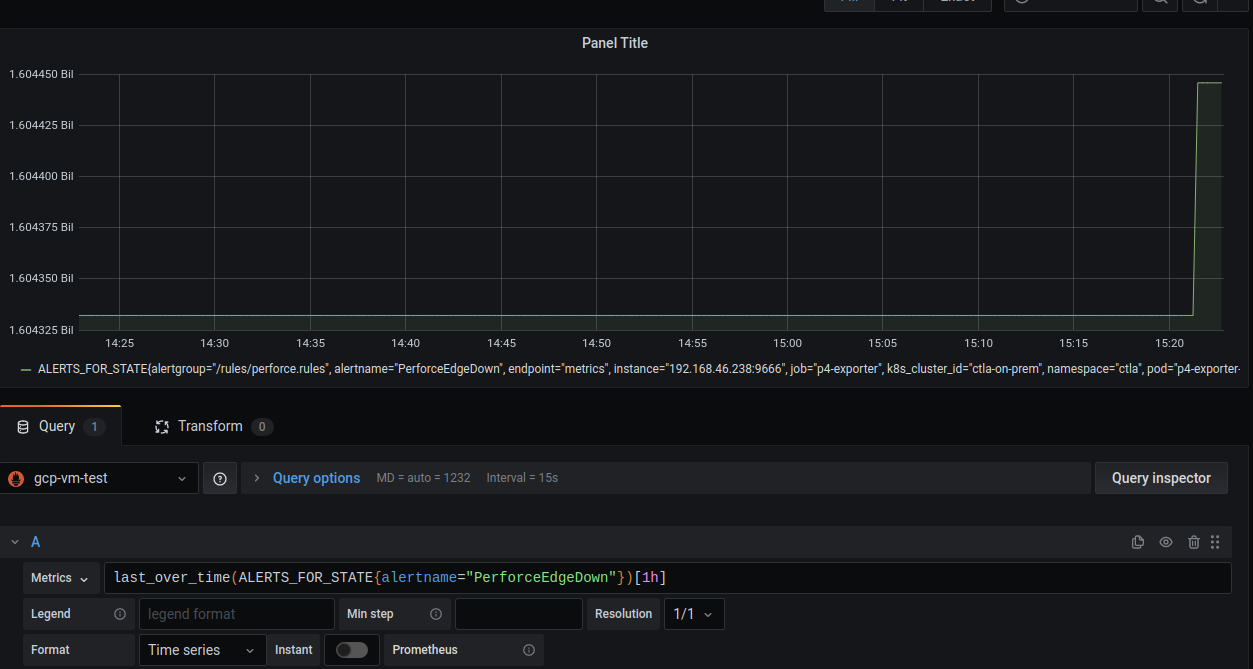
Notice there is only one alert. But also it jumped up right after restart.
So I think it does for some reason generate new alert id instead of using old one?
This is the actual alert, in case if maybe it has something to do with alert itself:
  - alert: PerforceEdgeDown
    expr: p4_up{server_services="edge-server"} == 0
    for: 15m
    labels:
      service: perforce
      severity: critical
    annotations:
      chart_url: https://grafana.example.com/d/000000028/perforce-cluster
      problem: Perforce edge server {{ $labels.server_id }} down
      solution: Immediately contact <hidden>
      runbook: https://docs.example.com/en/runbooks/pagerduty/PerforceEdgeDown
I appreciate you looking into it! Thank you!
sagor999
on 4 Nov 2020
Thx for detailed response @sagor999!
Could you pls provide result of p4_up{server_services="edge-server"} == 0 expression in VM? I'm interested only in returned label names, not values (grafana screenshot with blurred/obfuscated label values is ok). If data is sensitive for public discussion pls let me know or send it to [email protected]. Thank you for helping to debug this!
hagen1778
on 4 Nov 2020
@hagen1778 sent you email.
sagor999
on 4 Nov 2020
The issue was identified and caused by labels collision - rule labels were conflicting with time series labels. I'll see how to avoid such collisions during restore.
Thanks @sagor999 for provided information!
hagen1778
on 5 Nov 2020
Hi @sagor999! The fix was merged in commit https://github.com/VictoriaMetrics/VictoriaMetrics/pull/886/commits/08a89cf794e1c99c823ba7033edad634615d0087.
You can verify it by building vmalert from sources. The change will be also included in the next release.
hagen1778
on 10 Nov 2020
@hagen1778 great! I will wait for the next release and will test it out. Thank you for a quick fix!
sagor999
on 14 Nov 2020
@sagor999, the commit mentioned above has been included in v1.47.0. Could you verify whether it works as expected?
valyala
on 16 Nov 2020
@valyala Confirmed, works correctly now! Thank you!
sagor999
on 16 Nov 2020
Related issues
 Serrvosky
·
3Comments
Serrvosky
·
3Comments
 genericgithubuser
·
4Comments
genericgithubuser
·
4Comments
 pmitra43
·
3Comments
pmitra43
·
3Comments
 n4mine
·
3Comments
n4mine
·
3Comments
 EricAntoni
·
3Comments
EricAntoni
·
3Comments
Most helpful comment
@valyala Confirmed, works correctly now! Thank you!