Victoriametrics: [vmagent] On k8s prefix metrics path with '/' if it is missing.
Is your feature request related to a problem? Please describe.
Our users have the following deployment configurations:
prometheus.io/path: path/to/metrics
In the logs, I see the following error:
020-10-14T06:27:03.939Z error VictoriaMetrics/lib/promscrape/config.go:567 error when parsing `kubernetes_sd_config` target "10.127.78.232:9000" for `job_name` "kubernetes-pods": invalid url "http://10.127.78.232:8080path/to/metrics" for scheme="http" ("http"), target="10.127.78.232:9000" ("10.127.78.232:8080"), metrics_path="/metrics" ("path/to/metrics") for `job_name` "kubernetes-pods": parse "http://10.127.78.232:8080path/to/metrics": invalid port ":8080path" after host; skipping it
Describe the solution you'd like
Prefix path with / if it is missing.
Describe alternatives you've considered
I have to check vmagent error logs and notify developer to fix it.
 zbindenren
All 7 comments
This path comes from your relabelConfig and you can rewrite it as you want. For instance, try this rule:
        - source_labels:
            [__meta_kubernetes_service_annotation_prometheus_io_path]
          action: replace
          target_label: __metrics_path__
          regex: ^/?(.+)
          replacement: /$1
 f41gh7
on 14 Oct 2020
f41gh7
on 14 Oct 2020
Great idea, I will try that tomorrow at work.
zbindenren
on 14 Oct 2020
@zbindenren , could you verify whether the original path works in Prometheus? If yes, then it should be fixed in vmagent too.
 valyala
on 17 Oct 2020
valyala
on 17 Oct 2020
prometheus is not prepending metrics path with '/'.
Closing issue.
zbindenren
on 20 Oct 2020
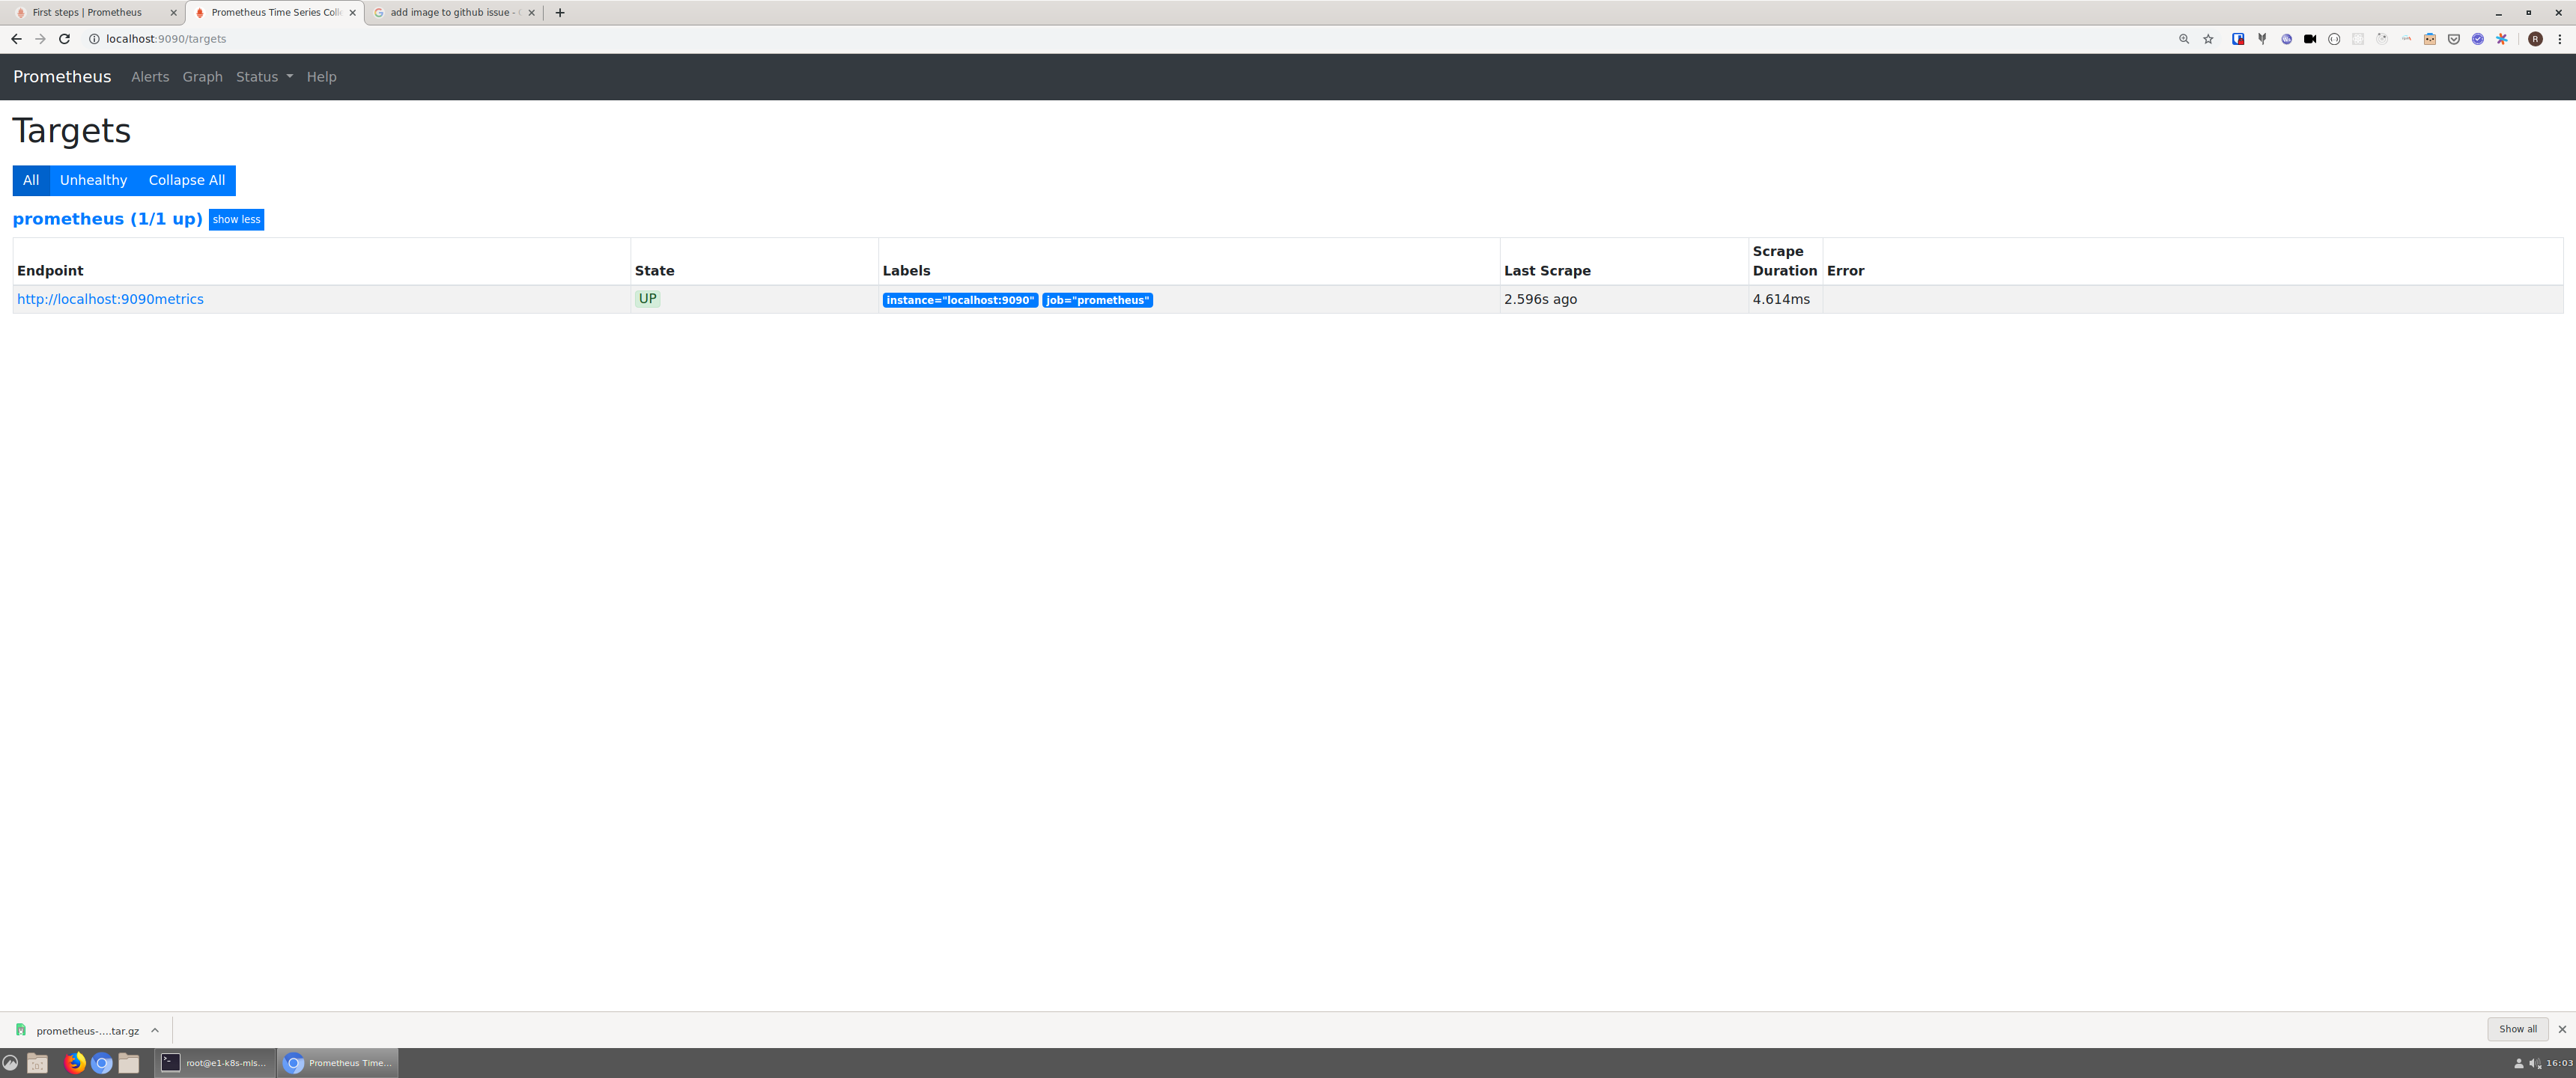
I have to change my test result. Somehow prometheus is able to scrape it:
Config:
# my global config
global:
  scrape_interval:     15s # Set the scrape interval to every 15 seconds. Default is every 1 minute.
  evaluation_interval: 15s # Evaluate rules every 15 seconds. The default is every 1 minute.
  # scrape_timeout is set to the global default (10s).

# Alertmanager configuration
alerting:
  alertmanagers:
  - static_configs:
    - targets:
      # - alertmanager:9093

# Load rules once and periodically evaluate them according to the global 'evaluation_interval'.
rule_files:
  # - "first_rules.yml"
  # - "second_rules.yml"

# A scrape configuration containing exactly one endpoint to scrape:
# Here it's Prometheus itself.
scrape_configs:
  # The job name is added as a label `job=<job_name>` to any timeseries scraped from this config.
  - job_name: 'prometheus'

    # metrics_path defaults to '/metrics'
    # scheme defaults to 'http'.

    metrics_path: "metrics"
    static_configs:
    - targets: ['localhost:9090']
vmagent should add missing / in metrics path starting from v1.45.0. @zbindenren , could you confirm this?
valyala
on 2 Nov 2020
works with 1.45.0. Closing issue.
zbindenren
on 2 Nov 2020
Related issues
 faceair
·
3Comments
faceair
·
3Comments
 abualy
·
3Comments
valyala
·
4Comments
abualy
·
3Comments
valyala
·
4Comments
 sh0rez
·
3Comments
sh0rez
·
3Comments
 oOHenry
·
4Comments
oOHenry
·
4Comments