Victoriametrics: High iowait and memory usage of the vmstorage with version 1.39.4
Describe the bug
There are eight Prometheus nodes whitch remote-write to five vm_insert nodes through nginx . and each vm_insert nodes write to five vm_storage nodes
The five vm_storage nodes started with the same command-line flag and the same version
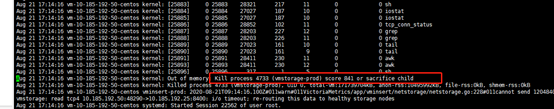
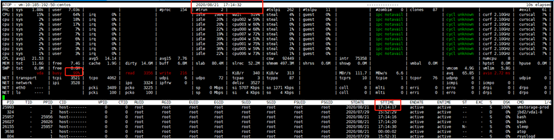
One day, the five vm_storage nodes became very slowly with high iowait and finally be killed with oom
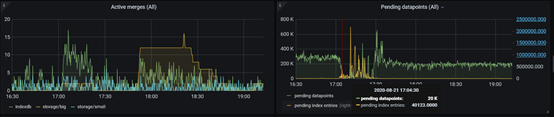
We collected the active time series information and found that the vm_cache_entries increased from 6mil to 12 mil.
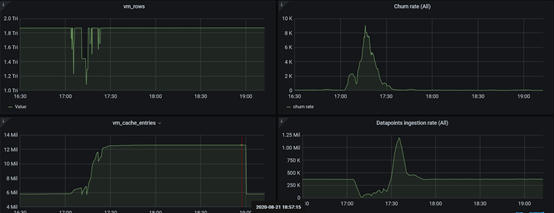
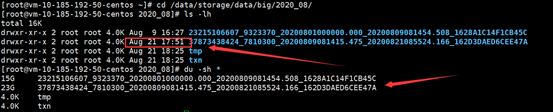
There is a new dir be created in vm_storage path , just the time when problem happened
We confused:
why the active time series doubled? There is no change with all the time series labels and no change with all monitored k8s node.
Is this problem related to merge?
What is the merge mean? When the merge action will be triggered
To Reproduce
vmstorage run for several days
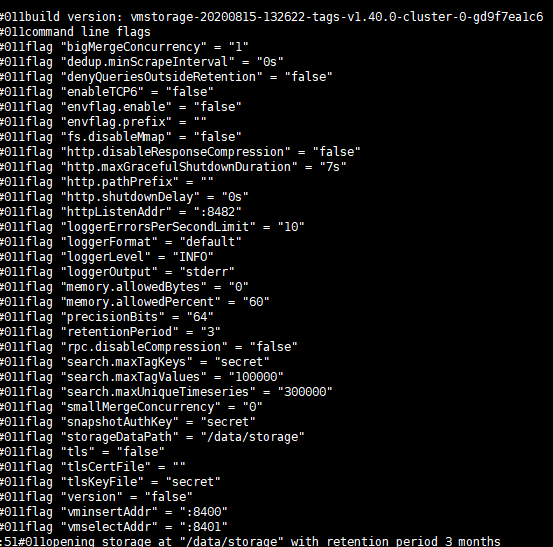
Version
The line returned when passing --version command line flag to binary. For example:
```
$ ./victoria-metrics-prod --version
[root@vm-10-185-192-52-centos victoria]# ./vmstorage-prod -version
vmstorage-20200815-132622-tags-v1.40.0-cluster-0-gd9f7ea1c6
 saclive
All 7 comments
Hi @saclive! The pictures are hardly readable, could you plz update with better resolution?
The dashboard also contains Troubleshooting row - could you pls add it as well? Would be nice to get screenshots for all the panels if this possible.
What is the merge mean? When the merge action will be triggered
Merges are happening all the time - it is a process of merging smaller parts with data into bigger ones to improve compression and reduce number of files on disk.
 hagen1778
on 26 Aug 2020
saclive
on 27 Aug 2020
hagen1778
on 28 Aug 2020
saclive
on 31 Aug 2020
hagen1778
on 26 Aug 2020
saclive
on 27 Aug 2020
hagen1778
on 28 Aug 2020
saclive
on 31 Aug 2020
 valyala
on 1 Sep 2020
valyala
on 1 Sep 2020
saclive
on 17 Sep 2020
valyala
on 1 Sep 2020
valyala
on 1 Sep 2020
saclive
on 17 Sep 2020
Related issues
 genericgithubuser
·
4Comments
genericgithubuser
·
4Comments
 faceair
·
3Comments
faceair
·
3Comments
 isality
·
3Comments
isality
·
3Comments
 v98765
·
3Comments
v98765
·
3Comments
 pmitra43
·
3Comments
pmitra43
·
3Comments
Most helpful comment