Victoriametrics: Grafana Table doesn't merge queries results with Victoria Metrics datasource
Describe the bug
Switching datasource from Prometheus to Victoria Metrics in Grafana Tables breaks row merging for the same data. We are trying to use VictoriaMetrics as long-term historical metrics storage for our Kubernetes in-cluster Prometheus. Have configured Prometheus to send data to VictoriaMetrics via remote_write api.
To Reproduce
- Install VictoriaMetrics single node helm chart.
- Add remote_write to VM in Prometheus config.
- Change datasource from prometheus to VM in grafana dashboards with tables with multiple queries. No any other settings in Grafana changed.
- Queries results doesn't merged anymore. See screenshots.
- Change datasouce back to Prometheus - tables look as it should.
Expected behavior
Multiple queries results with same lebels should be merged to rows in Grafana Tables panel.
Screenshots
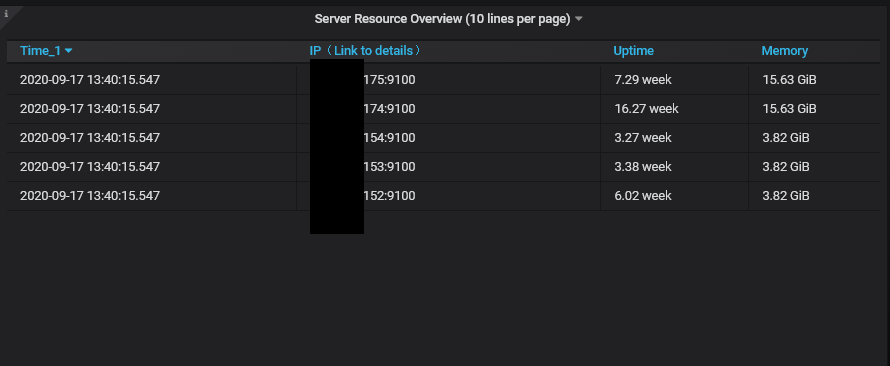
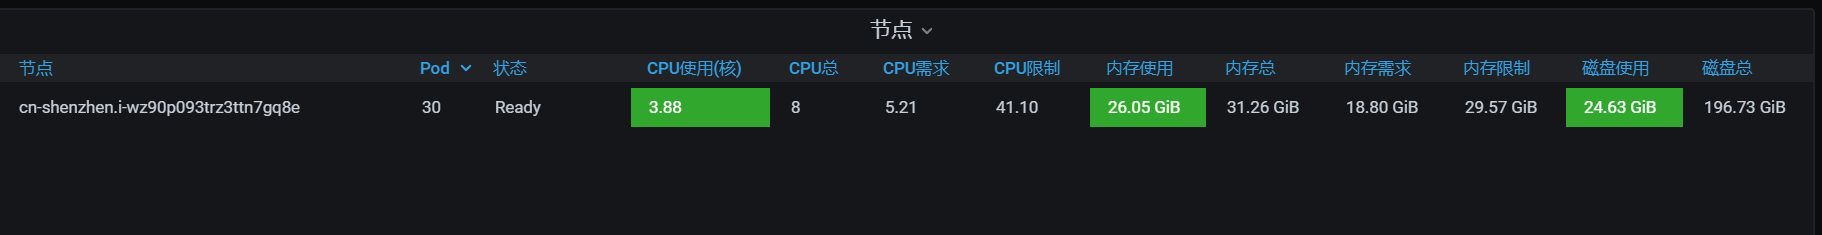
Prometheus datasource table result:

VictoriaMetrics datasource table result with same queries and settings:

Version
The line returned when passing --version command line flag to binary. For example:
$ ./victoria-metrics-prod --version
victoria-metrics-20200815-125320-tags-v1.40.0-0-ged00eb3f3
 Keiske
All 20 comments
Hi @Keiske! Could you pls check the actual response in both cases and compare? Would be nice to post it here if possible.
 hagen1778
on 26 Aug 2020
hagen1778
on 26 Aug 2020
Hi @Keiske! Could you pls check the actual response in both cases and compare? Would be nice to post it here if possible.
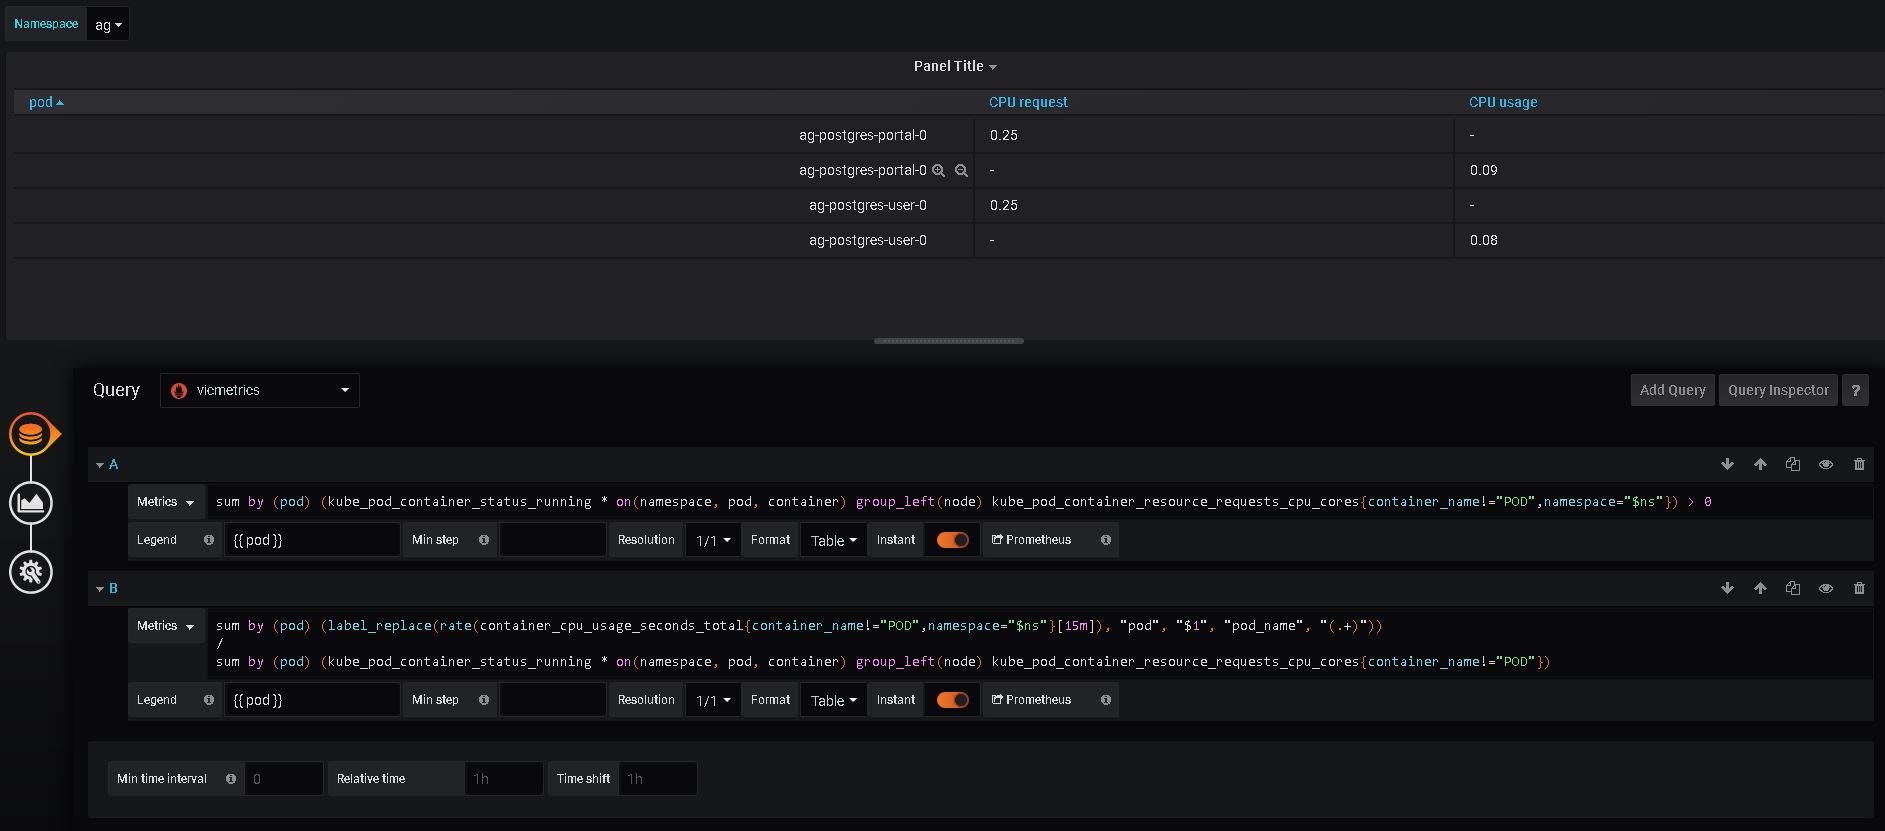
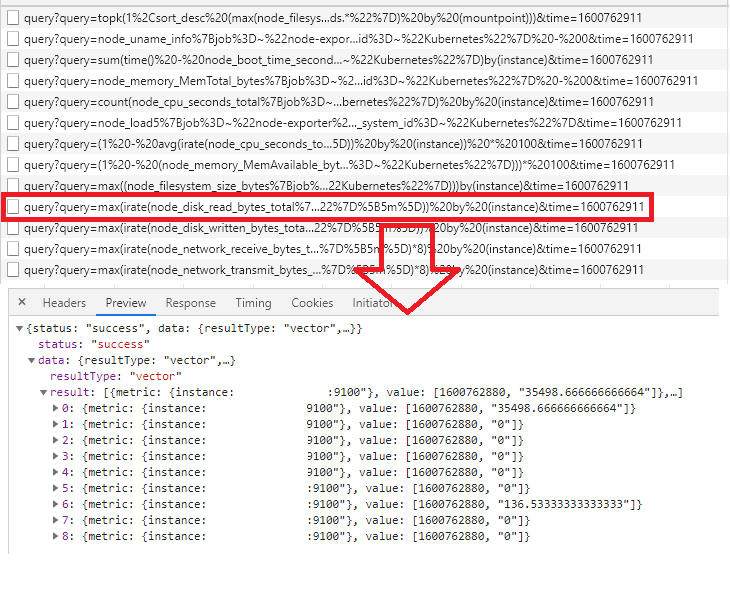
Sure. Here it is. Looks very similar, but with switched order of metrics in results.
First value column query result:
Prometheus:
{"status":"success","data":{"resultType":"vector","result":[{"metric":{"pod":"ag-postgres-portal-0"},"value":[1598532794,"0.25"]},{"metric":{"pod":"ag-postgres-user-0"},"value":[1598532794,"0.25"]}]}}
VictoriaMetrics:
{"status":"success","data":{"resultType":"vector","result":[{"metric":{"pod":"ag-postgres-user-0"},"value":[1598532794,"0.25"]},{"metric":{"pod":"ag-postgres-portal-0"},"value":[1598532794,"0.25"]}]}}
Second value column query results:
Prometheus:
{"status":"success","data":{"resultType":"vector","result":[{"metric":{"pod":"ag-postgres-portal-0"},"value":[1598532794,"0.0908893273381095"]},{"metric":{"pod":"ag-postgres-user-0"},"value":[1598532794,"0.0875724036524064"]}]}}
VictoriaMetrics:
{"status":"success","data":{"resultType":"vector","result":[{"metric":{"pod":"ag-postgres-user-0"},"value":[1598532794,"0.08627032711112406"]},{"metric":{"pod":"ag-postgres-portal-0"},"value":[1598532794,"0.09153162373333341"]}]}}
Keiske
on 27 Aug 2020
Thanks! Weird, content looks identical except order. But order is consistent for both VM requests so it shouldn't be a case. Have you tried to build any other tables based on VM datasource? I wonder if it is Grafana bug...
hagen1778
on 30 Aug 2020
@Keiske , try wrapping queries into sort() function. This should guarantee consistent order of the returned metrics.
 valyala
on 1 Sep 2020
valyala
on 1 Sep 2020
Hi!I have same question.My environment uses v1.40.0-cluster.
But I change grafana time range is ok(from now-5m to now-1m),my prometheus scrape_interval is 1m.
/ # ./vminsert-prod -version
vminsert-20200815-132700-tags-v1.40.0-cluster-0-gd9f7ea1c6
When i use v1.37.2-cluster is ok
 balabalazhoucj
on 9 Sep 2020
balabalazhoucj
on 9 Sep 2020
Hi @balabalazhoucj! Have you tried to set instant button to your queries like in the screenshot from @Keiske?
hagen1778
on 9 Sep 2020
@hagen1778 I think its because when "instant" is used it returns time for as
Examples.
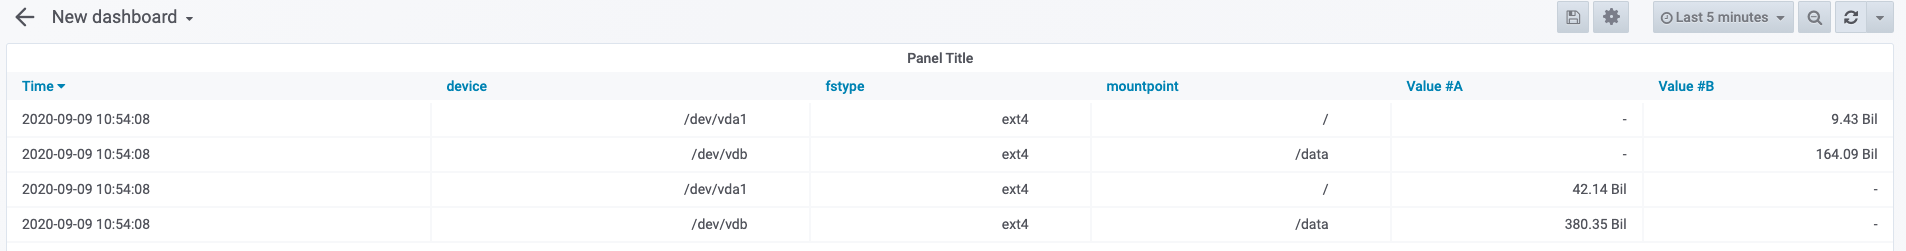
Not OK: (3ms offset for metrics scraped in one time)
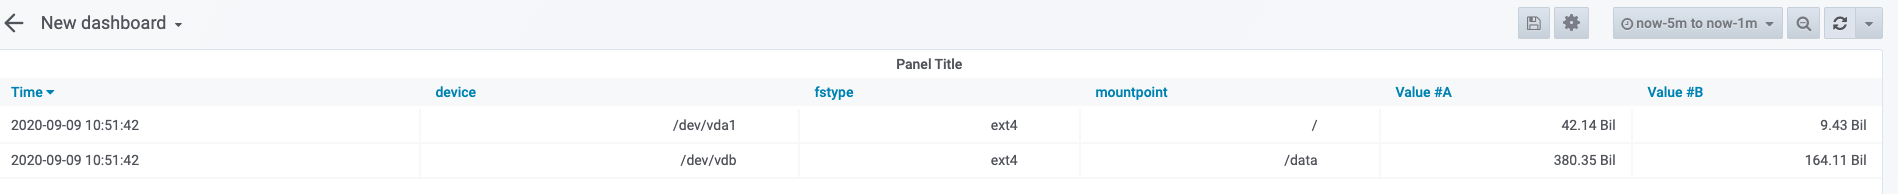
OK (after 10 refreshes):
Nothing was changed in queries, and dashboards, only few refreshes.
 Muxa1L
on 17 Sep 2020
Muxa1L
on 17 Sep 2020
@valyala Sorting results didn't help.
@hagen1778 Yes, as @Muxa1L said, our issue looks just like this. Refreshing dashboard in browser sometimes makes table marge correct. About 1 of 10 page refreshes. But how can we fix it to always merge results in table correctly, just like Prometheus datasource does.
Keiske
on 17 Sep 2020
By the way, when you disable "instant" thus running ranged query - last results of query are correct.
Muxa1L
on 17 Sep 2020
@Muxa1L Good catch! Instant queries are sent to /query handler and response contains timestamps with milliseconds precision. And regular queries are sent to /query_range and response contains timestamps with second precision. Should VM round timestamps up to seconds for instant queries @valyala ?
hagen1778
on 18 Sep 2020
@hagen1778 I think it will be better to return the timestamp of the last metric value
Example single metric and results for instant query (to path /query):
{"result":[{"metric":{"__name__":"go_cpu_count","instance":"self","job":"victoria-metrics"},"value":[1600421855.726,"3"]}]}
1600421855.726 is approx 2020-09-18 12:37:35 - is the
Plus. If VM would round timestamps up to seconds - it still will be possible to get different timestamps that will break the table.
Muxa1L
on 18 Sep 2020
@hagen1778
I also have this problem. I found that there will be such a problem since v1.39.0, but it is normal in v1.38.1. Because the grafana table cannot be used, I can only use the v1.38.1 version now. I hope this problem can be solved.
v1.39.0

v1.38.1
 starsliao
on 21 Sep 2020
starsliao
on 21 Sep 2020
@hagen1778 Nvm my previous comment. Returning timestamps with seconds precision will be enough. Prometheus also returns with seconds precision. And victoriaMetrics returned timestamps with seconds precision before v1.39.0, as @starsliao noticed
Muxa1L
on 21 Sep 2020
The issue must be fixed in the following commits:
- Single-node VictoriaMetrics - 2eb72e09ab7bd3208cfbe08a08938f043ea4e876
- Cluster VictoriaMetrics - 07c622633476d61e9ceef646a41e9e3f06fd7fd4
The bugfix rounds default time value to seconds when the query to /api/v1/query doesn't contain time query arg. This is a workaround, which reduces the probability of the original issue. The proper fix should be applied on Grafana side - it must pass time query arg with each query to /api/v1/query.
valyala
on 21 Sep 2020
@valyala grafana passes time to queries. But it does not seem to be counted anywhere.
I think this part overwrites start value.
https://github.com/VictoriaMetrics/VictoriaMetrics/blob/3b1e3a03e091a6597c467c8032d78dfbdc12428a/app/vmselect/prometheus/prometheus.go#L654-L658
So setting -search.latencyOffset to something small, like 1ms helps.
Muxa1L
on 22 Sep 2020
@Muxa1L , thanks for the spot! It must be fixed in the following commits:
- Single-node VictoriaMetrics: 3ba507000ca78b35cbe2db8106131c8376450ba6
- Cluster VictoriaMetrics: 1fce79518a58956c8cc8d62654907edbefe53a04
Unfortunately these commits weren't included in v1.41.1, but they will be included in the next release.
valyala
on 23 Sep 2020
@valyala, great! Now it works correctly, thanks for fixes!
Muxa1L
on 23 Sep 2020
Is it advised to use rollback to v1.38.1? Is this fix going to to be released soon?
Using 1.41.1 and facing the issue.
 boazjohn
on 28 Sep 2020
boazjohn
on 28 Sep 2020
Is it advised to use rollback to v1.38.1?
Unfortunately it is impossible to downgrade from v1.41.* to older releases due to on-disk data format change. See release notes for v1.41.0 for details. So it is better waiting for the next release or building VictoriaMetrics from sources according to the following docs:
Is this fix going to to be released soon?
The fix will be included in the upcoming release, which is going to be published in the next couple of days.
valyala
on 29 Sep 2020
The bugfix is available starting from v1.42.0. Closing the bug as fixed.
valyala
on 30 Sep 2020
Related issues
 n4mine
·
3Comments
n4mine
·
3Comments
 abualy
·
3Comments
abualy
·
3Comments
 jelmd
·
3Comments
jelmd
·
3Comments
 v98765
·
3Comments
v98765
·
3Comments
 oOHenry
·
4Comments
oOHenry
·
4Comments
Most helpful comment
@hagen1778 I think its because when "instant" is used it returns time for as - 30s (or current value of search.latencyOffset param set for vmselect) instead of actual time for this metric. And because queries may complete in different time this timestamps may differ for 1-2-10-inf ms, and it breaks the table.


Examples.
Not OK: (3ms offset for metrics scraped in one time)
OK (after 10 refreshes):
Nothing was changed in queries, and dashboards, only few refreshes.