Victoriametrics: vminsert: performance degradation while ingesting data in the Prometheus exposition format
Describe the bug
We use the cluster version of VictoriaMetrics, run it in Kubernetes, and send data in the Prometheus exposition format to http://<vminsert>/insert/0/prometheus/api/v1/import/prometheus endpoint, we also gzip data before sending. This works fine.
At some point, we observe the following vminsert errors:
2020-08-13T21:53:27.130Z warn VictoriaMetrics/app/vminsert/main.go:184 remoteAddr: "10.32.82.19:39628"; error in "/insert/0/prometheus/api/v1/import/prometheus": cannot read graphite plaintext protocol data: unexpected EOF
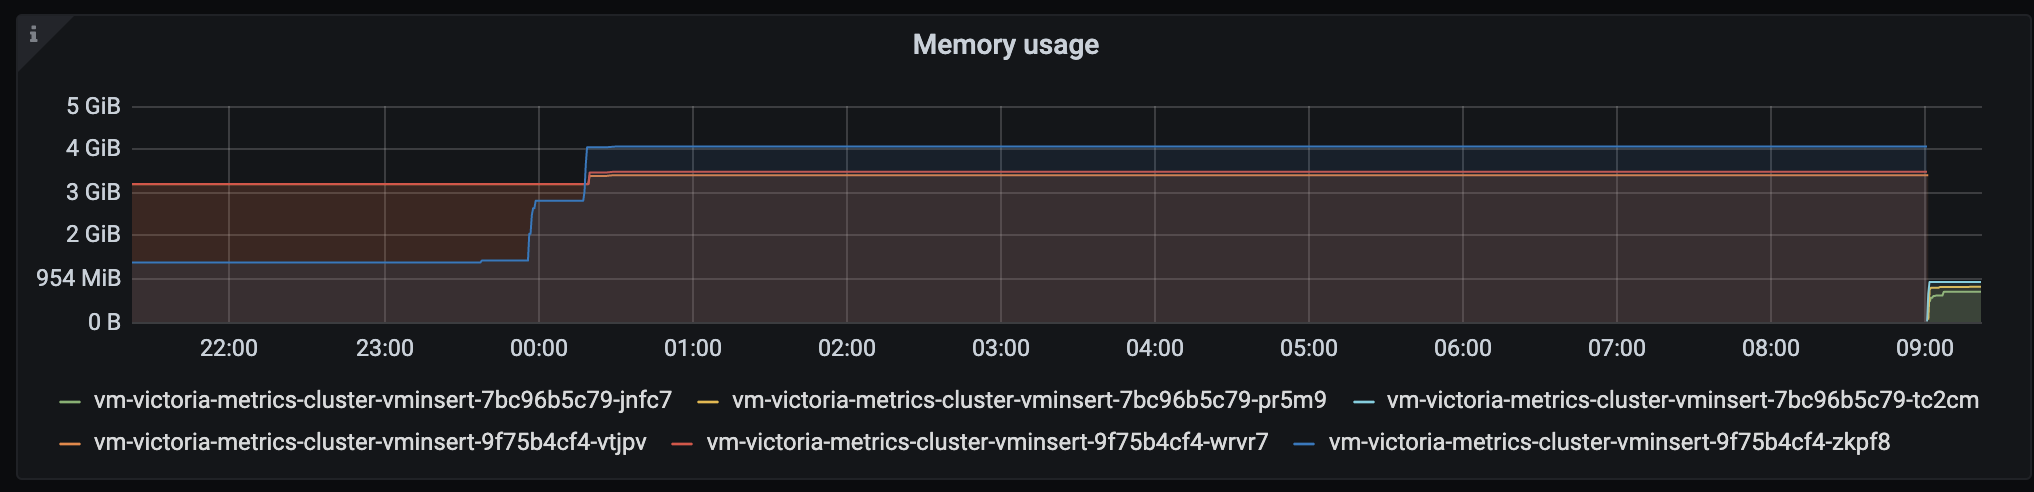
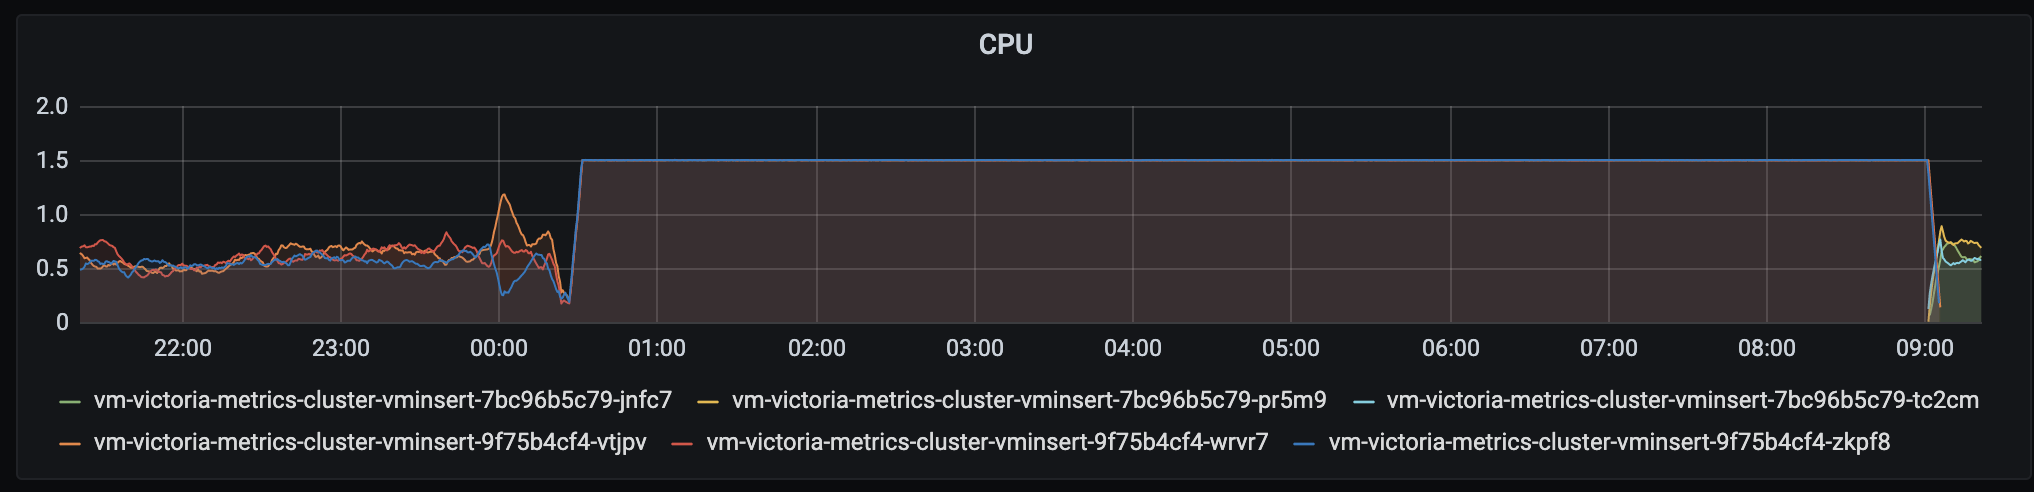
After that CPU usage gets to 100%, memory usage also increased:
Interestingly, vminsert reports also it reached max concurrent inserts:

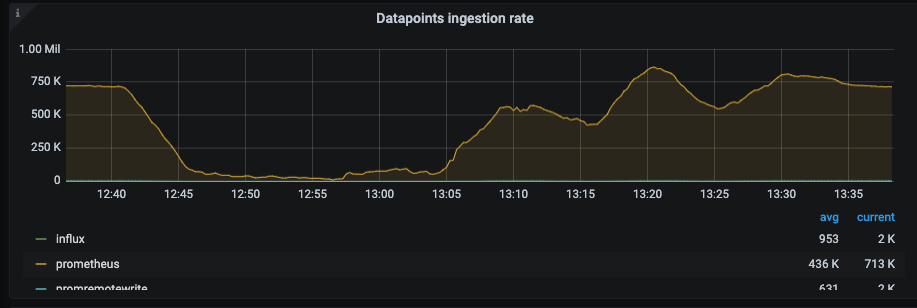
While ingestion rate didn't increase dramatically:

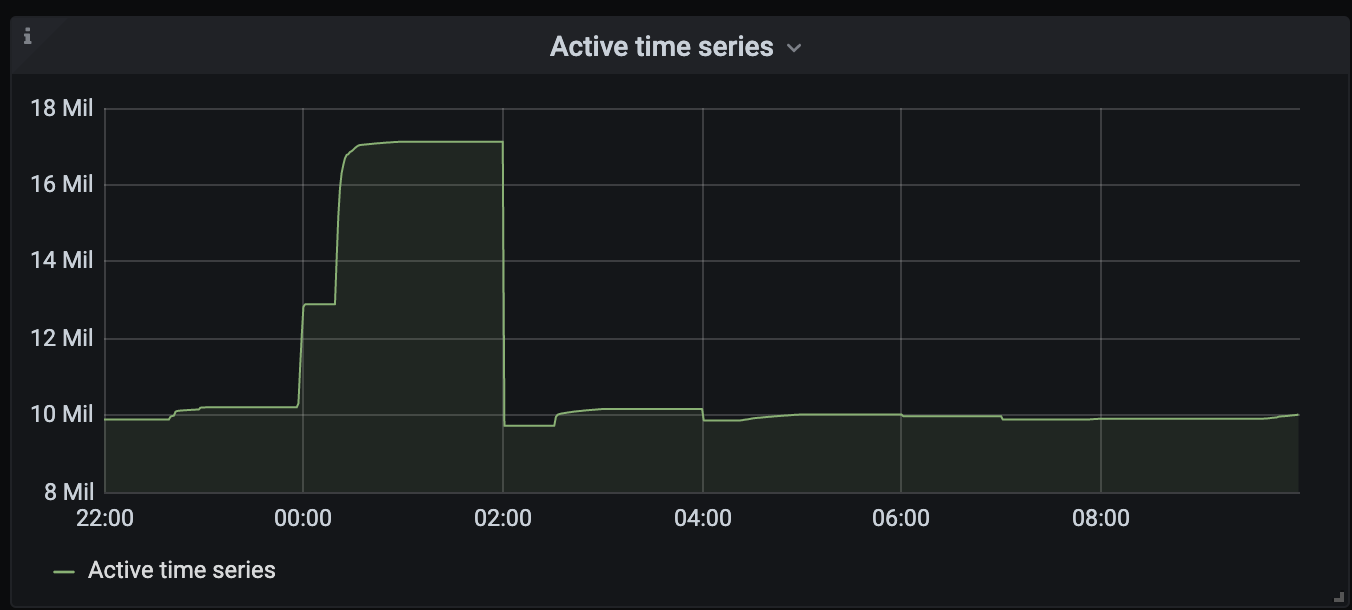
However, there was a spike in active time series:
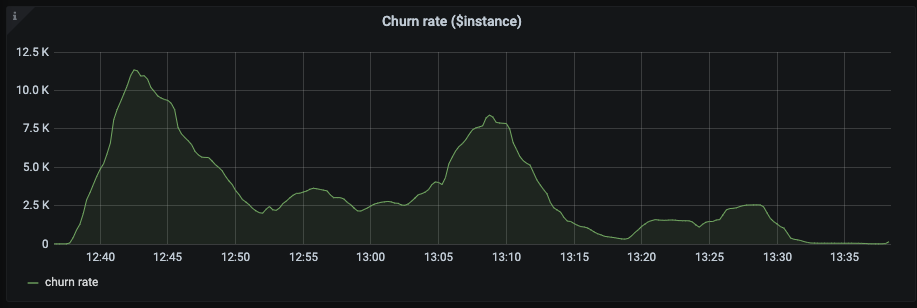
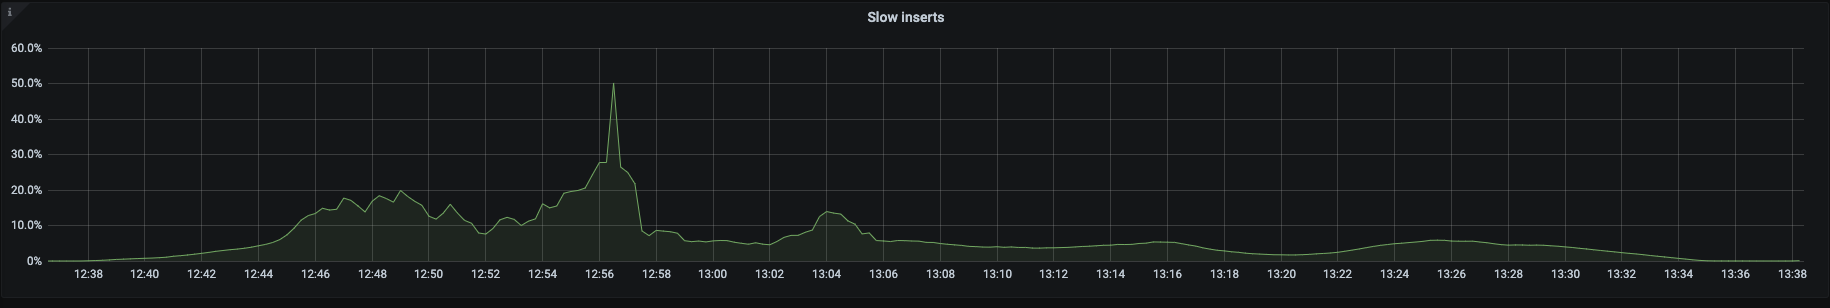
Churn rate and slow inserts had an increase also - 10k and 8% appropriately.
A restart of vminsert pods resolved the issue.
To Reproduce
I'm not sure how to reproduce, still in search of some correlations
Expected behavior
No errors, stable resource usage. Or errors related to the format we use instead of Graphite plaintext format.
Version
v1.39.4-cluster
Used command-line flags
--maxLabelsPerTimeseries=100 in addition to --storageNode
Additional context
vmselect/vmstorage had no errors in logs at that time. Let me know if I should include other graphs from the official VM dashboard as well.
 vpedosyuk
All 9 comments
@vpedosyuk , could you provide cpu profile and goroutine profile next time you encounter this bug?
These profiles may be obtained with the following commands (please substitute vminsert with the corresponding vminsert node address):
- cpu profile:
curl http://vminsert:8480/debug/pprof/profile > cpu.pprof
- goroutine profile:
curl http://vminsert:8480/debug/pprof/goroutine > goroutine.pprof
 valyala
on 14 Aug 2020
valyala
on 14 Aug 2020
@valyala I've already sent a cpu profile to [email protected] and I'll try to collect goroutine profile next time
vpedosyuk
on 14 Aug 2020
@vpedosyuk , thank you!
Could you build vminsert from the commit c6b054784739159a64fb778a4a077151bee6cee0 and verify whether the issue is fixed there? See build instructions for vminsert at https://victoriametrics.github.io/Cluster-VictoriaMetrics.html#building-from-sources .
valyala
on 14 Aug 2020
Thanks for the quick fix! I've built it and deployed but we'll need to monitor it for a few days to make sure the issue is gone.
vpedosyuk
on 15 Aug 2020
FYI, the bugfix has been included in v1.40.0 release, so it may be tested there.
valyala
on 15 Aug 2020
@valyala we've experienced another outage:
The ingestion rate was stable until it started decreasing at 12:41, very similar to what I reported in this issue
I see that churn rate started growing a few minutes before - at 12:38
The reason for that could've been heavy PromQL queries.
However, the strange thing is that the vmstorage pods were up and running (until I started rebooting everything), moreover, vminserts are the only who were reporting warning in logs:
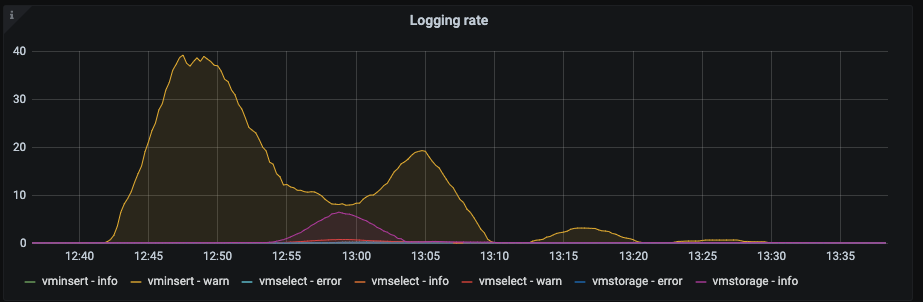
like these:
2020-08-17T09:41:42.272Z warn VictoriaMetrics/app/vminsert/main.go:187 remoteAddr: "10.32.148.8:35832"; error in "/insert/0/prometheus/api/v1/import/prometheus": cannot read Prometheus exposition data: unexpected EOF
...
2020-08-17T09:41:52.915Z warn VictoriaMetrics/app/vminsert/main.go:160 remoteAddr: "10.34.52.118:54032"; error in "/insert/0/prometheus": cannot handle more than 16 concurrent inserts during 1m0s; possible solutions: increase `-insert.maxQueueDuration`, increase `-maxConcurrentInserts`, increase server capacity
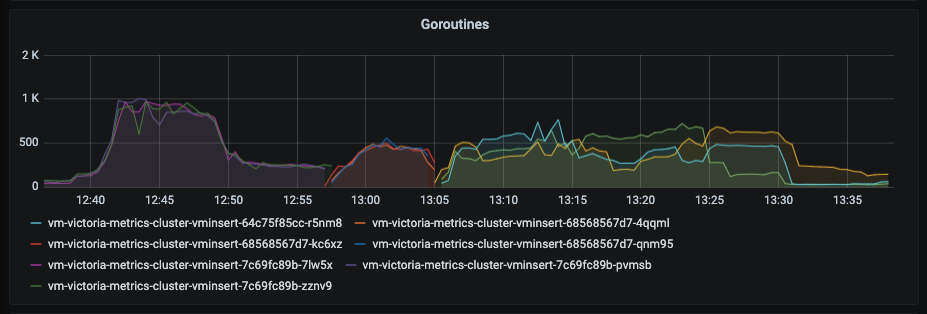
At the same time I see vminserts' goroutines number increased:
concurrent inserts are again at max:
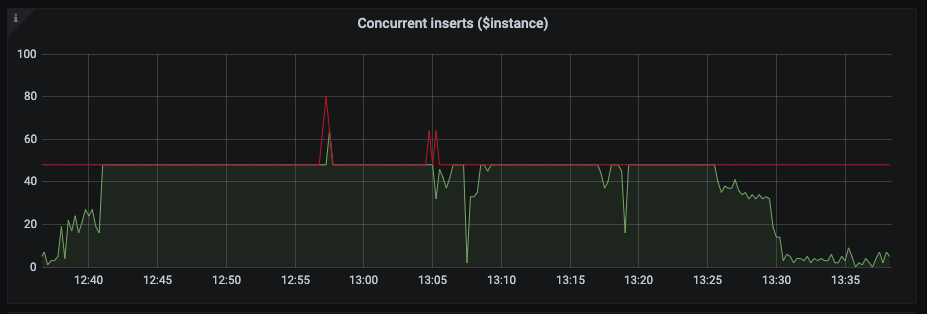
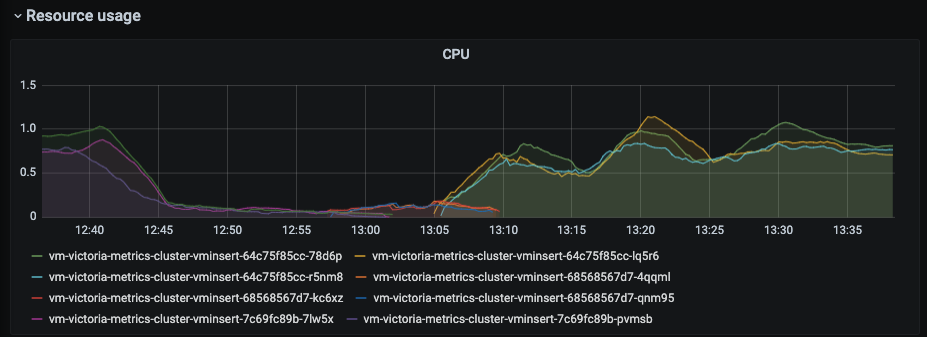
while CPU usage decreased to zero
and memory is almost at maximum
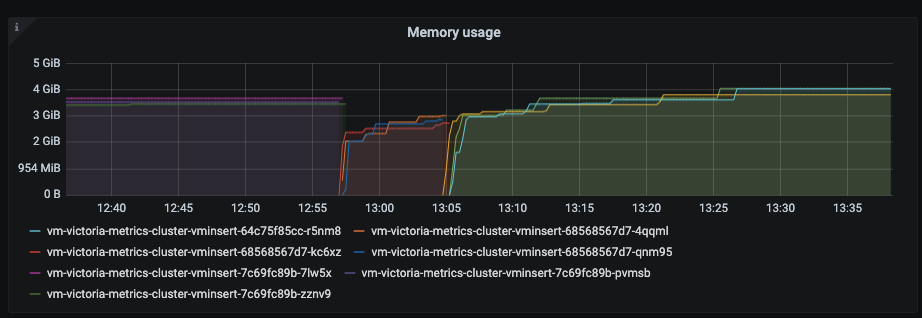
Then I tried to restart vminsert but with no luck this time. I restarted vmstorage and then vminserts - the ingestion rate started growing and eventually stabilized but I still observed maximum concurrent inserts from vminsert for some time.
Is it OK to have such rapid growth in concurrent vminserts? Does it all mean that we simply need to increase vmstorage resources?
Attaching goroutines and CPU profiles of vminserts, maybe it helps somehow.
cpu.zip
goroutine.zip
Unfortunately, I didn't notice high memory usage then, so I didn't collect memory profiles.
vpedosyuk
on 17 Aug 2020
Happened again, this time I see no more than 6% slow inserts and 2.5k churn rate; again maximum concurrent inserts, lowered CPU usage, and a 7-8 times increased number of goroutines.
Can it be related to the data we send or the way we send the data?
Attaching vminserts profiles for goroutines, CPU, and memory. This time I didn't restart anything so the profiles should be "cleaner" I guess.
goroutine.zip
memory.zip
cpu.zip
vpedosyuk
on 18 Aug 2020
Does it all mean that we simply need to increase vmstorage resources?
It looks like so. There are chances that the increased time series churn rate could lead to the issue. Could you share graphs for vmstorage nodes from the official Grafana dashboard on the same time range?
valyala
on 3 Sep 2020
Sorry for the late response on this. We've got only 7 days of retention for monitoring of monitoring so no graphs for vmstorage on that particular time range, unfortunately.
Regarding the issue, we've first replaced HDD with SSD, the situation got better, then we increased RAM for vmstorage pods (in total +28 GB). As a result, it happens less often and restores itself faster. Thanks.
vpedosyuk
on 14 Sep 2020
Related issues
 EricAntoni
·
3Comments
EricAntoni
·
3Comments
 sh0rez
·
3Comments
sh0rez
·
3Comments
 oOHenry
·
4Comments
valyala
·
4Comments
oOHenry
·
4Comments
valyala
·
4Comments
 ozn0417
·
3Comments
ozn0417
·
3Comments