Victoriametrics: Victoria-metrics data usage started growing
Describe the bug
Hello,
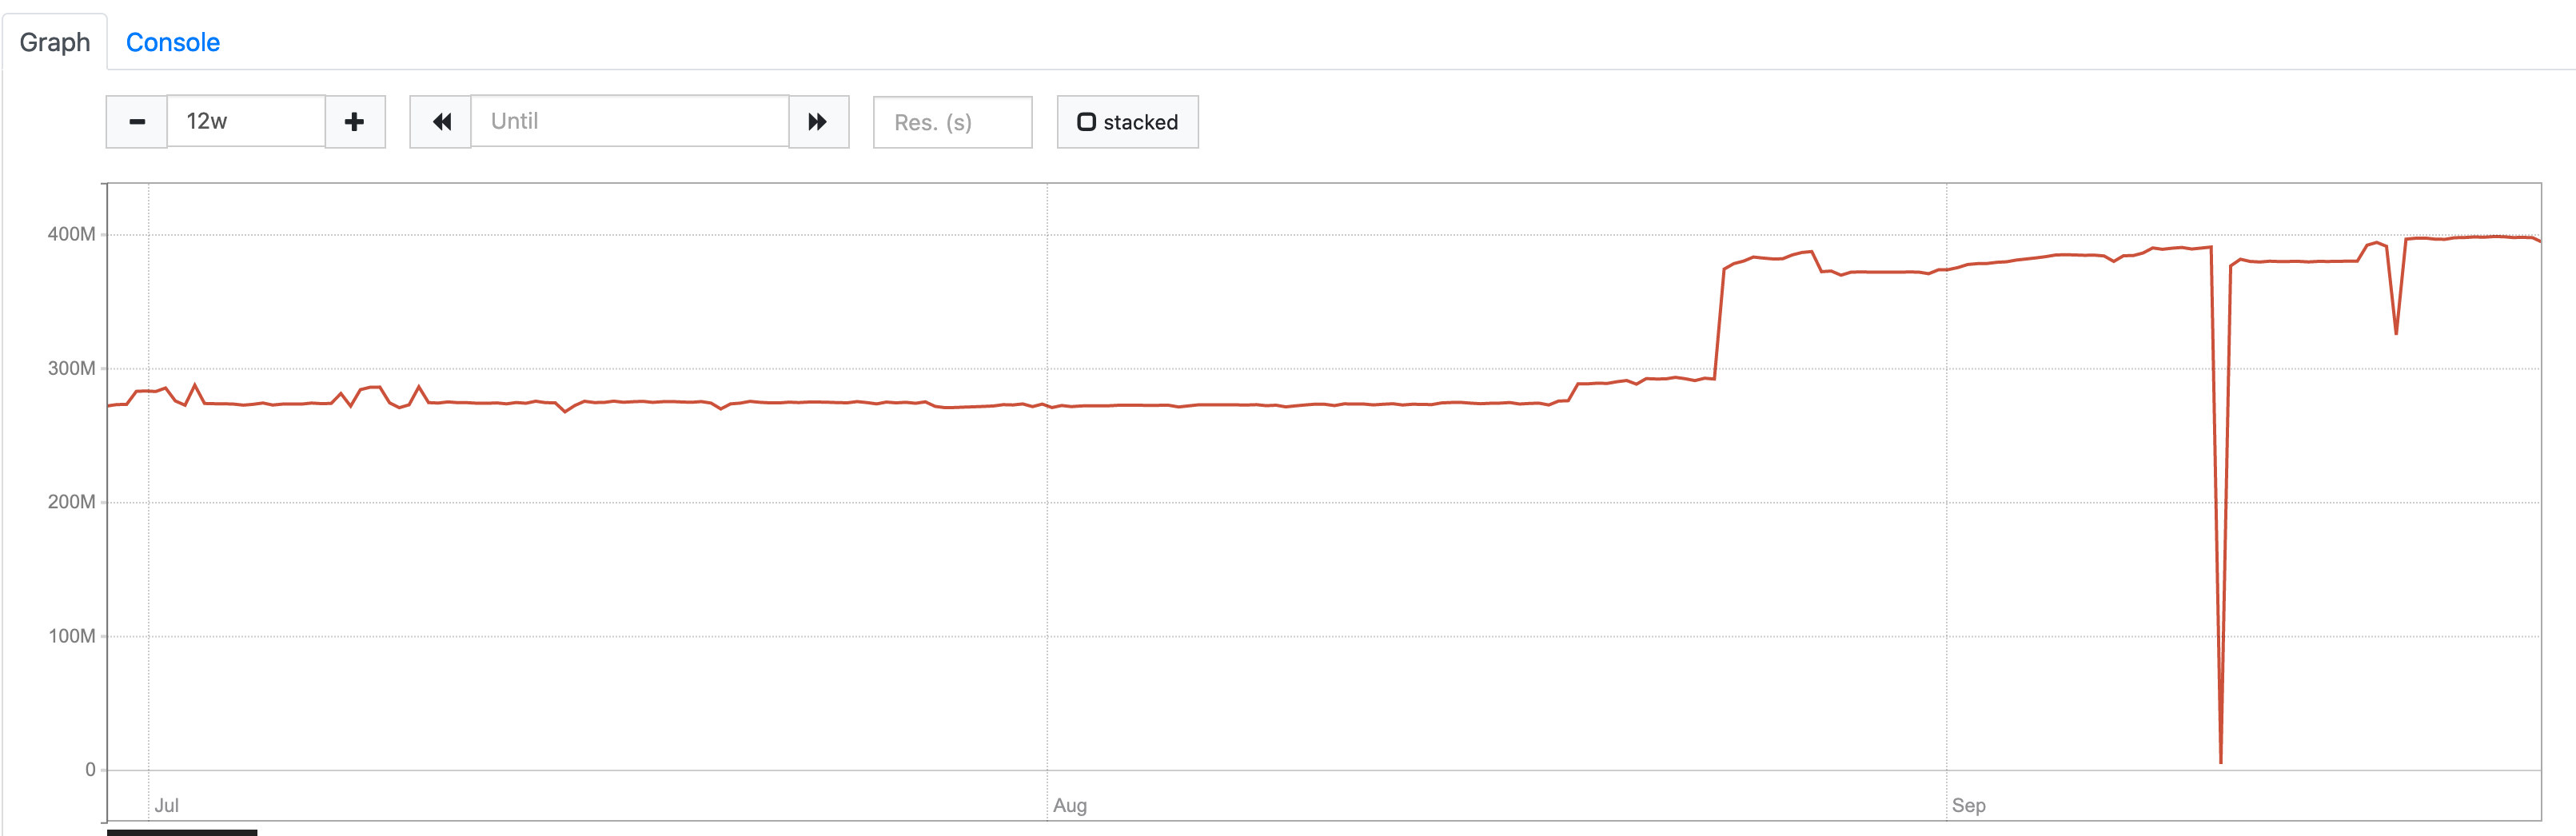
I'm trying to identify problem where VM storage suddenly began to grow.
VM was running for about half a year without any problems, then we noticed, that at some point (July 3) storage began to grow. Yet there is no visible increase on write requests to VM write endpoint. It doesn't seem that there is any significant increase on new series either.
Expected behavior
See linear increase on used storage.
Screenshots
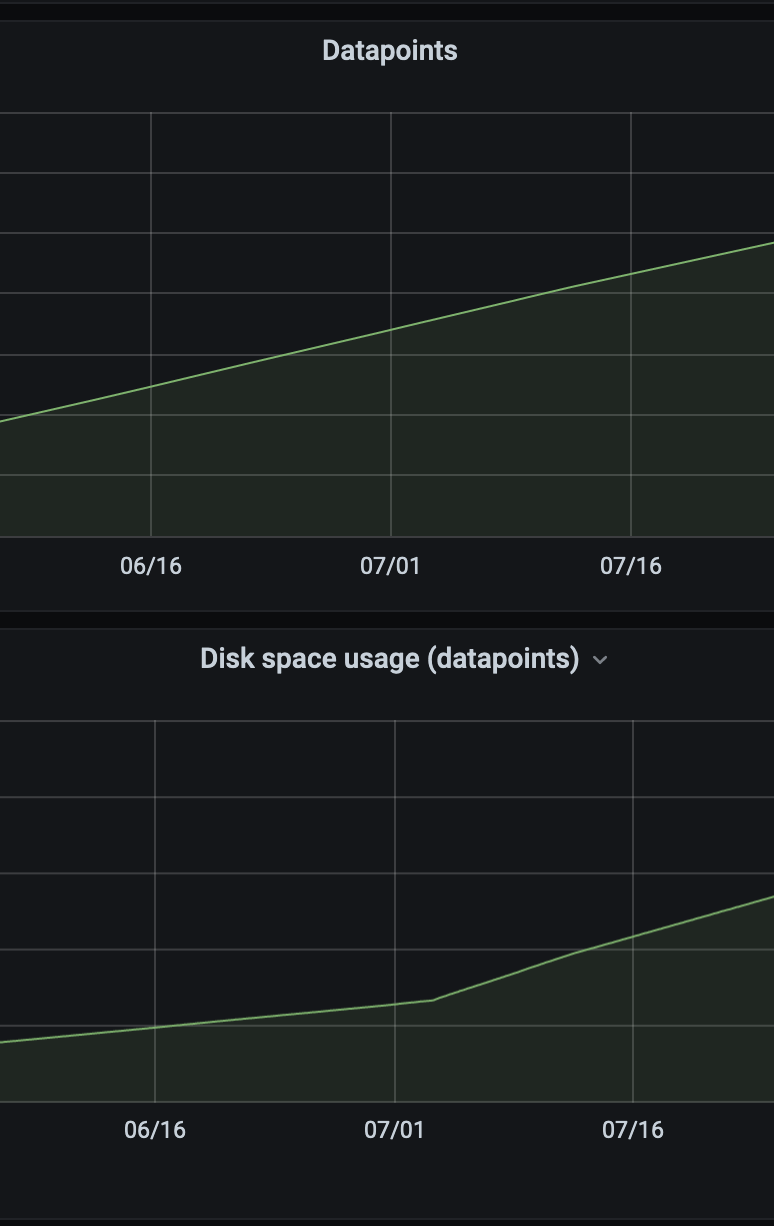
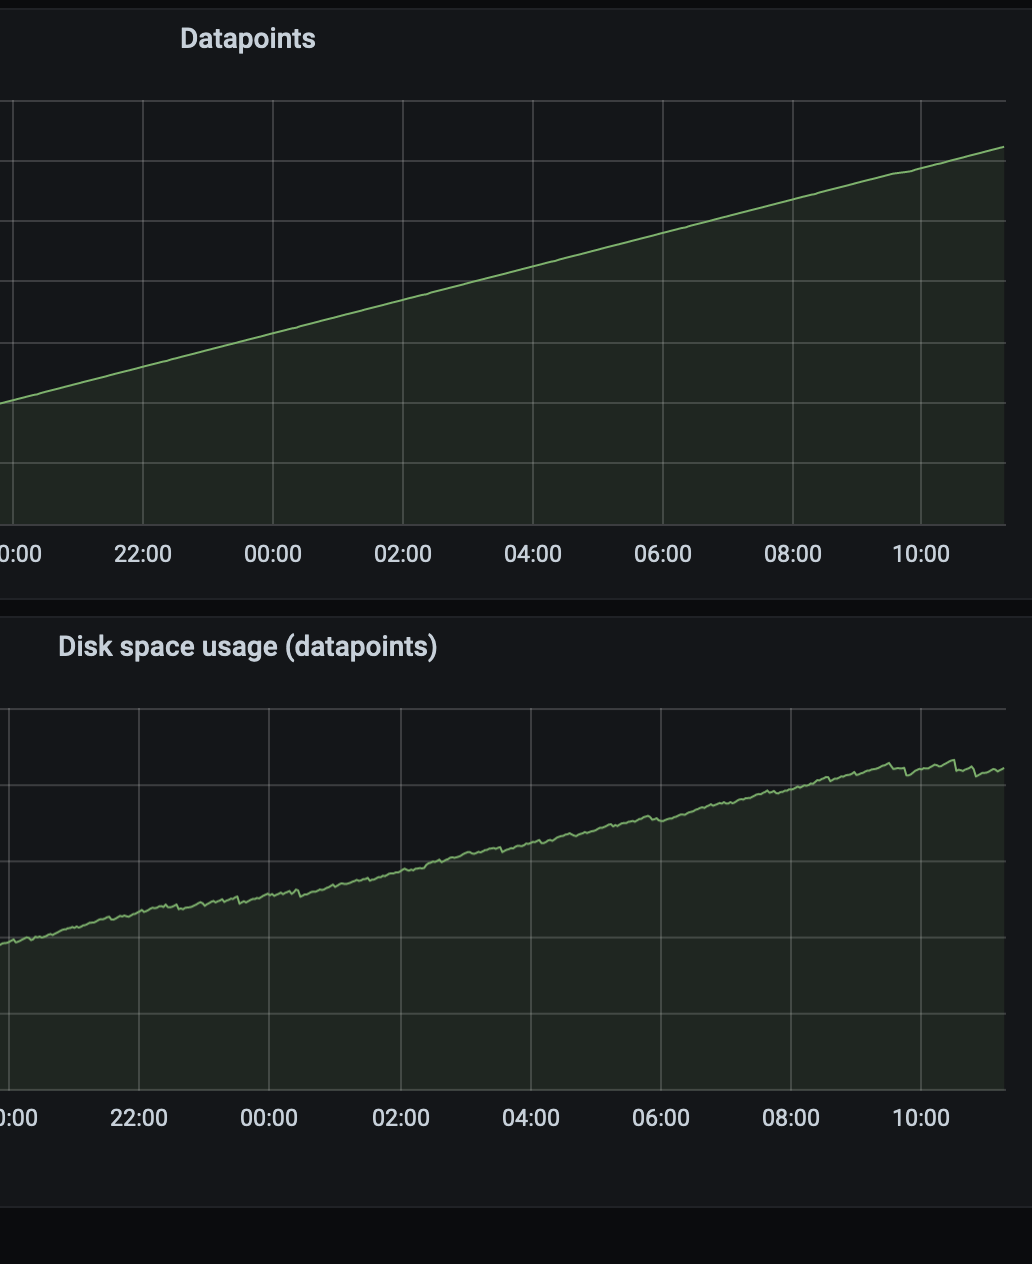
Used storage suddenly begins increasing:

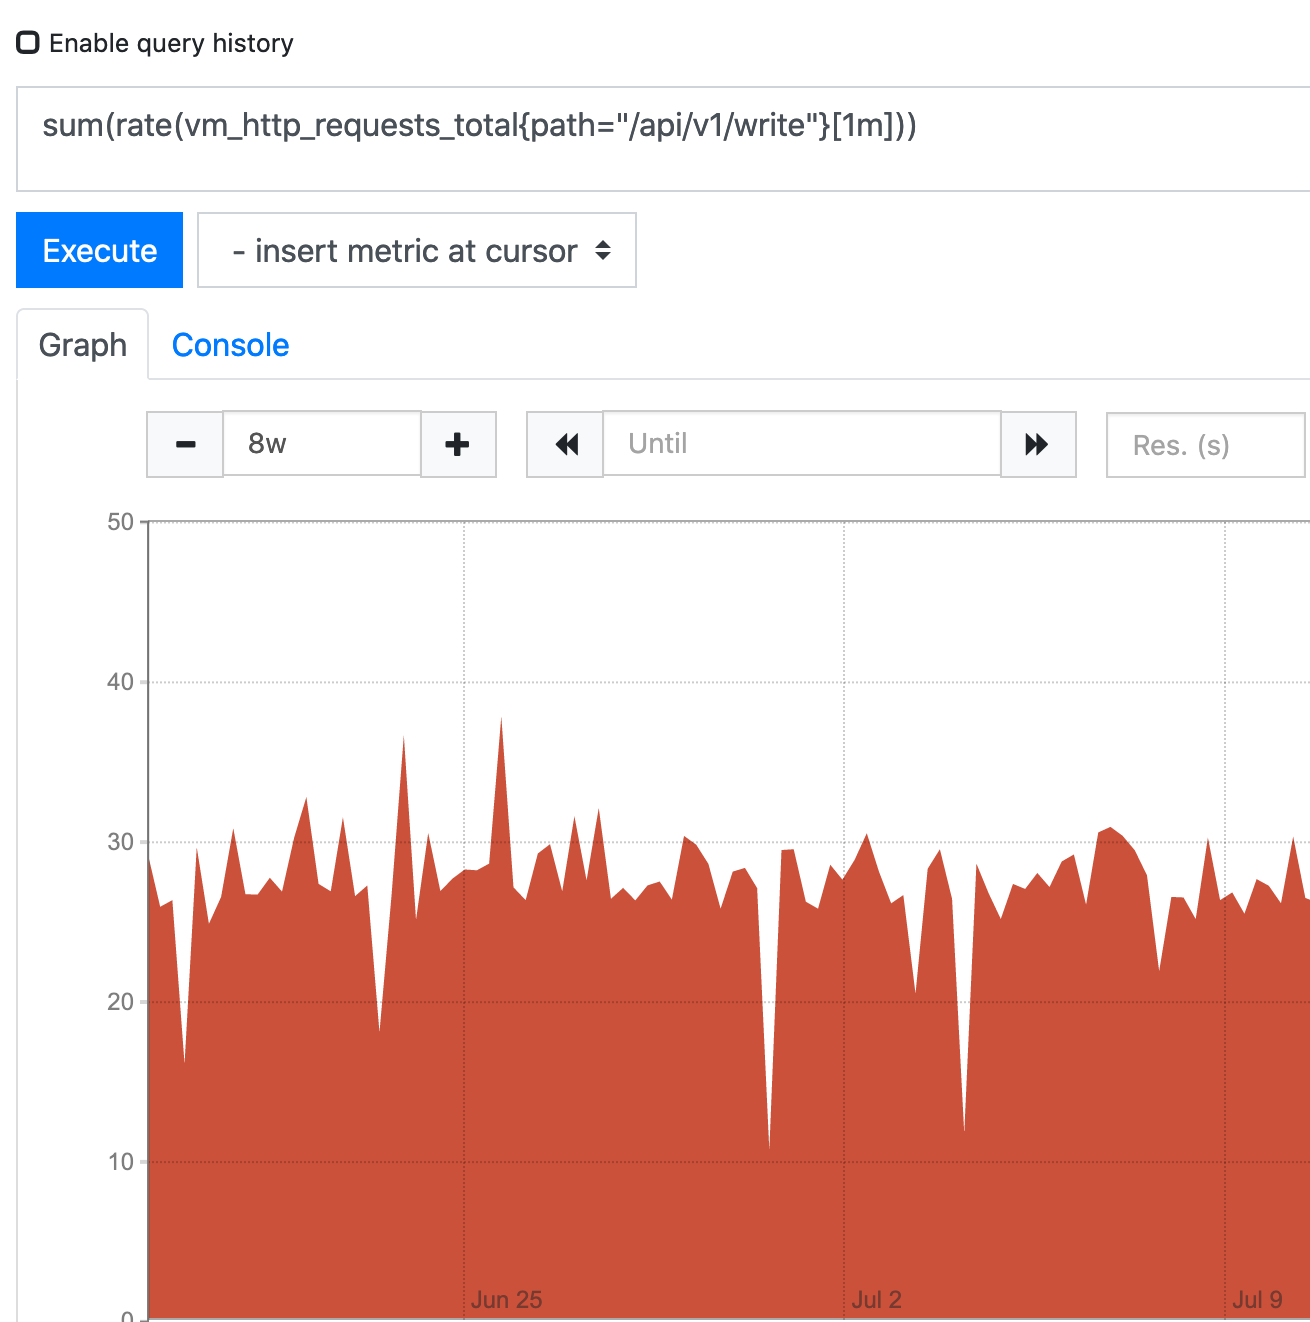
No visible increase of requests to write endpoint:
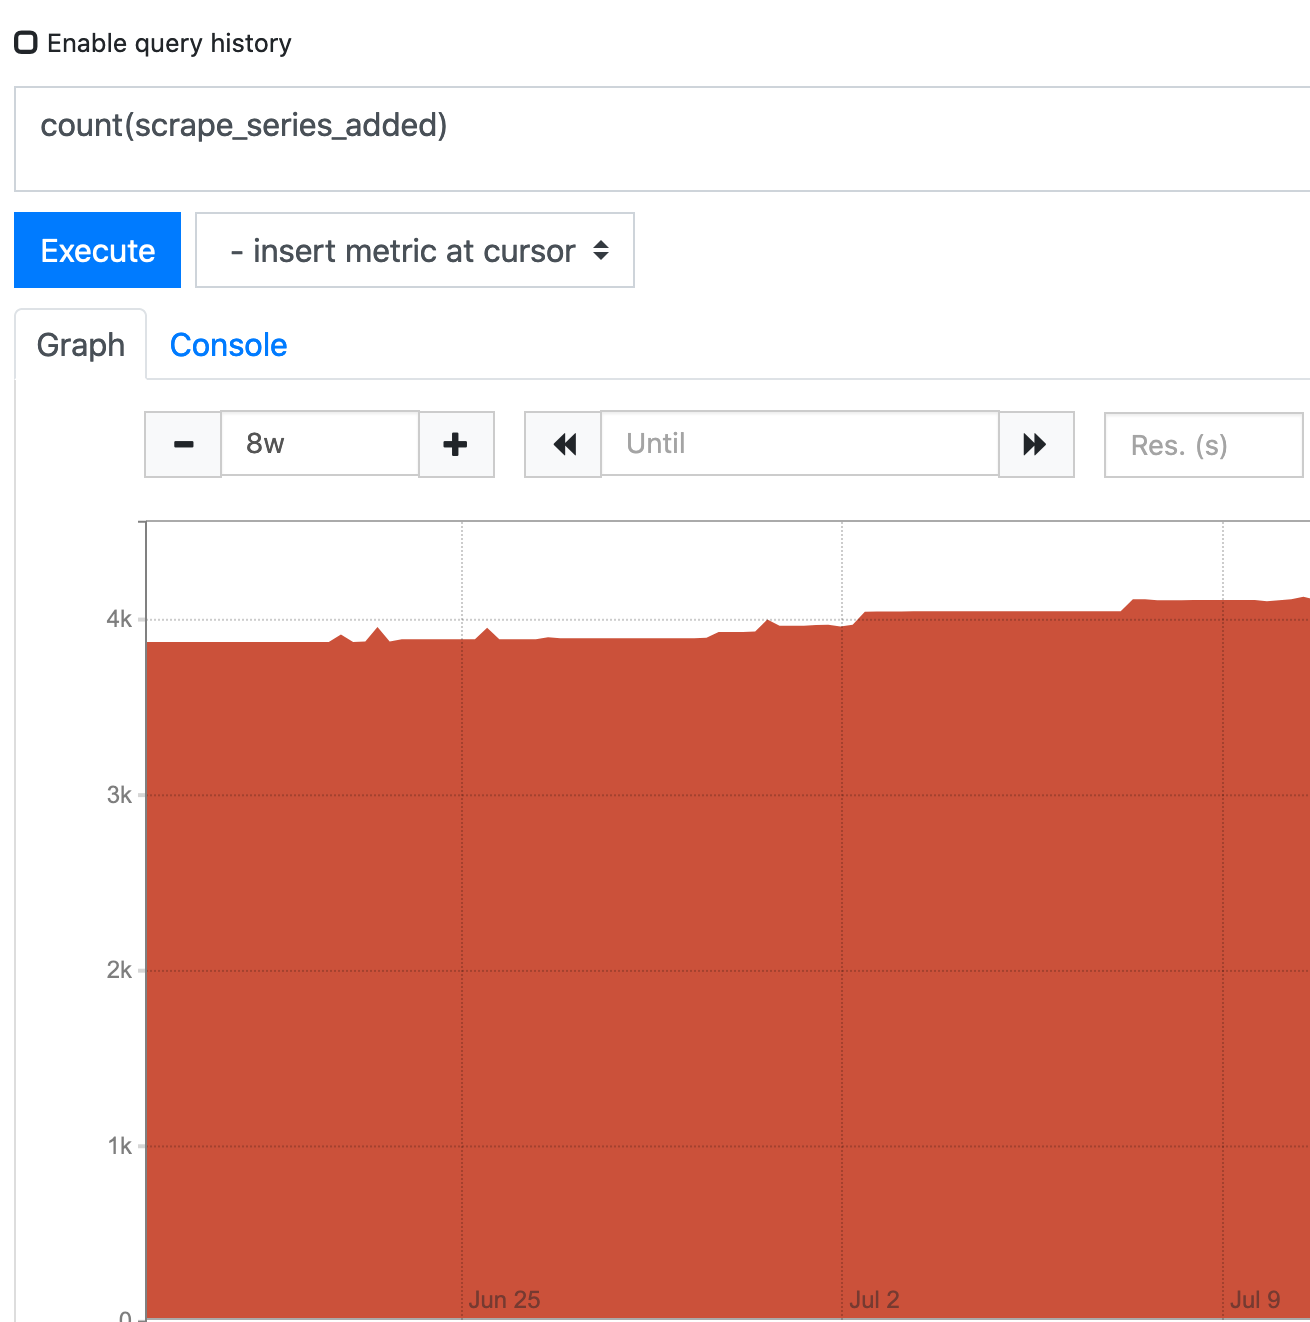
No significant increase ow new time series:
Version
The line returned when passing --version command line flag to binary. For example:
$ ./victoria-metrics-prod --version
victoria-metrics-20200521-144539-tags-v1.35.6-0-g8905bc2a4
Used command-line flags
flag{name="bigMergeConcurrency", value="0"} 1
flag{name="csvTrimTimestamp", value="1ms"} 1
flag{name="dedup.minScrapeInterval", value="0s"} 1
flag{name="deleteAuthKey", value="secret"} 1
flag{name="enableTCP6", value="false"} 1
flag{name="envflag.enable", value="false"} 1
flag{name="envflag.prefix", value=""} 1
flag{name="fs.disableMmap", value="false"} 1
flag{name="graphiteListenAddr", value="0.0.0.0:2003"} 1
flag{name="graphiteTrimTimestamp", value="1s"} 1
flag{name="http.disableResponseCompression", value="false"} 1
flag{name="http.maxGracefulShutdownDuration", value="7s"} 1
flag{name="http.pathPrefix", value=""} 1
flag{name="http.shutdownDelay", value="0s"} 1
flag{name="httpAuth.password", value="secret"} 1
flag{name="httpAuth.username", value=""} 1
flag{name="httpListenAddr", value="0.0.0.0:8428"} 1
flag{name="import.maxLineLen", value="104857600"} 1
flag{name="influxListenAddr", value=""} 1
flag{name="influxMeasurementFieldSeparator", value="_"} 1
flag{name="influxSkipSingleField", value="false"} 1
flag{name="influxTrimTimestamp", value="1ms"} 1
flag{name="insert.maxQueueDuration", value="1m0s"} 1
flag{name="loggerFormat", value="default"} 1
flag{name="loggerLevel", value="INFO"} 1
flag{name="loggerOutput", value="stderr"} 1
flag{name="maxConcurrentInserts", value="224"} 1
flag{name="maxInsertRequestSize", value="335544320"} 1
flag{name="maxLabelsPerTimeseries", value="30"} 1
flag{name="memory.allowedPercent", value="60"} 1
flag{name="metricsAuthKey", value="secret"} 1
flag{name="opentsdbHTTPListenAddr", value=""} 1
flag{name="opentsdbListenAddr", value=""} 1
flag{name="opentsdbTrimTimestamp", value="1s"} 1
flag{name="opentsdbhttp.maxInsertRequestSize", value="33554432"} 1
flag{name="opentsdbhttpTrimTimestamp", value="1ms"} 1
flag{name="pprofAuthKey", value="secret"} 1
flag{name="precisionBits", value="64"} 1
flag{name="promscrape.config", value=""} 1
flag{name="promscrape.config.dryRun", value="false"} 1
flag{name="promscrape.config.strictParse", value="false"} 1
flag{name="promscrape.configCheckInterval", value="0s"} 1
flag{name="promscrape.consulSDCheckInterval", value="30s"} 1
flag{name="promscrape.disableCompression", value="false"} 1
flag{name="promscrape.discovery.concurrency", value="500"} 1
flag{name="promscrape.discovery.concurrentWaitTime", value="1m0s"} 1
flag{name="promscrape.dnsSDCheckInterval", value="30s"} 1
flag{name="promscrape.ec2SDCheckInterval", value="1m0s"} 1
flag{name="promscrape.fileSDCheckInterval", value="30s"} 1
flag{name="promscrape.gceSDCheckInterval", value="1m0s"} 1
flag{name="promscrape.kubernetesSDCheckInterval", value="30s"} 1
flag{name="promscrape.maxScrapeSize", value="16777216"} 1
flag{name="promscrape.suppressScrapeErrors", value="false"} 1
flag{name="retentionPeriod", value="12"} 1
flag{name="search.cacheTimestampOffset", value="5m0s"} 1
flag{name="search.disableCache", value="false"} 1
flag{name="search.latencyOffset", value="30s"} 1
flag{name="search.logSlowQueryDuration", value="5s"} 1
flag{name="search.maxConcurrentRequests", value="16"} 1
flag{name="search.maxExportDuration", value="720h0m0s"} 1
flag{name="search.maxLookback", value="0s"} 1
flag{name="search.maxPointsPerTimeseries", value="30000"} 1
flag{name="search.maxQueryDuration", value="30s"} 1
flag{name="search.maxQueryLen", value="16384"} 1
flag{name="search.maxQueueDuration", value="10s"} 1
flag{name="search.maxStalenessInterval", value="0s"} 1
flag{name="search.maxTagKeys", value="secret"} 1
flag{name="search.maxTagValues", value="100000"} 1
flag{name="search.maxUniqueTimeseries", value="300000"} 1
flag{name="search.minStalenessInterval", value="0s"} 1
flag{name="search.resetCacheAuthKey", value="secret"} 1
flag{name="selfScrapeInstance", value="self"} 1
flag{name="selfScrapeInterval", value="0s"} 1
flag{name="selfScrapeJob", value="victoria-metrics"} 1
flag{name="smallMergeConcurrency", value="0"} 1
flag{name="snapshotAuthKey", value="secret"} 1
flag{name="storageDataPath", value="/var/lib/victoria_metrics"} 1
flag{name="tls", value="false"} 1
flag{name="tlsCertFile", value=""} 1
flag{name="tlsKeyFile", value="secret"} 1
flag{name="version", value="false"} 1
Additional context
The only thing that happened around that time is we upgraded prometheus from 2.16.0 to 2.19.2.
Is there any way to go deeper into debugging this? Thank you.
 Seitanas
All 18 comments
It is recommended setting up the official Grafana dashboard for VictoriaMetrics according to these docs. The dashboard will give insights on VictoriaMetrics state, which may explain data usage growth. For instance, the dashboard contains graphs on data ingestion rate and on the number of data points in the database.
 valyala
on 14 Aug 2020
valyala
on 14 Aug 2020
We have this dashboard. It does not show anything unusual though:

Seitanas
on 17 Aug 2020
Hello, we still not being able to identify problem. Today we decided to downgrade Prometheus to last version space usage was good (2.16.0). And it seems that it helped. - datapoint count is still increasing, yet increase on disk usage slowed down:
Seitanas
on 25 Aug 2020
Hi @Seitanas! Could you pls update dashboard to the latest version? It is recommended to update VM as well but it is up to you. Could you pls also provide screenshots for the following panels:
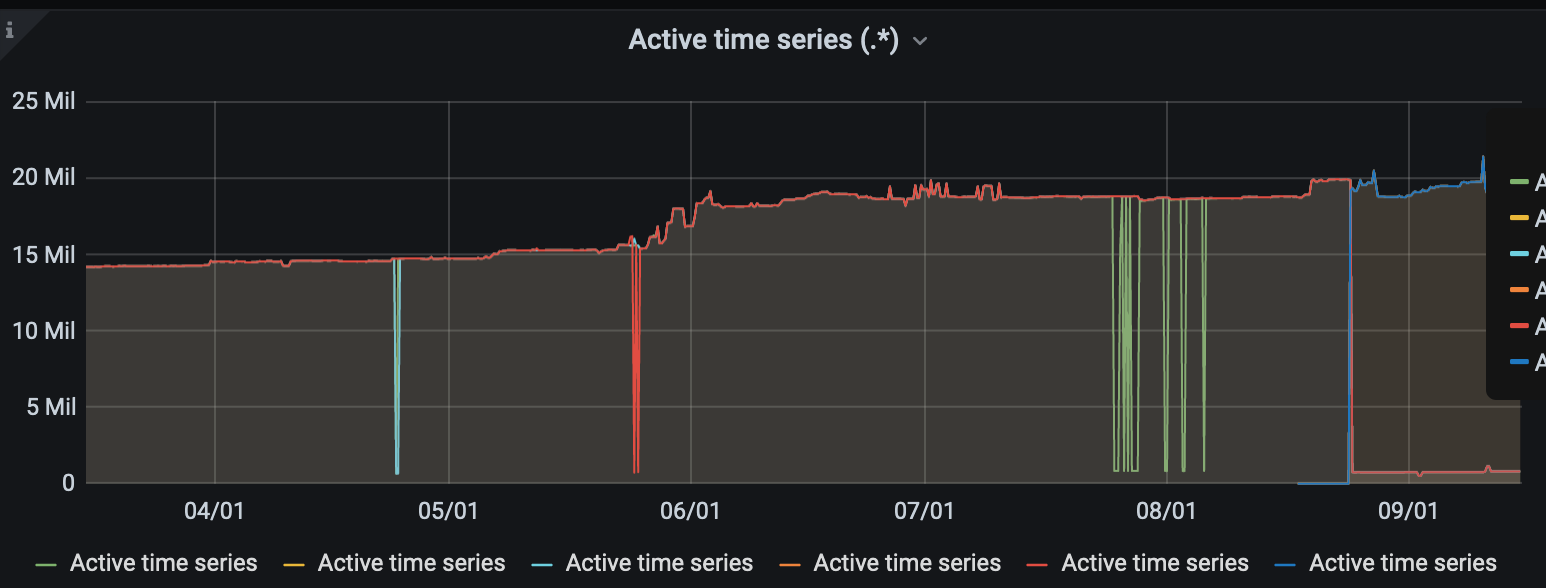
- Active time series
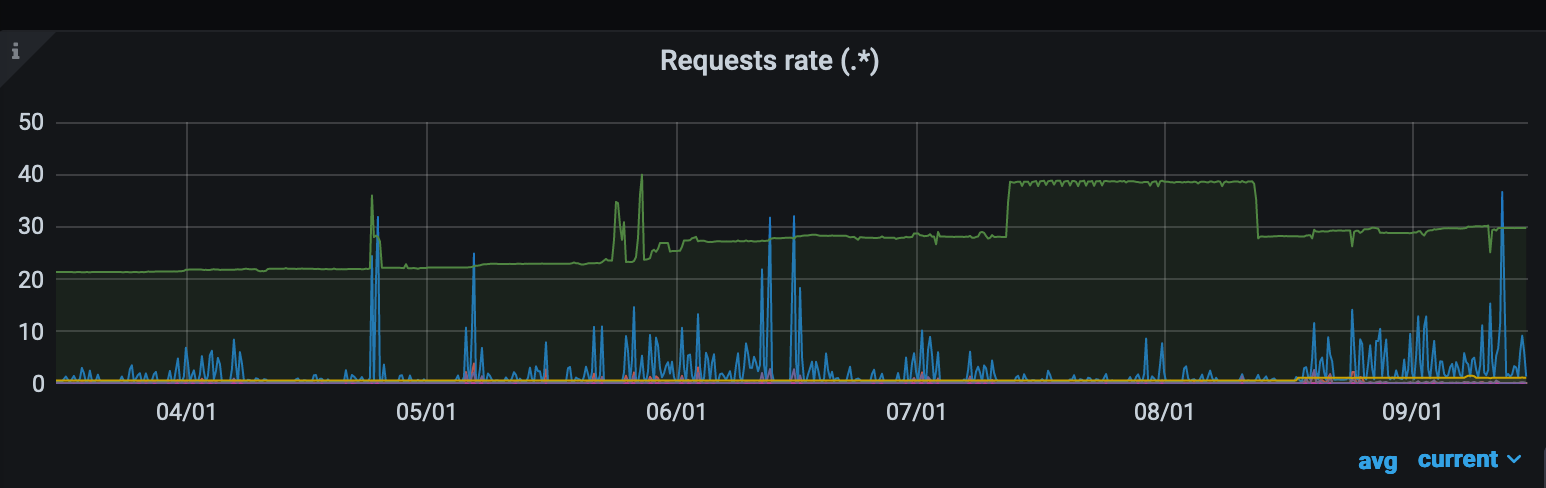
- Requests rate (specifically
api/v1/writeendpoint) - Datapoints ingestion rate
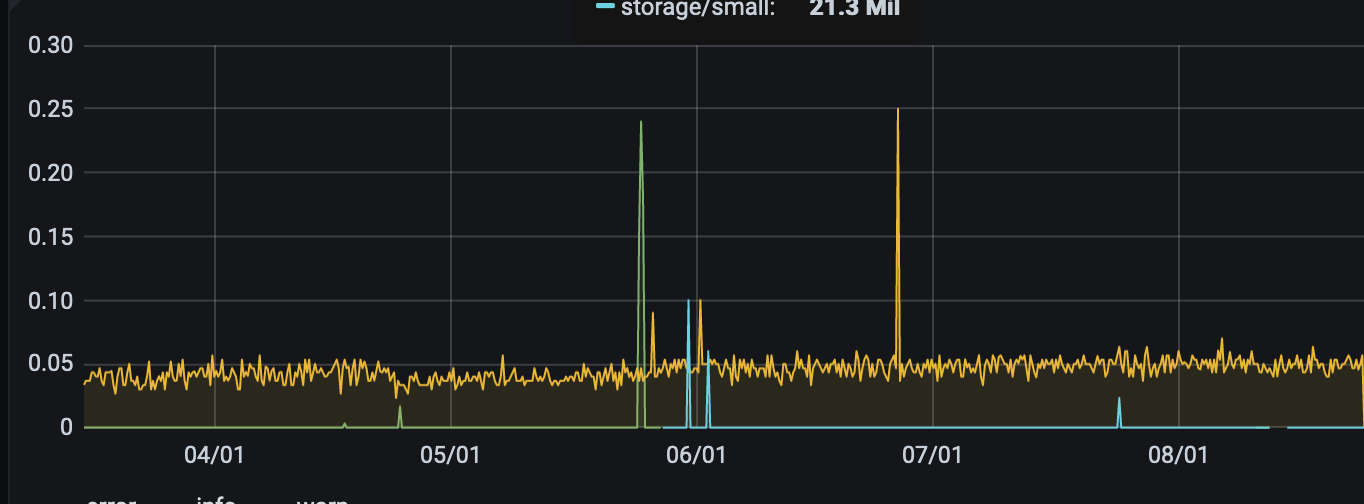
- Logging rate
- Churn rate
- Slow inserts
From Prometheus side would be nice to get graphs for following metrics:
- rate(prometheus_remote_storage_samples_in_total)
- rate(prometheus_remote_storage_succeeded_samples_total)
- rate(prometheus_remote_storage_dropped_samples_total)
Would be great to get the screenshots including both old and new Prometheus version switches.
 hagen1778
on 15 Sep 2020
hagen1778
on 15 Sep 2020
Hello @hagen1778,
Graphs:
Active time series:
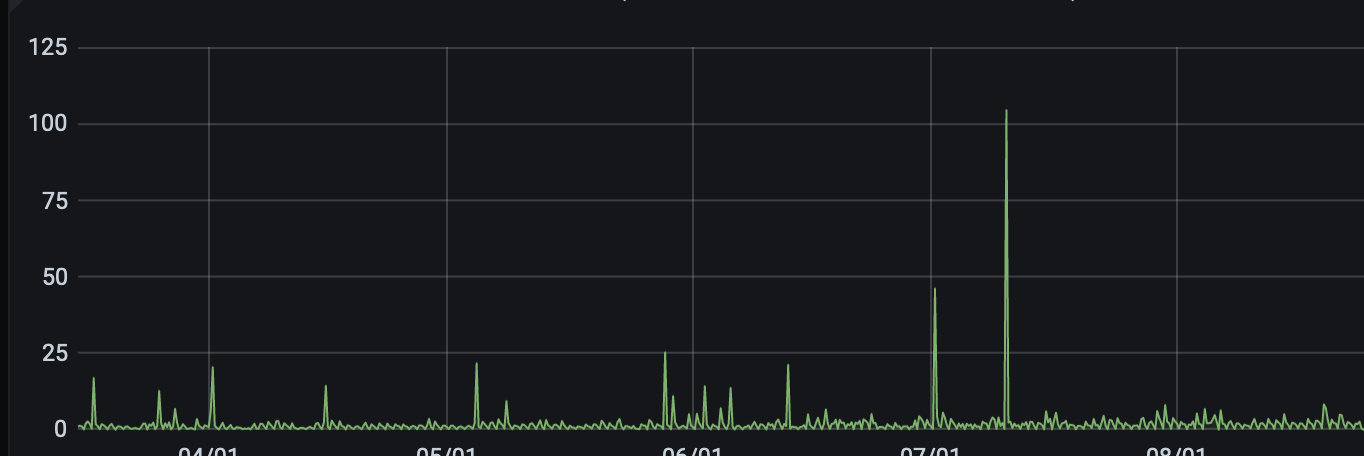
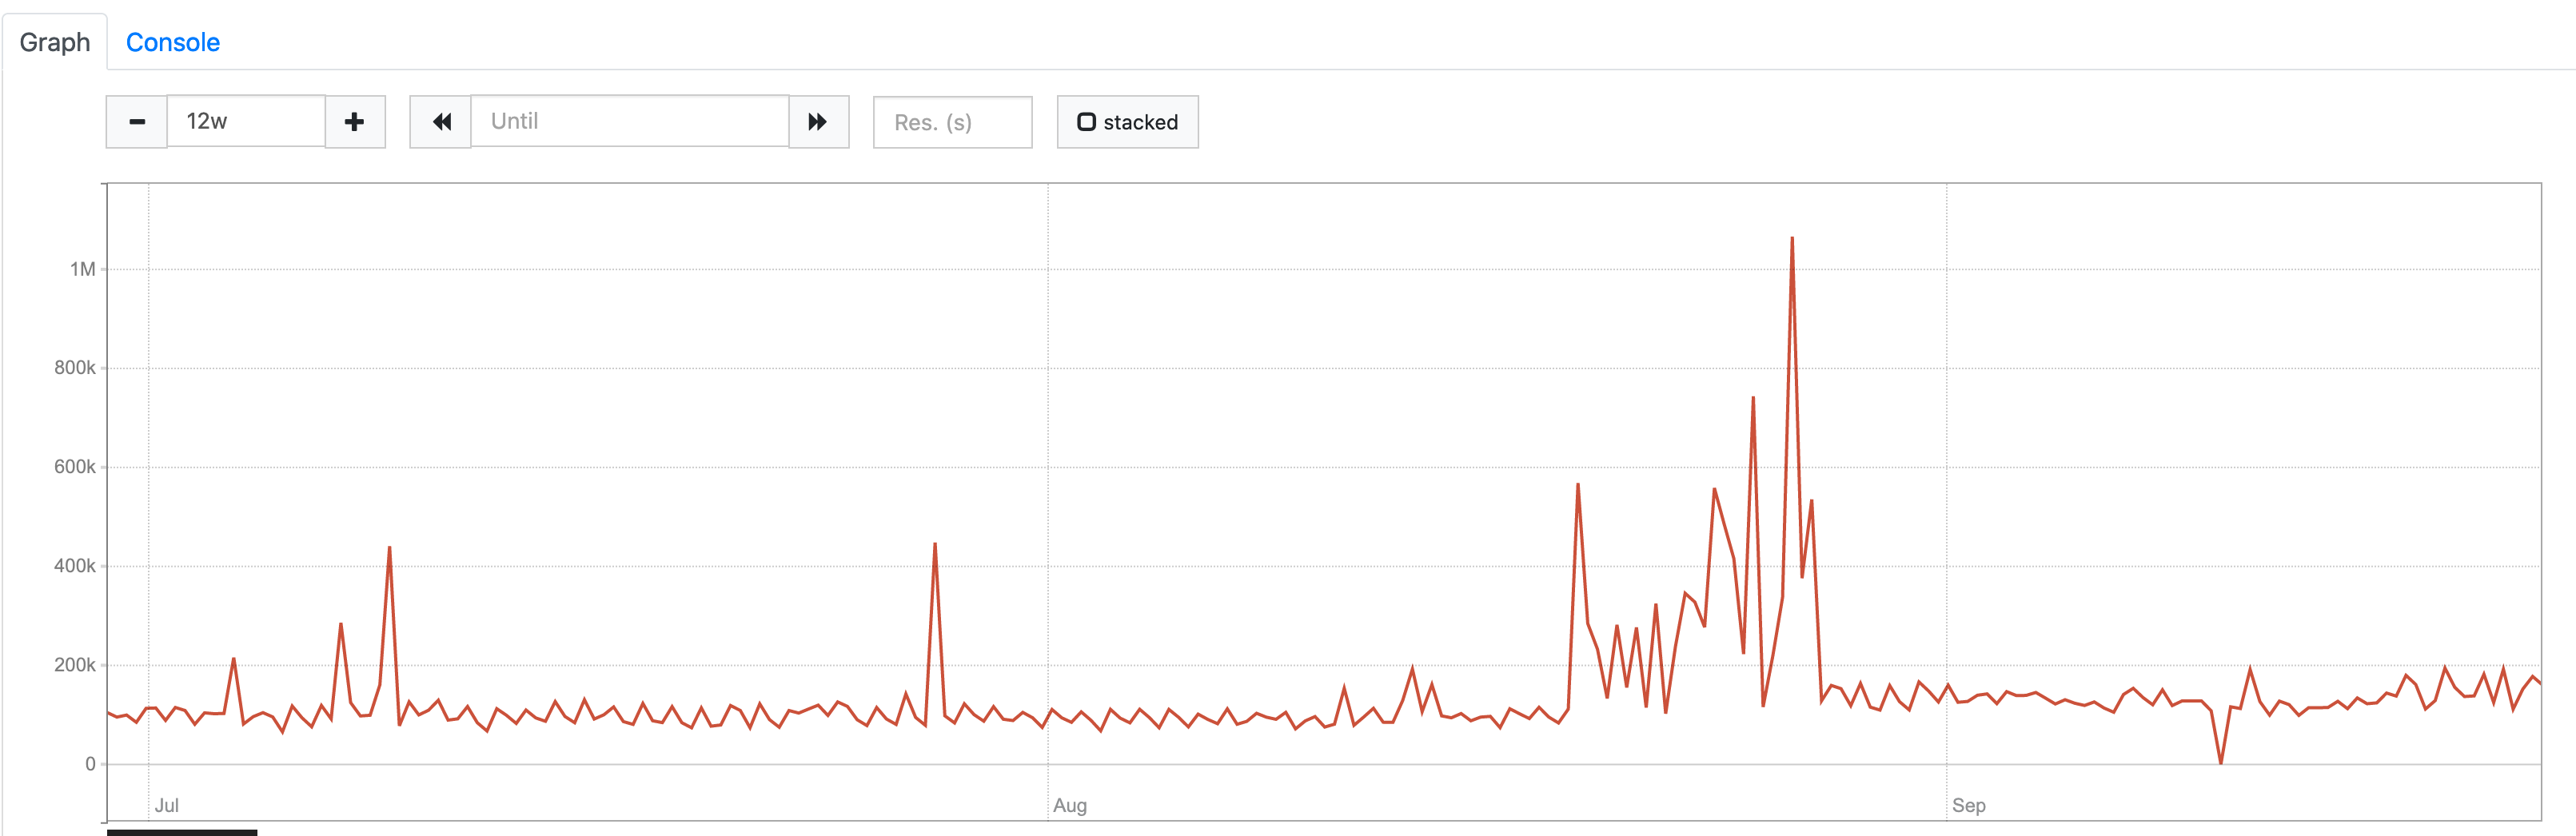
Requests rate:
Datapoints ingestion rate:
Logging rate:
Churn rate:
Slow inserts:
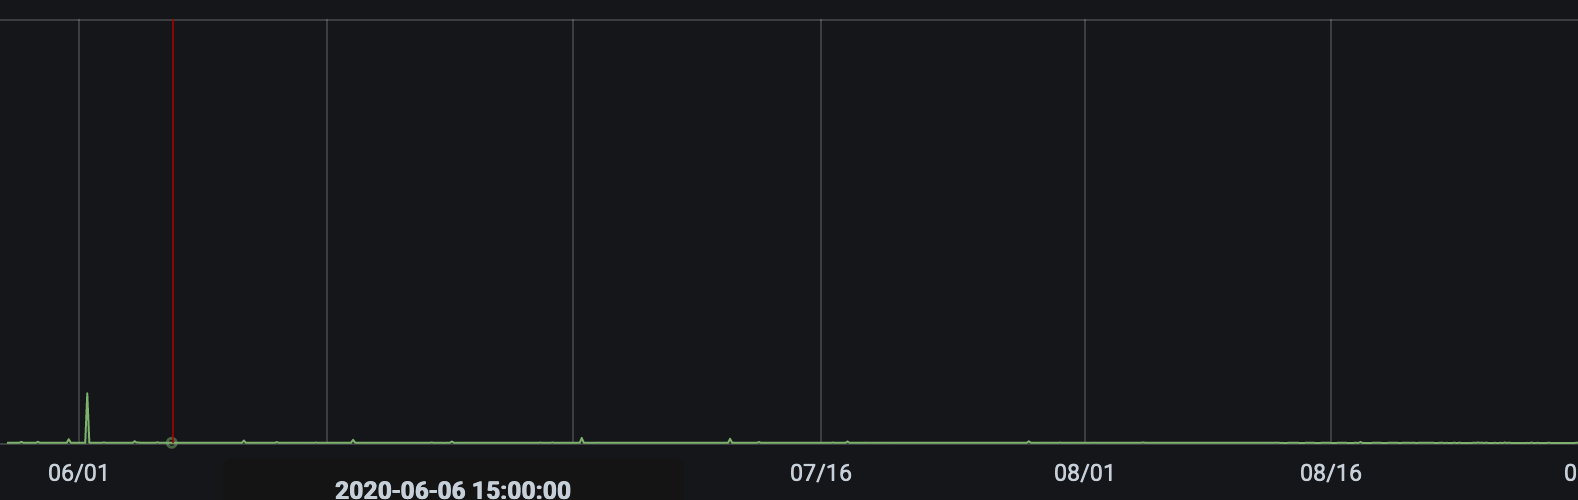
rate(prometheus_remote_storage_samples_in_total):
rate(prometheus_remote_storage_succeeded_samples_total):
rate(prometheus_remote_storage_dropped_samples_total):
_Prometheus upgrade happened at 07.03 Downgrade at 08.25_
Seitanas
on 15 Sep 2020
Thanks for screenshots! Can't see anything suspicious except of spike for Requests rate panel, but the screenshot is missing labels so I can't say what the spike exactly.
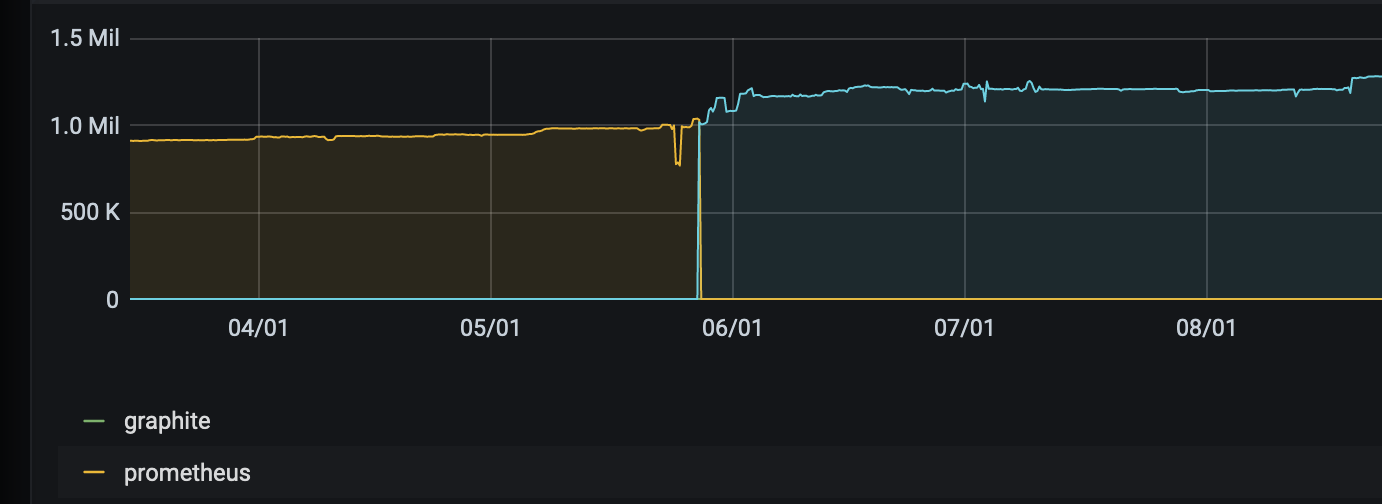
Another guess is that new Prom version started to write smaller batches or batches of different size, resulting into small data parts on disk. This could be checked by looking into storageDataPath folder and compare number of small and big parts for month 06 and 07.
Could you pls also check Prometheus shard metrics:
- prometheus_remote_storage_shards
- prometheus_remote_storage_pending_samples
hagen1778
on 15 Sep 2020
Hello,
big/small usage is as folows:
6.1G    /var/lib/victoria_metrics/data/small/2020_06/
927G    /var/lib/victoria_metrics/data/big/2020_06/
20G /var/lib/victoria_metrics/data/small/2020_07/
3.0T    /var/lib/victoria_metrics/data/big/2020_07/
prometheus_remote_storage_shards:
prometheus_remote_storage_pending_samples:
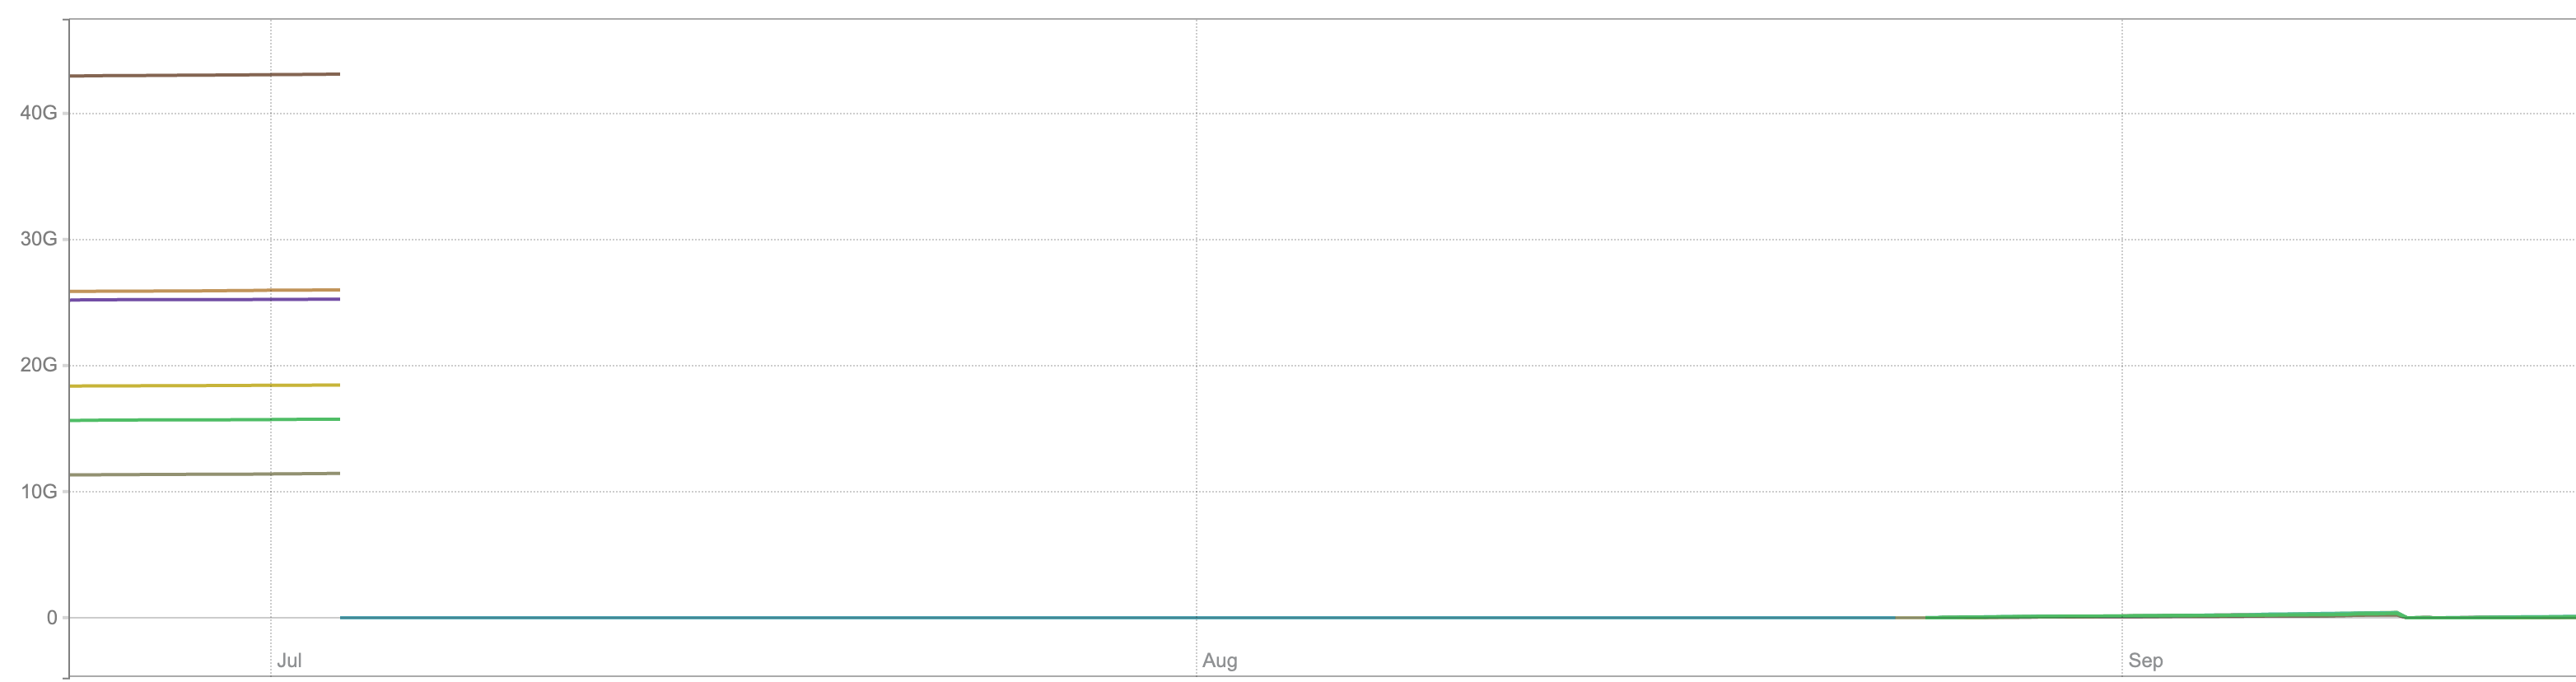
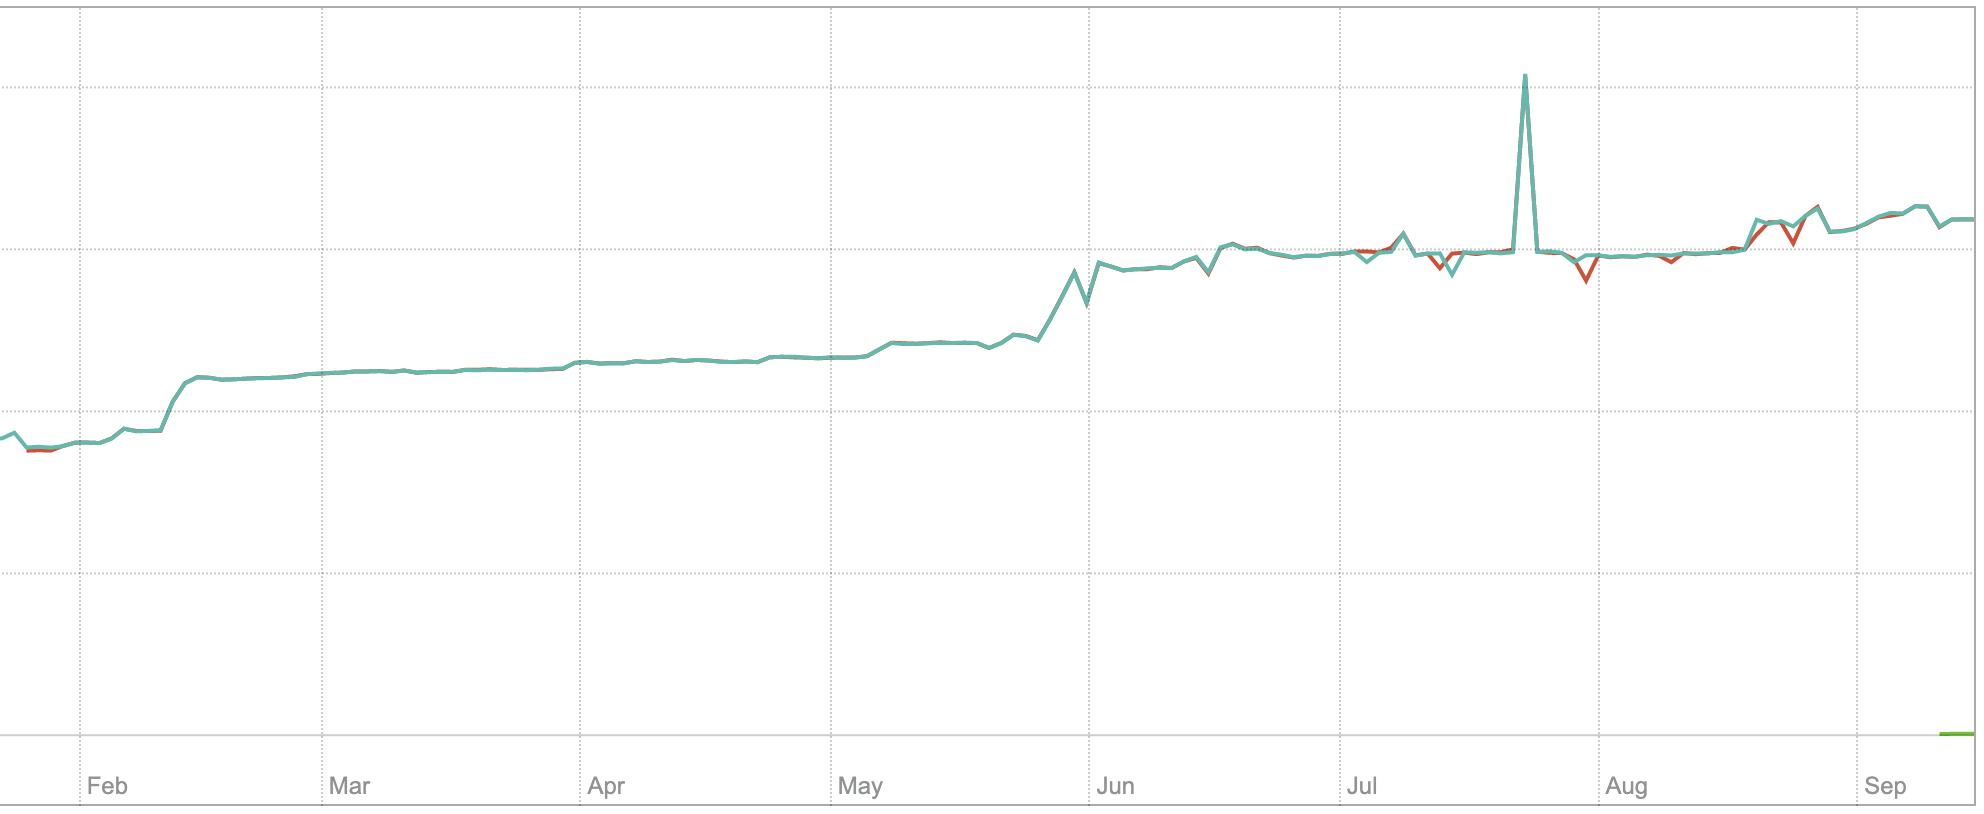
We also did some comparison against multiple prometheus versions, and it seems that with Prometheus 2.18.0 and newer prometheus_tsdb_storage_blocks_bytes also begins to grow:
Seitanas
on 16 Sep 2020
Thanks! Could you also compare a number of big/small parts per month? Pls also plot rate(vm_merges_total) and rate(vm_rows_merged_total) metrics for VM.
hagen1778
on 16 Sep 2020
By parts, i assume filecount in big/small directories? If so, then:
/var/lib/victoria_metrics/data/small/2020_06/
9
/var/lib/victoria_metrics/data/small/2020_07/
12
/var/lib/victoria_metrics/data/big/2020_06/
20
/var/lib/victoria_metrics/data/big/2020_07/
34
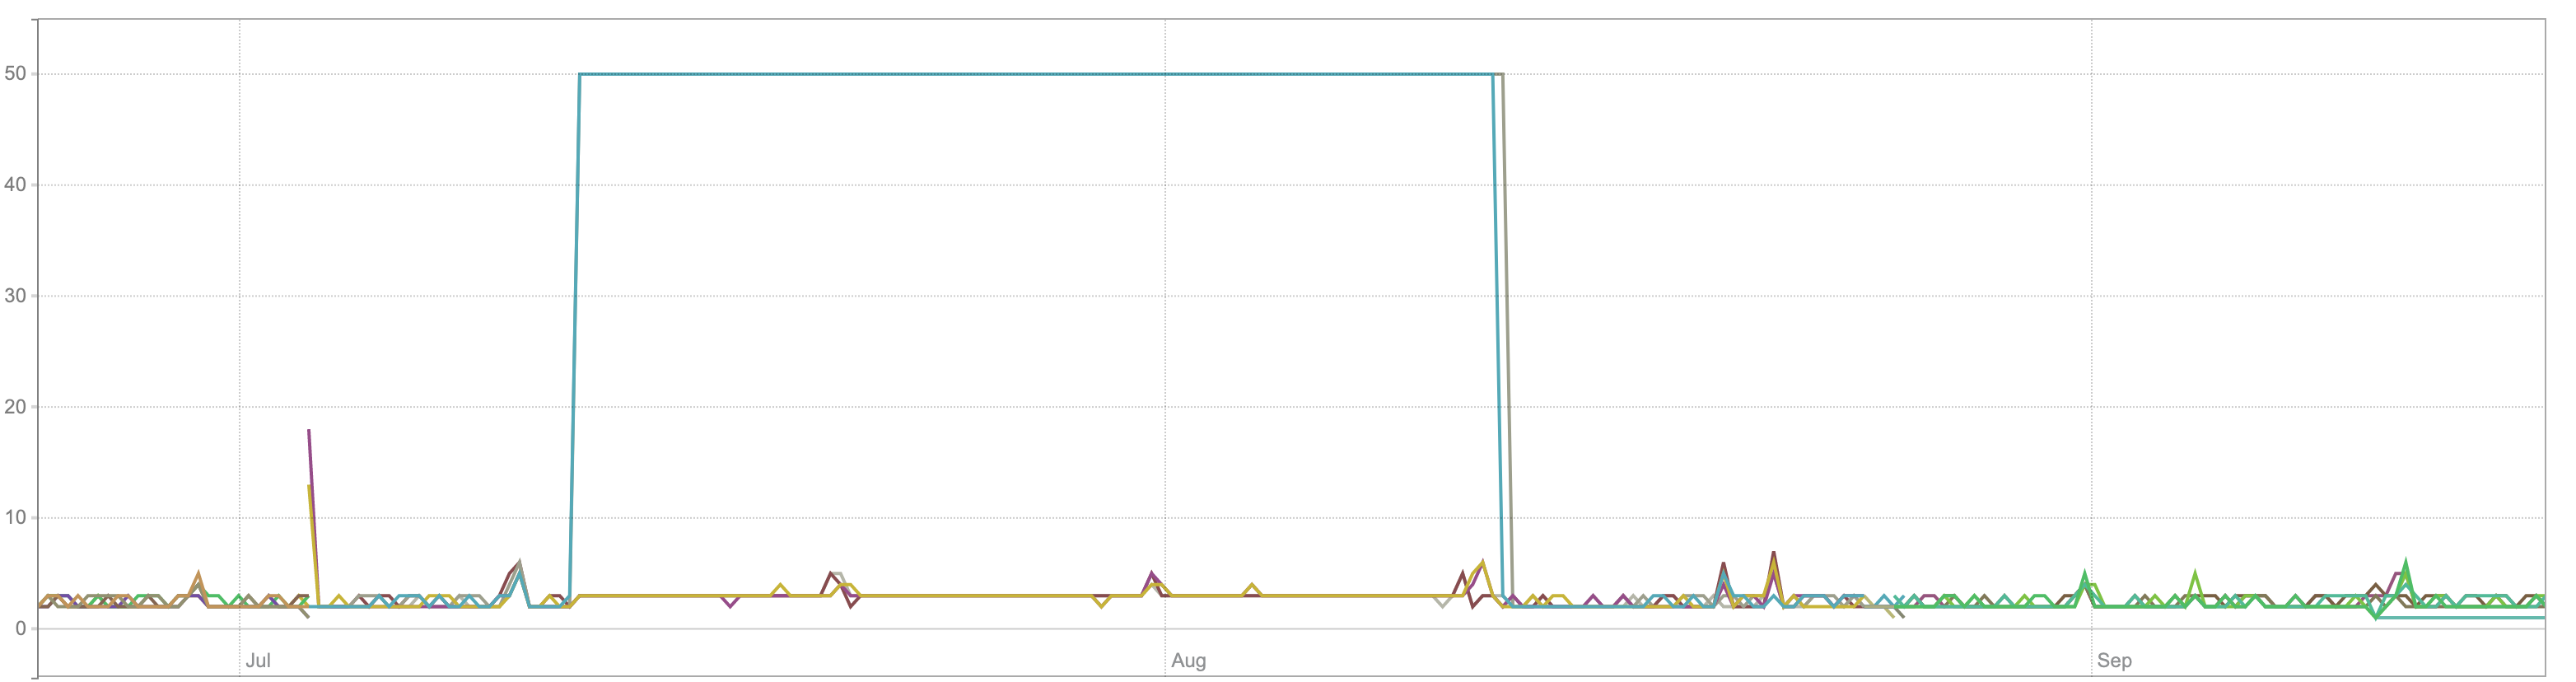
Graphs
rate(vm_merges_total):
rate(vm_rows_merged_total):
(At the end of August we added new VM servers, because old ones were full, - this is visible in graphs).
Seitanas
on 16 Sep 2020
@Seitanas , could you provide graph for sum(sum_over_time(scrape_series_added[5m])) on the time range that covers old and new Prometheus versions?
valyala
on 17 Sep 2020
It would be great also to see the graph for sum(sum_over_time(scrape_samples_scraped[5m])) on the same time range.
valyala
on 17 Sep 2020
@Seitanas , try substituting Prometheus with vmagent and see whether this helps reducing storage usage growth.
valyala
on 21 Sep 2020
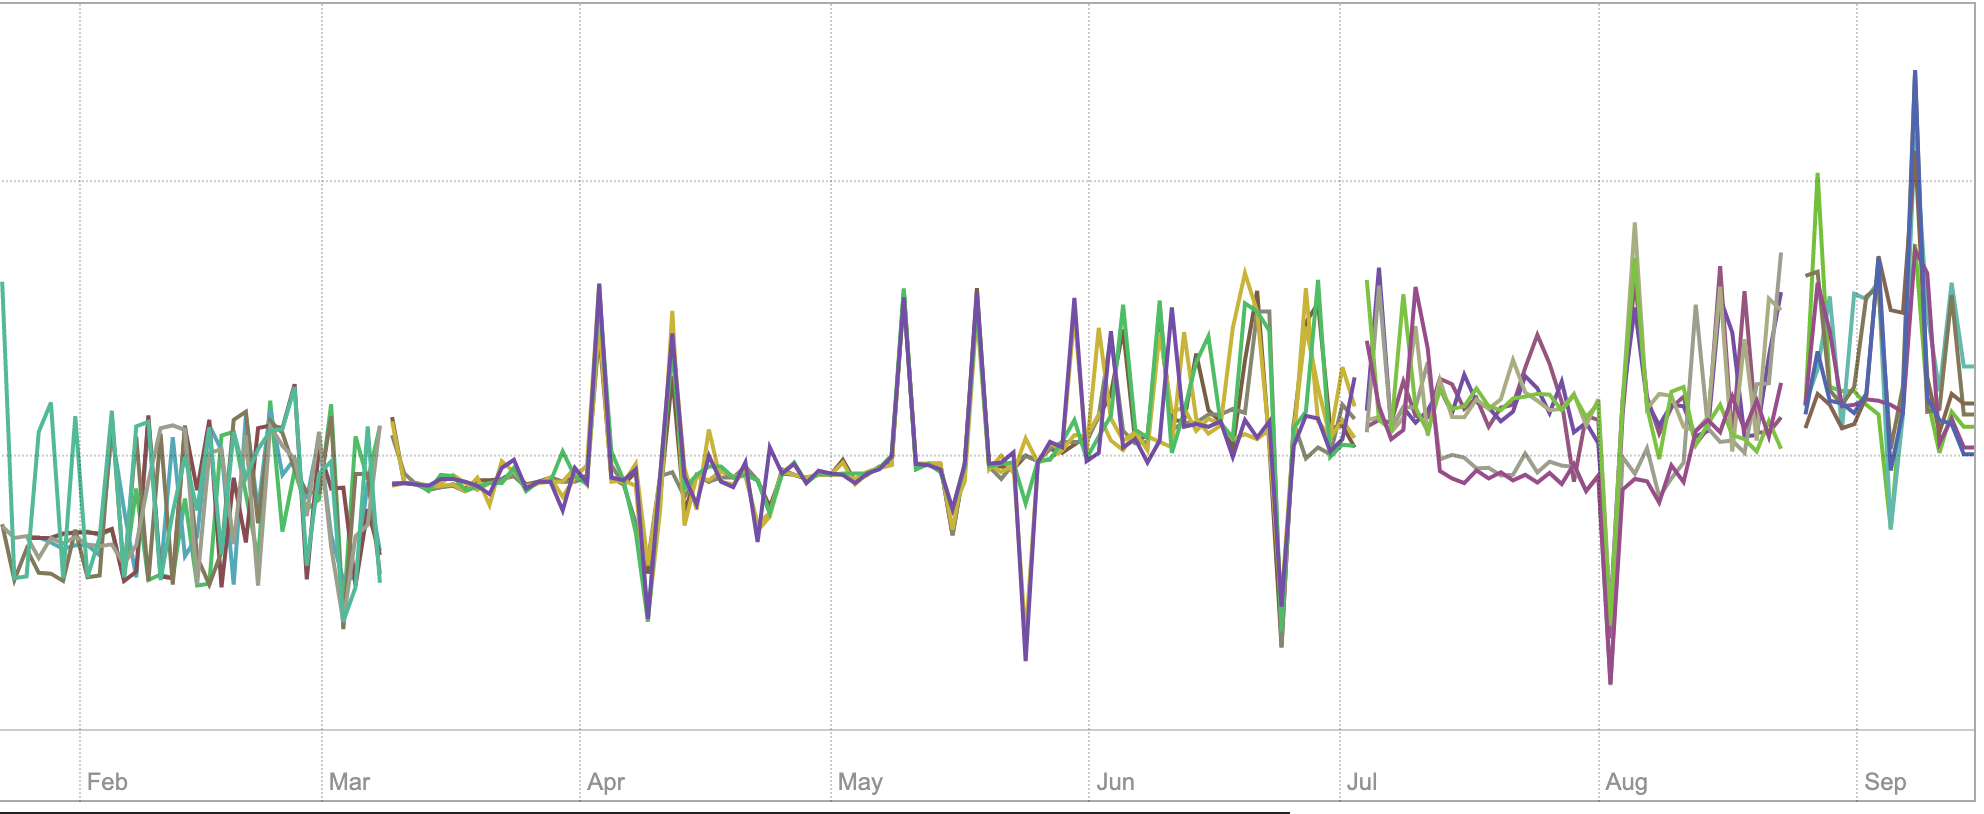
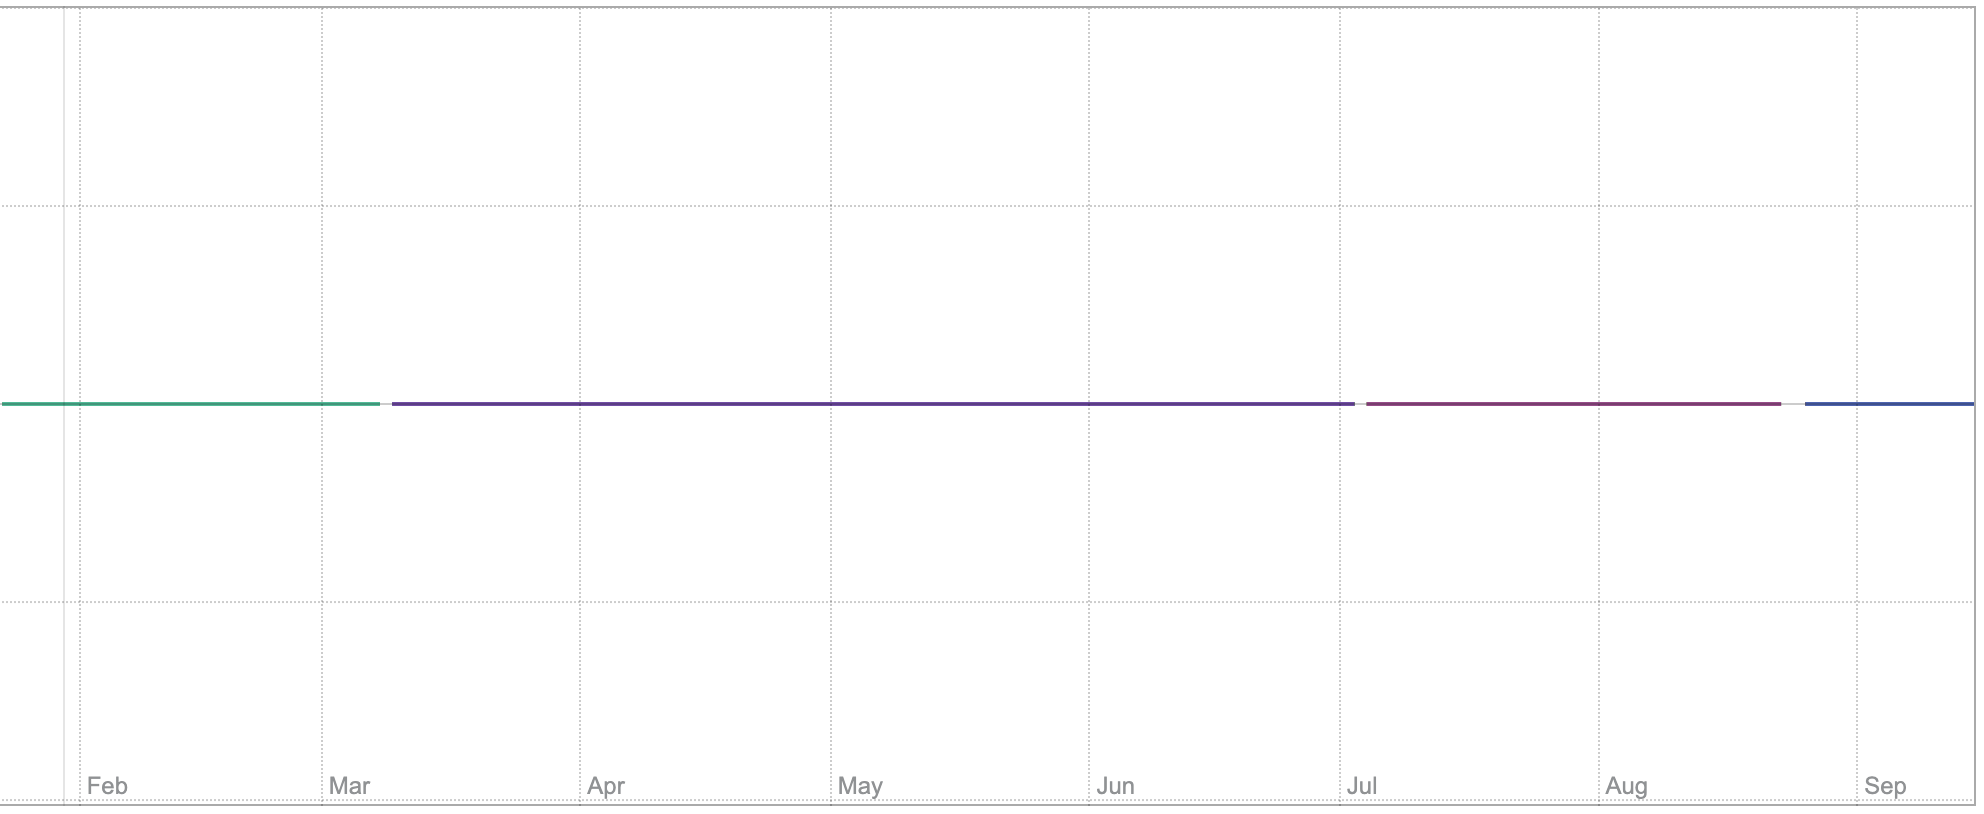
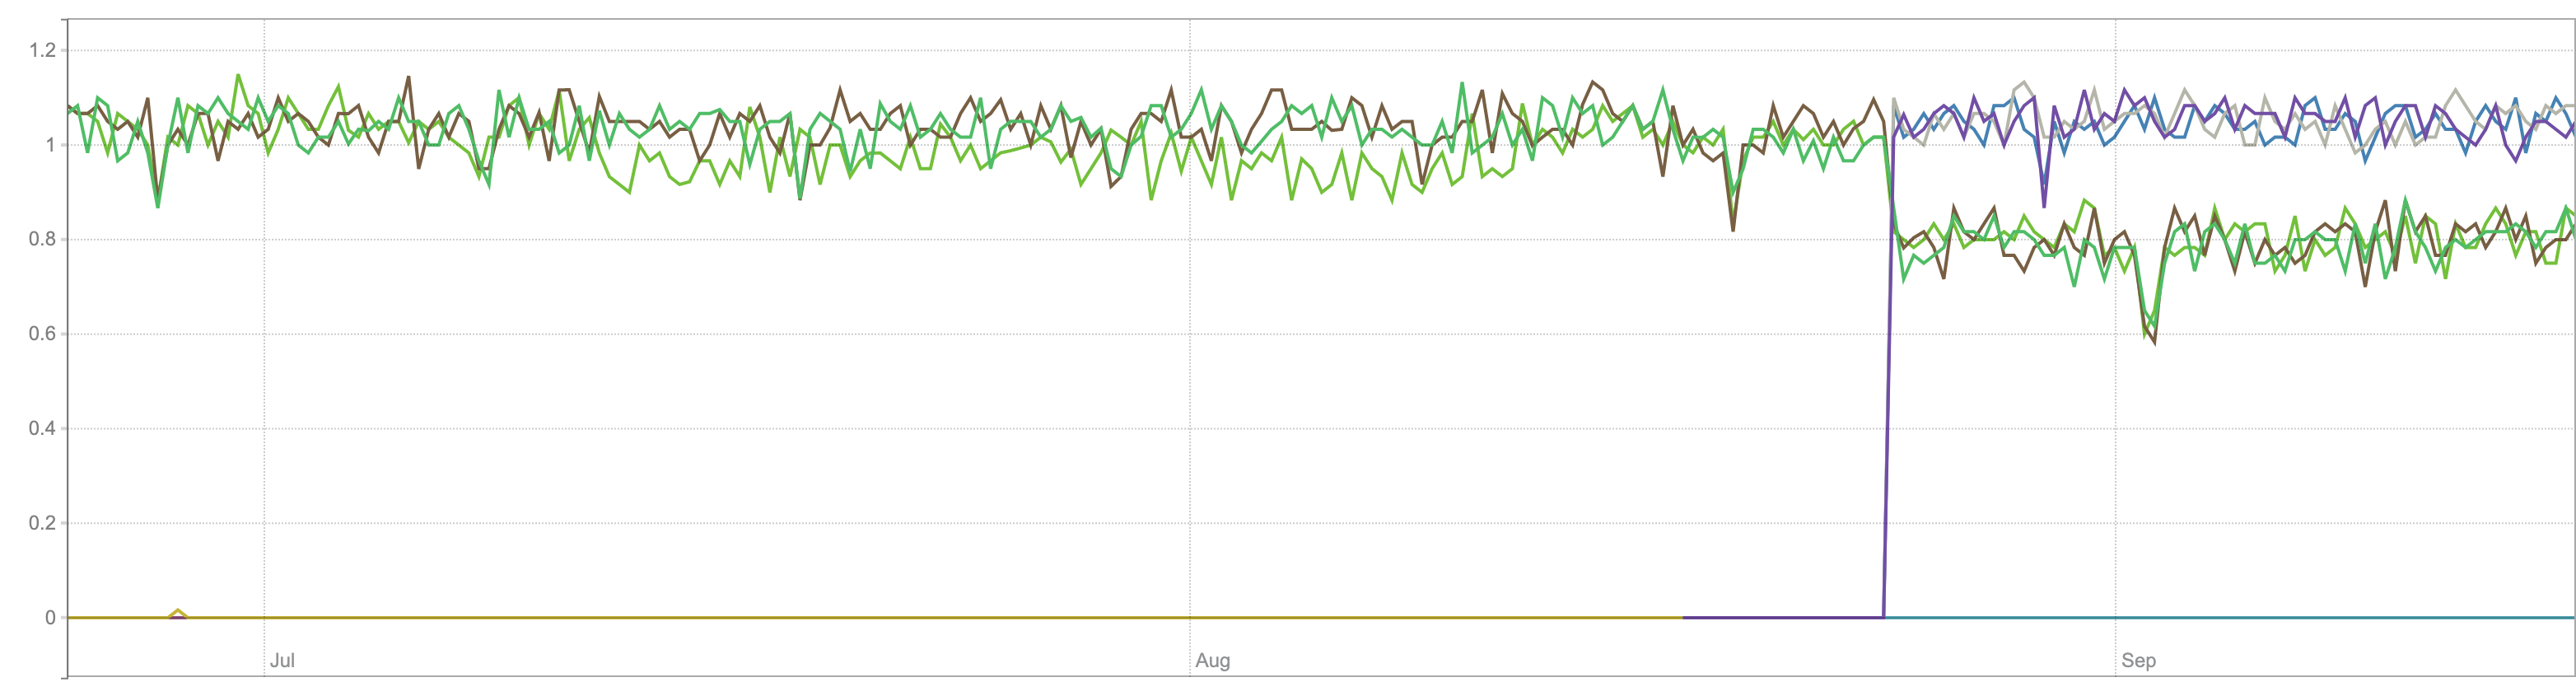
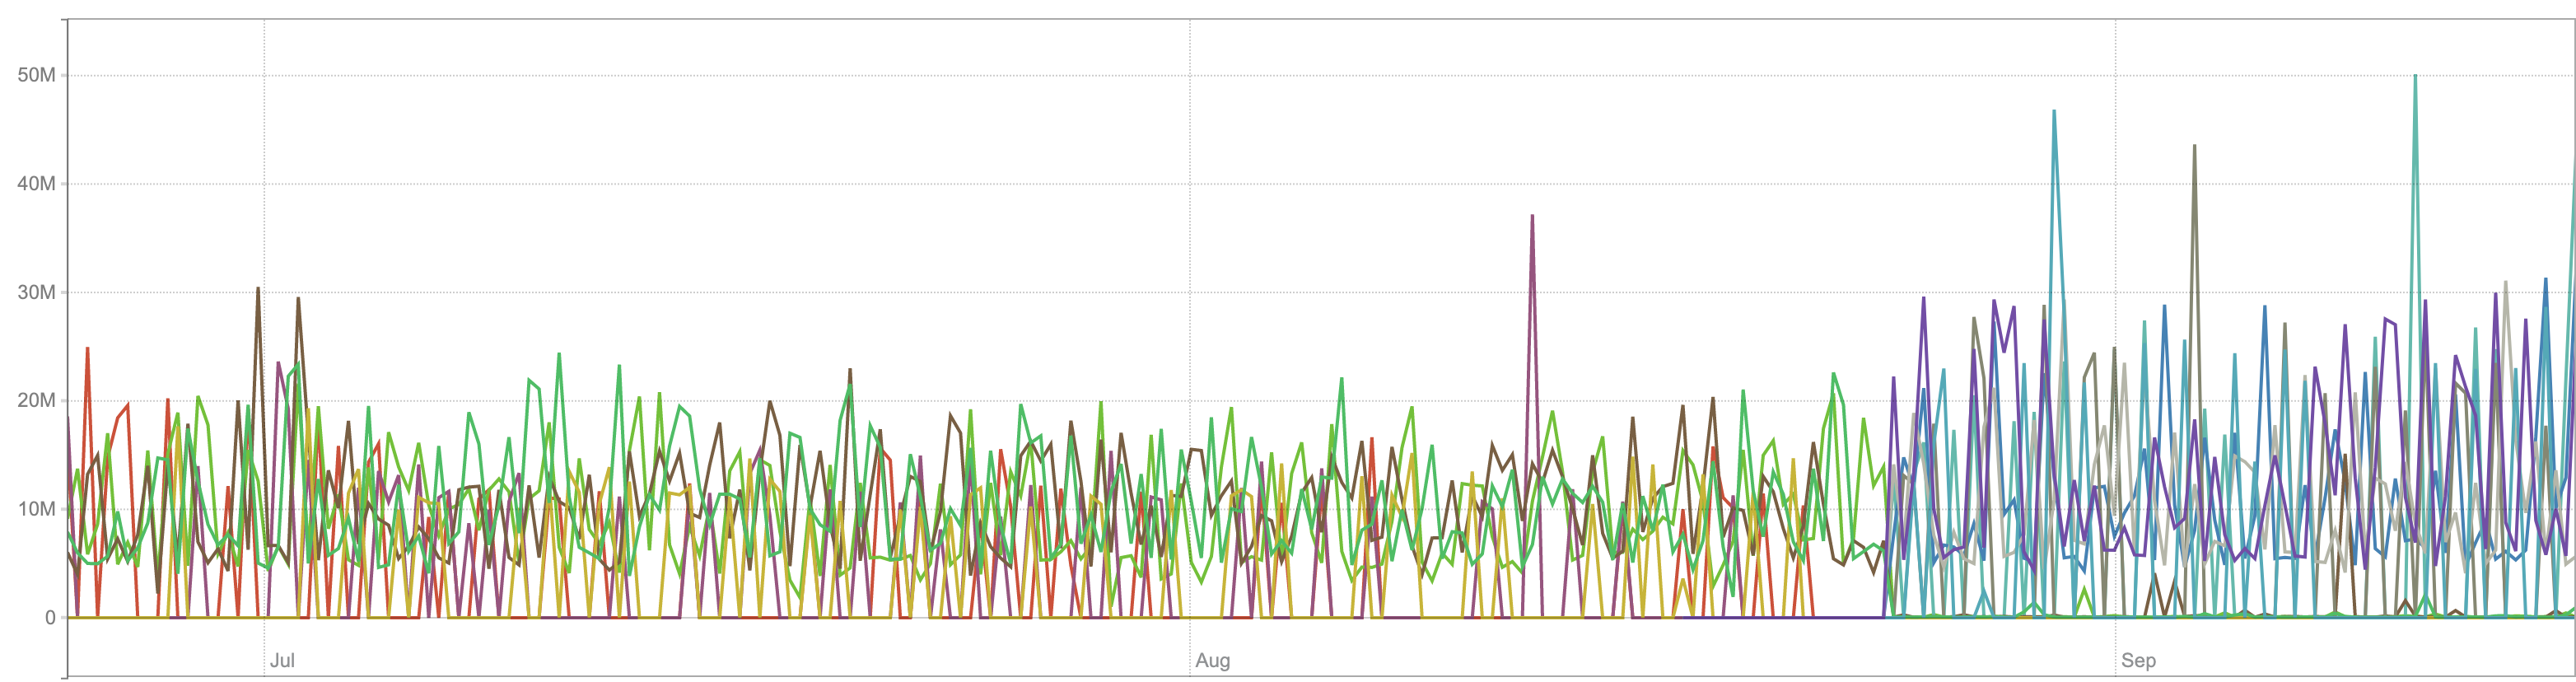
sum(sum_over_time(scrape_series_added[5m])):
sum(sum_over_time(scrape_samples_scraped[5m])):
Seitanas
on 21 Sep 2020
It looks like time series churn rate (the first graph) and the number of unique time series (the second graph) has been increased in the middle of August. But there is nothing special at the beginning of July when new Prometheus version has been installed according to the initial bug report. Probably, newer versions of Prometheus introduced instability for the real interval between scrapes? This may result in not so good compression ratio for timestamps data.
valyala
on 21 Sep 2020
We might have tracked it down to
https://github.com/golang/go/issues/38860 , effectively causing scrapes not to be aligned in some cases.
 roidelapluie
on 25 Sep 2020
roidelapluie
on 25 Sep 2020
A workaround will be provided in Prometheus 2.22.
roidelapluie
on 8 Oct 2020
@roidelapluie , thanks for the update! Then closing the issue, since it should automatically disappear after upgrading to Prometheus 2.22 .
valyala
on 8 Oct 2020
FYI, Prometheus v2.22 has been released. It contains the bugfix for this issue, which could result in increased disk space usage in both Prometheus and VictoriaMetrics.
valyala
on 17 Oct 2020
Related issues
valyala
·
4Comments
 oOHenry
·
4Comments
oOHenry
·
4Comments
 isality
·
3Comments
isality
·
3Comments
 pmitra43
·
3Comments
pmitra43
·
3Comments
 v98765
·
3Comments
v98765
·
3Comments
Most helpful comment
A workaround will be provided in Prometheus 2.22.