Victoriametrics: vmselect is killed by oom-killer when quering export API
Describe the bug
vmselect is killed by oom-killer when quering export API.
To Reproduce
Setup cluster.
Start vmselect container with 8GB memory limit.
Perform data export
curl -H 'Accept-Encoding: gzip' http://<vmselect>:8481/select/1/prometheus/api/v1/export -d 'match[]={host="srv1"}' --output data.jsonl.gz
  % Total    % Received % Xferd  Average Speed   Time    Time     Time  Current
                                 Dload  Upload   Total   Spent    Left  Speed
100 1092M    0 1092M    0    24  10.3M      0 --:--:--  0:01:45 --:--:-- 15.0M
curl: (18) transfer closed with outstanding read data remaining
Kernel messages:
conmon: conmon c023a2e02cd2f4109ddb <ninfo>: OOM received
kernel: [28891450.687558] vmselect-prod invoked oom-killer: gfp_mask=0x6000c0(GFP_KERNEL), nodemask=(null), order=0, oom_score_adj=0
kernel: [28891450.687562] vmselect-prod cpuset=libpod-c023a2e02cd2f4109ddbfe88a708f29ffa1f571af3e095a979010a6752953b71 mems_allowed=0
kernel: [28891450.687570] CPU: 40 PID: 2375 Comm: vmselect-prod Tainted: G           O      4.19.65-1.el7.x86_64 #1
kernel: [28891450.687571] Hardware name:
kernel: [28891450.687572] Call Trace:
kernel: [28891450.687583]  dump_stack+0x63/0x88
kernel: [28891450.687589]  dump_header+0x78/0x2a4
kernel: [28891450.687596]  ? mem_cgroup_scan_tasks+0x9c/0xf0
kernel: [28891450.687600]  oom_kill_process+0x26b/0x290
kernel: [28891450.687603]  out_of_memory+0x140/0x4a0
kernel: [28891450.687607]  mem_cgroup_out_of_memory+0xb9/0xd0
kernel: [28891450.687610]  try_charge+0x6d6/0x750
kernel: [28891450.687614]  ? __alloc_pages_nodemask+0x119/0x2a0
kernel: [28891450.687617]  mem_cgroup_try_charge+0xbe/0x1d0
kernel: [28891450.687619]  mem_cgroup_try_charge_delay+0x22/0x50
kernel: [28891450.687624]  do_anonymous_page+0x11a/0x650
kernel: [28891450.687627]  __handle_mm_fault+0xc24/0xe80
kernel: [28891450.687631]  handle_mm_fault+0x102/0x240
kernel: [28891450.687636]  __do_page_fault+0x212/0x4e0
kernel: [28891450.687640]  do_page_fault+0x37/0x140
kernel: [28891450.687645]  ? page_fault+0x8/0x30
kernel: [28891450.687648]  page_fault+0x1e/0x30
kernel: [28891450.687651] RIP: 0033:0x469e28
kernel: [28891450.687655] Code: 4c 01 de 48 29 c3 c5 fe 6f 06 c5 fe 6f 4e 20 c5 fe 6f 56 40 c5 fe 6f 5e 60 48 01 c6 c5 fd 7f 07 c5 fd 7f 4f 20 c5 fd 7f 57 40 <c5> fd 7f 5f 60 48 01 c7 48 29 c3 77 cf 48 01 c3 48 01 fb c4 c1 7e
kernel: [28891450.687656] RSP: 002b:000000c000c58c98 EFLAGS: 00010202
kernel: [28891450.687659] RAX: 0000000000000080 RBX: 0000000000093650 RCX: 000000c1e6d7c670
kernel: [28891450.687660] RDX: 000000000002d990 RSI: 000000c1e6ce9020 RDI: 000000c1eb062fa0
kernel: [28891450.687662] RBP: 000000c000c58cf8 R08: 0000000000000001 R09: 0000000000128000
kernel: [28891450.687663] R10: 000000c1eb00c000 R11: 0000000000000020 R12: 0000000000000002
kernel: [28891450.687665] R13: 0000000000df5660 R14: 0000000000000000 R15: 0000000000468840
kernel: [28891450.687667] Task in /cl/vmselect/pids-batch/libpod-c023a2e02cd2f4109ddbfe88a708f29ffa1f571af3e095a979010a6752953b71 killed as a result of limit of /cl/vmselect
kernel: [28891450.687678] memory: usage 8388608kB, limit 8388608kB, failcnt 712433
kernel: [28891450.687680] memory+swap: usage 8388612kB, limit 9007199254740988kB, failcnt 0
kernel: [28891450.687681] kmem: usage 63936kB, limit 8388608kB, failcnt 0
kernel: [28891450.687682] Memory cgroup stats for /cl/vmselect: cache:0KB rss:0KB rss_huge:0KB shmem:0KB mapped_file:0KB dirty:0KB writeback:0KB swap:0KB inactive_anon:0KB active_anon:0KB inactive_file:0KB active_file:0KB unevictable:0KB
kernel: [28891450.687699] Memory cgroup stats for /cl/vmselect/pids-batch: cache:0KB rss:0KB rss_huge:0KB shmem:0KB mapped_file:0KB dirty:0KB writeback:0KB swap:0KB inactive_anon:0KB active_anon:0KB inactive_file:0KB active_file:0KB unevictable:0KB
kernel: [28891450.687714] Memory cgroup stats for /cl/vmselect/pids-batch/libpod-c023a2e02cd2f4109ddbfe88a708f29ffa1f571af3e095a979010a6752953b71: cache:2460KB rss:8321004KB rss_huge:0KB shmem:0KB mapped_file:3300KB dirty:0KB writeback:0KB swap:0KB inactive_anon:20KB active_anon:8324280KB inactive_file:4KB active_file:0KB unevictable:0KB
kernel: [28891450.687731] Memory cgroup stats for /cl/vmselect/pids-idle: cache:0KB rss:0KB rss_huge:0KB shmem:0KB mapped_file:0KB dirty:0KB writeback:0KB swap:0KB inactive_anon:0KB active_anon:0KB inactive_file:0KB active_file:0KB unevictable:0KB
kernel: [28891450.687747] Tasks state (memory values in pages):
kernel: [28891450.687748] [  pid  ]   uid  tgid total_vm      rss pgtables_bytes swapents oom_score_adj name
kernel: [28891450.687910] [   8923]     0  8923    10744     1210   131072        0             0 xxxxxxx
kernel: [28891450.687914] [   8952]     0  8952     7725      723   102400        0             0 xxxxxxx
kernel: [28891450.687917] [   9018]     0  9018    63581      787   151552        0             0 xxxxxxx
kernel: [28891450.687962] [ 167136]   999 167136  4331147  2079099 18558976        0             0 vmselect-prod
kernel: [28891450.687974] [ 176997]     0 176997     3987     1063    81920        0             0 xxxxxxx
kernel: [28891450.688025] Memory cgroup out of memory: Kill process 167136 (vmselect-prod) score 993 or sacrifice child
kernel: [28891450.701657] Killed process 167136 (vmselect-prod) total-vm:17324588kB, anon-rss:8311840kB, file-rss:6052kB, shmem-rss:0kB
kernel: [28891451.138861] oom_reaper: reaped process 167136 (vmselect-prod), now anon-rss:0kB, file-rss:0kB, shmem-rss:0kB
Version
vmselect-20200727-210903-tags-v1.39.1-cluster-0-g96bc476e5
Used command-line flags
flag{name="cacheDataPath", value="/var/lib/victoriametrics/cache"} 1
flag{name="dedup.minScrapeInterval", value="1ms"} 1
flag{name="enableTCP6", value="false"} 1
flag{name="envflag.enable", value="true"} 1
flag{name="envflag.prefix", value=""} 1
flag{name="fs.disableMmap", value="false"} 1
flag{name="http.disableResponseCompression", value="false"} 1
flag{name="http.maxGracefulShutdownDuration", value="7s"} 1
flag{name="http.pathPrefix", value=""} 1
flag{name="http.shutdownDelay", value="0s"} 1
flag{name="httpListenAddr", value=":8481"} 1
flag{name="loggerErrorsPerSecondLimit", value="10"} 1
flag{name="loggerFormat", value="default"} 1
flag{name="loggerLevel", value="INFO"} 1
flag{name="loggerOutput", value="stderr"} 1
flag{name="memory.allowedPercent", value="60"} 1
flag{name="search.cacheTimestampOffset", value="5m0s"} 1
flag{name="search.denyPartialResponse", value="false"} 1
flag{name="search.disableCache", value="false"} 1
flag{name="search.latencyOffset", value="30s"} 1
flag{name="search.logSlowQueryDuration", value="5s"} 1
flag{name="search.maxConcurrentRequests", value="16"} 1
flag{name="search.maxExportDuration", value="720h0m0s"} 1
flag{name="search.maxLookback", value="0s"} 1
flag{name="search.maxPointsPerTimeseries", value="30000"} 1
flag{name="search.maxQueryDuration", value="30s"} 1
flag{name="search.maxQueryLen", value="16384"} 1
flag{name="search.maxQueueDuration", value="10s"} 1
flag{name="search.maxStalenessInterval", value="0s"} 1
flag{name="search.minStalenessInterval", value="0s"} 1
flag{name="search.resetCacheAuthKey", value="secret"} 1
flag{name="selectNode", value=""} 1
flag{name="storageNode", value="1-vmstorage:8401,2-vmstorage:8401,3-vmstorage:8401"} 1
flag{name="version", value="false"} 1
 YuriGrigorov
All 20 comments
vmselect may eat all the memory if the /api/v1/export request returns too many time series. vmselect keeps metainfo for each exported time series in memory, so this metainfo can occupy all the available memory. The number of the exported time series for match[]={host="srv1"} may be estimated by count({host="srv1"}) query sent to /api/v1/query or /api/v1/query_range.
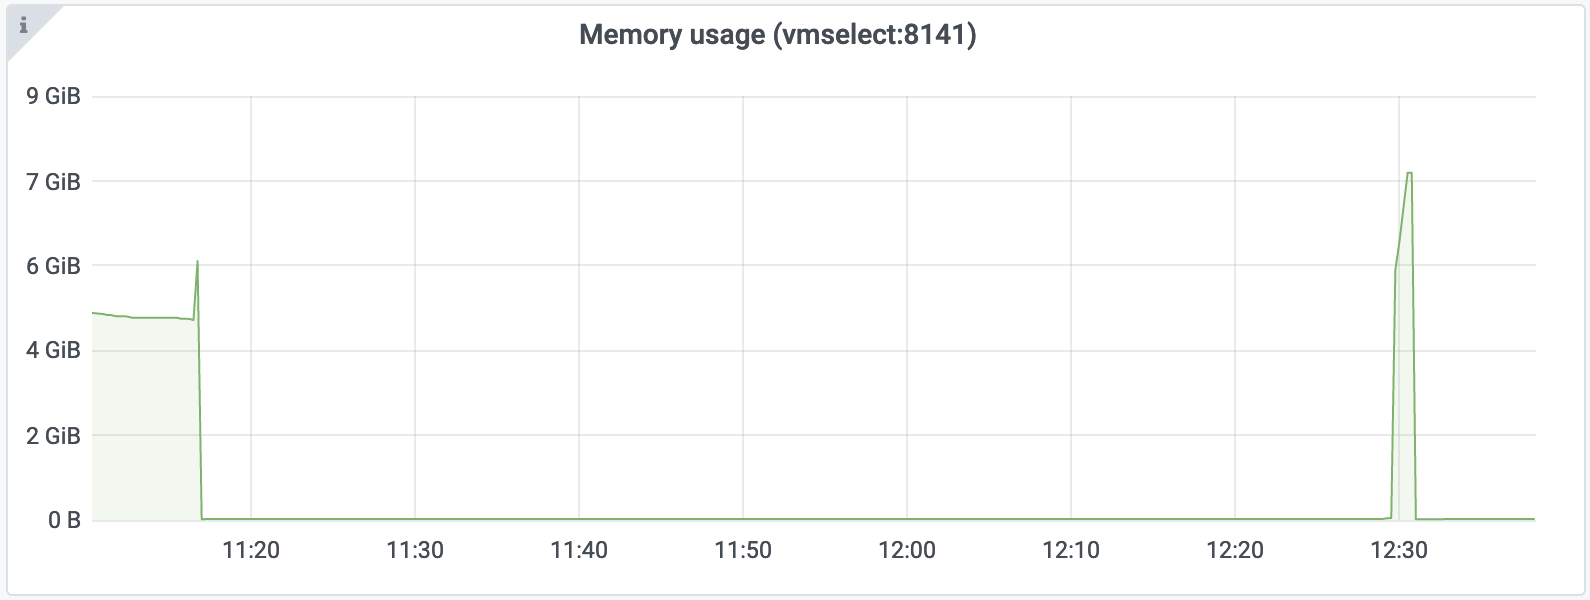
@YuriGrigorov , could you provide memory usage graph for vmselect during the export? See these docs on how to set up monitoring for cluster components of VictoriaMetrics. It would be great also if you could provide memory profile for vmselect just before the OOM. See the docs on how to collect memory profile. These docs apply to all the components of VictoriaMetrics, including vmselect - the only difference is that each component listens for distinct port. For instance, vmslect listens for 8481 port, so the profile must be collected from http://vmselect:8481/debug/pprof/heap url.
The temporary workaround for this issue is to increase memory limits for vmselect node, so all the metainfo for the selected time series fit the memory. Another workaround is to add more filters to match[] query in order to select lower number of time series per each export API call.
 valyala
on 9 Aug 2020
valyala
on 9 Aug 2020
Two attempts to export data. Both ended with OOM.
count({host="srv1"}) query to /api/v1/query returned empty result
curl -s 'http://vmselect:8481/select/1/prometheus/api/v1/query' -d 'query=count({host="srv1"})'
{"status":"success","data":{"resultType":"vector","result":[]}}
@YuriGrigorov , thanks for the provided memory profiles! Could you share more details on the data stored in VictoriaMetrics?
It looks like VictoriaMetrics contains too big number of data points per each time series, so these data points don't fit available RAM during data export. VictoriaMetrics reads all the data points per each time series in memory and then constructs JSON line from all these data points. Every such data point requires around 50 bytes of memory during export. So if a single time series contains a million of data points, then it will require 50MB of RAM during data export. VictoriaMetrics constructs up to NumCPU JSON lines in parallel for distinct time series during data export, where NumCPU is the number of vCPUs available at vmselect. For example, if vmselect runs on a node with 16vCPUs and it exports time series with a million data points per each time series, then it may require 16vCPUs*50MB=800MB of RAM during data export.
There are the following workarounds for limiting memory usage when exporting time series with huge number of samples per each time series:
- To limit the amounts of exported data via
startandendquery args passed to/api/v1/export- this will limit the number of data points per time series. See https://victoriametrics.github.io/#how-to-export-time-series for details. - To reduce the number of available vCPUs for
vmselectduring data export. - To pass
max_rows_per_linequery arg for limiting the number of samples per exported JSON line. Note that this solution would work only after the commit 62b6e5462298e208db3f196bb43ae79972e23e09 . You may try buildingvmselectfrom this commit according to these docs and verifying whether this solution works for your case.
valyala
on 10 Aug 2020
There are 382 series matching {host="srv1"}. Each series have about 830000 data points.
I wrote a script that iterates by series and exports all timestamps per each time series. It works fine but very slow.
I also tried to reduce number of available vCPUs, but this didn't helped. How vmselect determines available vCPUs?
/metrics says:
curl -s localhost:8481/metrics | grep cpu_count
go_cpu_count 24
But in real only 2000 CPU shares are available
cat /sys/fs/cgroup/cpu/cpu.shares
2000
Maybe it's possible to add some max_threads or abs_cpu options to limit memory consumption?
YuriGrigorov
on 11 Aug 2020
The number of available CPU cores may be limited by setting GOMAXPROCS=N environment variable during vmselect start, where N is the desired number of CPU cores that vmselect may use.
valyala
on 11 Aug 2020
Playing with GOMAXPROCS helped. Thanks!
Does it mean that VictoriaMetrics doesn't respect CGroup CPU quota?
If it is maybe it's useful to add quota support? (https://github.com/uber-go/automaxprocs)
YuriGrigorov
on 11 Aug 2020
VictoriaMetrics relies on Go runtime for determining available CPU cores. It looks like the Go runtime isn't aware of cgroup CPU quota. Thanks for pointing to the interesting project! Hopefully this project may be integrated into VictoriaMetrics in order to respect cgroup CPU quotas.
valyala
on 11 Aug 2020
I thought that quota may be set on level higher in cgroup hierarchy and then it will not be available from container, so automation is not best solution. Maybe for some cases, but not common.
GOMAXPROCS is good enough.
YuriGrigorov
on 11 Aug 2020
@YuriGrigorov , could you try building vmselect from the commit 6721e47ae9ffab73f159680f6527d5d9fa770ad9 according to build instructions and verifying whether cgroup CPU quota is respected by this vmselect?
valyala
on 11 Aug 2020
vmselect-prod -version
vmselect-20200812-092759-heads-cluster-0-g6721e47a
CPU quota is not respected (as memory limit too) due to the specifics of our cloud.
As i said in my case quota is set in last but one level of cgroup hierarchy, so it is not visible from inside of container. Value of /sys/fs/cgroup/cpu/cpu.cfs_quota_us is -1 and cpu.cfs_period_us is 100000.
So the only way to reduce CPU trashing in my case is set GOMAXPROCS env var equal to containers CPU quota.
But using cpu.cfs_quota_us and cpu.cfs_period_us must work fine in clean Docker and Kubernetes.
YuriGrigorov
on 11 Aug 2020
As i said in my case quota is set in last but one level of cgroup hierarchy, so it is not visible from inside of container. Value of /sys/fs/cgroup/cpu/cpu.cfs_quota_us is -1 and cpu.cfs_period_us is 100000.
It would be great if somebody would suggest reliable method for determining CPU quota in this case.
valyala
on 15 Aug 2020
FYI, VictoriaMetrics should properly detect CPU limits set via cgroups starting from v1.40.0. This version also contains an optimization that reduces memory usage when exporting time series with big number of samples if max_rows_per_line command-line flag is passed to /api/v1/export.
valyala
on 15 Aug 2020
As i said in my case quota is set in last but one level of cgroup hierarchy, so it is not visible from inside of container. Value of /sys/fs/cgroup/cpu/cpu.cfs_quota_us is -1 and cpu.cfs_period_us is 100000.
It would be great if somebody would suggest reliable method for determining CPU quota in this case.
You may try get available CPUs by reading /sys/devices/system/cpu/online.
online -- CPUs that are online and being scheduled
https://www.kernel.org/doc/html/latest/admin-guide/cputopology.html
The number is rounded to whole.
I checked some our production containers
Actual cores | Value from /sys/devices/system/cpu/online
------------ | -----------------------------------------
1.567432 | 0
2.1052632 | 0-1
4.649123 | 0-3
7.157895 | 0-6
YuriGrigorov
on 15 Aug 2020
@YuriGrigorov , could you verify whether cluster components of VictoriaMetrics properly determine the number of available CPU cores starting from the commit 89d652b583cb04e9cf8a8c6090ed7f20d68daa3e ?
valyala
on 23 Sep 2020
FYI, the commit https://github.com/VictoriaMetrics/VictoriaMetrics/commit/89d652b583cb04e9cf8a8c6090ed7f20d68daa3e has been included in v1.41.1.
valyala
on 23 Sep 2020
@YuriGrigorov , could you verify whether cluster components of VictoriaMetrics properly determine the number of available CPU cores starting from the commit 89d652b ?
With CPU quota limit
# cat /sys/devices/system/cpu/online
0-2

VictoriaMetrics/lib/cgroup/cpu.go:37    updating GOMAXPROCS to 4 according to cgroup CPU quota
Without CPU quota limit
# cat /sys/devices/system/cpu/online
0-79

VictoriaMetrics/lib/cgroup/cpu.go:31    cgroup CPU quota=81 exceeds NumCPU=80; using GOMAXPROCS=NumCPU
Looks little bit misleading.
YuriGrigorov
on 24 Sep 2020
@YuriGrigorov , thanks for the pointer! It should be addressed in the commit 5e998e597a78817ad2fe9a274f975b5d34db8fdf .
valyala
on 29 Sep 2020
FYI, the next release of VictoriaMetrics will support exporting and importing data in native format. This is the most efficient approach for data migration - it requires lower amounts of RAM, CPU and disk space than other approaches for data migration. See https://github.com/VictoriaMetrics/VictoriaMetrics/issues/787#issuecomment-700632551 for details.
valyala
on 29 Sep 2020
FYI, release v1.42.0 contains all the enhancements mentioned above.
valyala
on 30 Sep 2020
It looks like all the issues mentioned in this thread are fixed. Closing it.
@YuriGrigorov , feel free re-opening it or creating new issues if you find something is still broken.
valyala
on 30 Sep 2020
Related issues
 Serrvosky
·
3Comments
Serrvosky
·
3Comments
 EricAntoni
·
3Comments
EricAntoni
·
3Comments
 abualy
·
3Comments
valyala
·
4Comments
abualy
·
3Comments
valyala
·
4Comments
 n4mine
·
3Comments
n4mine
·
3Comments