Victoriametrics: [vmagent] update 1.39.0 causes duplicate data
Describe the bug
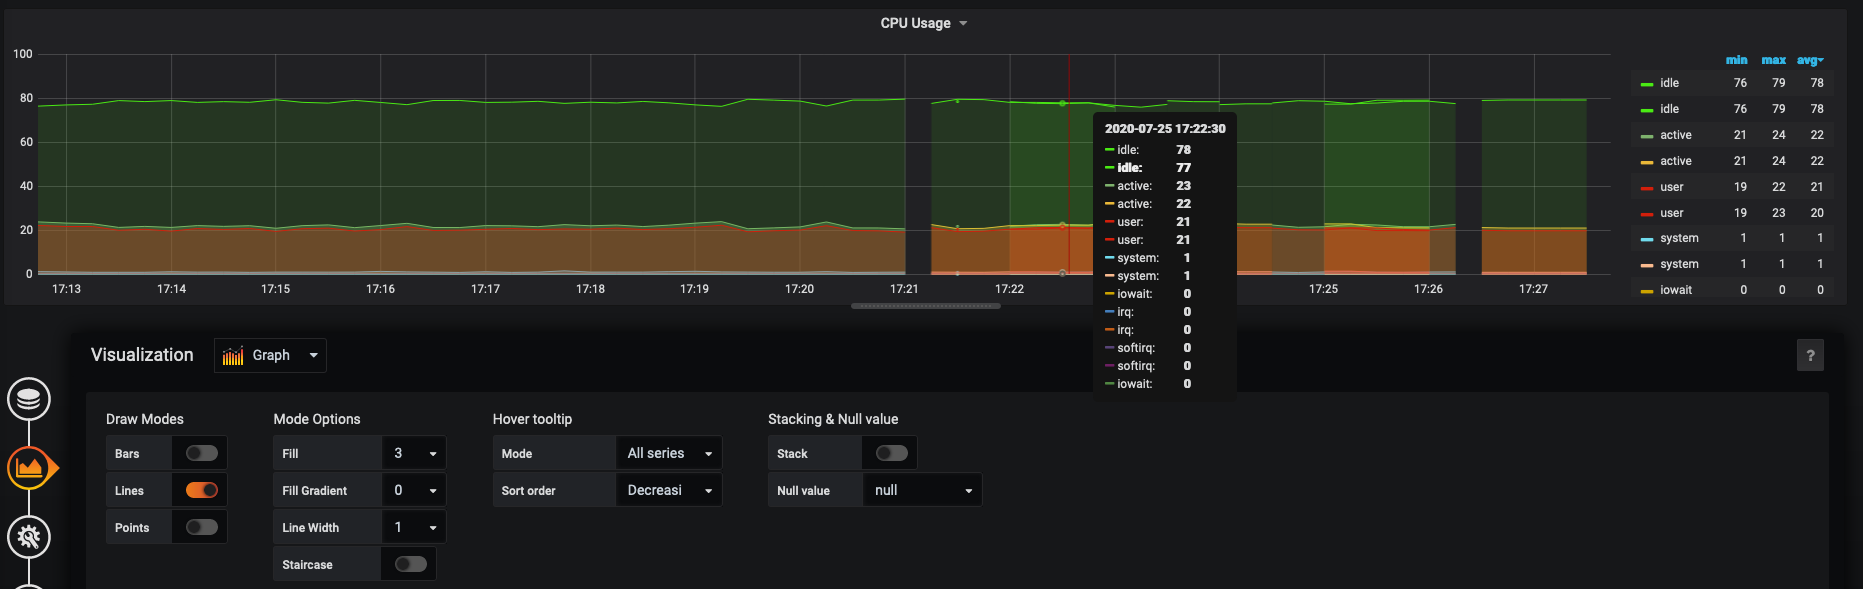
After updating the agent and the database to the new version, I saw duplicate data in grafana. Duplication occurs only with data from the influx protocol. I tried roll back the database to version 1.38.1, but it did fix the problem. I rolled back the agent to 1.38.1 and the duplicates stopped repeating.
Also, before updating, I tried new version in the test environment and did not notice any problems there.
We use the local telegraf as a message hub for other telegraf agents.
To Reproduce
To reproduce the bug, you need use: influx protocol, telegraf (1.15.1-1 or 1.14.4-1), vmagent version 1.39.0, Victoria-metrics database (1.39.0 or 1.38.1), OS Oracle Linux 7.8, kernel 5.4.17-2011.3.2.1.el7uek.x86_64 and probable high insertion rate.
Screenshots


Version
vmagent-prod --version
vmagent-20200725-094220-heads-master-0-ga0906270

[root@s4877]# victoria-metrics-prod --version
victoria-metrics-20200714-161623-tags-v1.38.1-0-gb442a42d

[root@s4876]# victoria-metrics-prod --version
victoria-metrics-20200725-094117-heads-master-0-ga0906270

[root@s4876]# telegraf --version
Telegraf 1.15.1 (git: HEAD 002696d8)
Used command-line flags
[root@s4876]# cat /etc/default/vmagent
VMA_OPTS='-httpListenAddr=:8428 -remoteWrite.queues 4 -remoteWrite.tmpDataPath /data/vm/agent -maxConcurrentInserts 512 -memory.allowedPercent 20 -remoteWrite.maxDiskUsagePerURL 0 -loggerLevel ERROR -promscrape.config /data/vm/etc/vma.yml -remoteWrite.url http://127.0.0.1:8429/api/v1/write -remoteWrite.url http://s4877:8429/api/v1/write'

cat /etc/default/victoriametrics
VM_OPTS='-storageDataPath /data/vm/dt -maxConcurrentInserts 1024 -memory.allowedPercent 80 -retentionPeriod 5 -search.maxQueryDuration 120s -httpListenAddr=:8429 -loggerLevel ERROR'

telegraph.conf:
[agent]
  interval = "10s"
  round_interval = true
  metric_batch_size = 1000
  metric_buffer_limit = 100000000
  collection_jitter = "0s"
  flush_interval = "1s"
  flush_jitter = "0s"
  debug = false
  quiet = true
  logfile = "/var/log/telegraf/telegraf.log"
  hostname = ""
  omit_hostname = false
[[outputs.influxdb]]
  urls = ["http://127.0.0.1:8428"]
  timeout = "30s"
[[inputs.cpu]]
  percpu = true
  totalcpu = true
  collect_cpu_time = false
  report_active = true
[[inputs.disk]]
  interval = "60s"
  ignore_fs = ["tmpfs", "devtmpfs", "devfs", "nfs", "nfsd", "sysfs", "proc", "autofs", "rootfs"]
[[inputs.diskio]]
  interval = "1s"
  skip_serial_number = true
[[inputs.kernel]]
[[inputs.mem]]
[[inputs.processes]]
[[inputs.swap]]
[[inputs.system]]
[[inputs.net]]
  interval = "1s"
[[inputs.internal]]
  collect_memstats = true
[[inputs.influxdb_listener]]
  service_address = ":8189"
  read_timeout = "30s"
  write_timeout = "30s"
 posix
posix
All 13 comments
I tried change config of vmagent, local telegraf, vm database, but did not get any good result.
After several attempts, I decided to exclude the local telegraf from the chain and started the second vmagent on port 8189, after which the data returned to normal and the duplicates stopped.
posix
on 26 Jul 2020
This may be related to the commit ad6290953cec458b891c9effddf2210b2ca90dd2 , which has been added in vmagent v1.39.0. This commit introduced a bug, which triggers after vmagent fails sending data to remote storage. The issue has been fixed in the commit cb8c6908dc88762af2252601c1b68fd1a15009e5 .
@posix, could you build vmagent from the commit cb8c6908dc88762af2252601c1b68fd1a15009e5 and verify whether this fixes the issue? See build instructions for vmagent.
 valyala
on 27 Jul 2020
valyala
on 27 Jul 2020
I tried to update and work on the old scheme.
The problem still exists.
Screenshot description:
Switched to the old scheme at 11:19:56
Jul 28 11:19:56 s4876 telegraf[38627]: 2020-07-28T08:19:56Z I! Starting Telegraf 1.15.1
I updated the agent to version 1.39.1 at 11:39:24
Jul 28 11:39:24 s4876 systemd[1]: Started VictoriaMetrics Agent.
It worked until 11:45:23.
Jul 28 11:45:23 s4876 telegraf[1079]: 2020-07-28T08:45:23Z I! Starting Telegraf 1.15.1
Jul 28 11:45:28 s4876 systemd[1]: Started VictoriaMetrics Agent. <--Second agent with same version
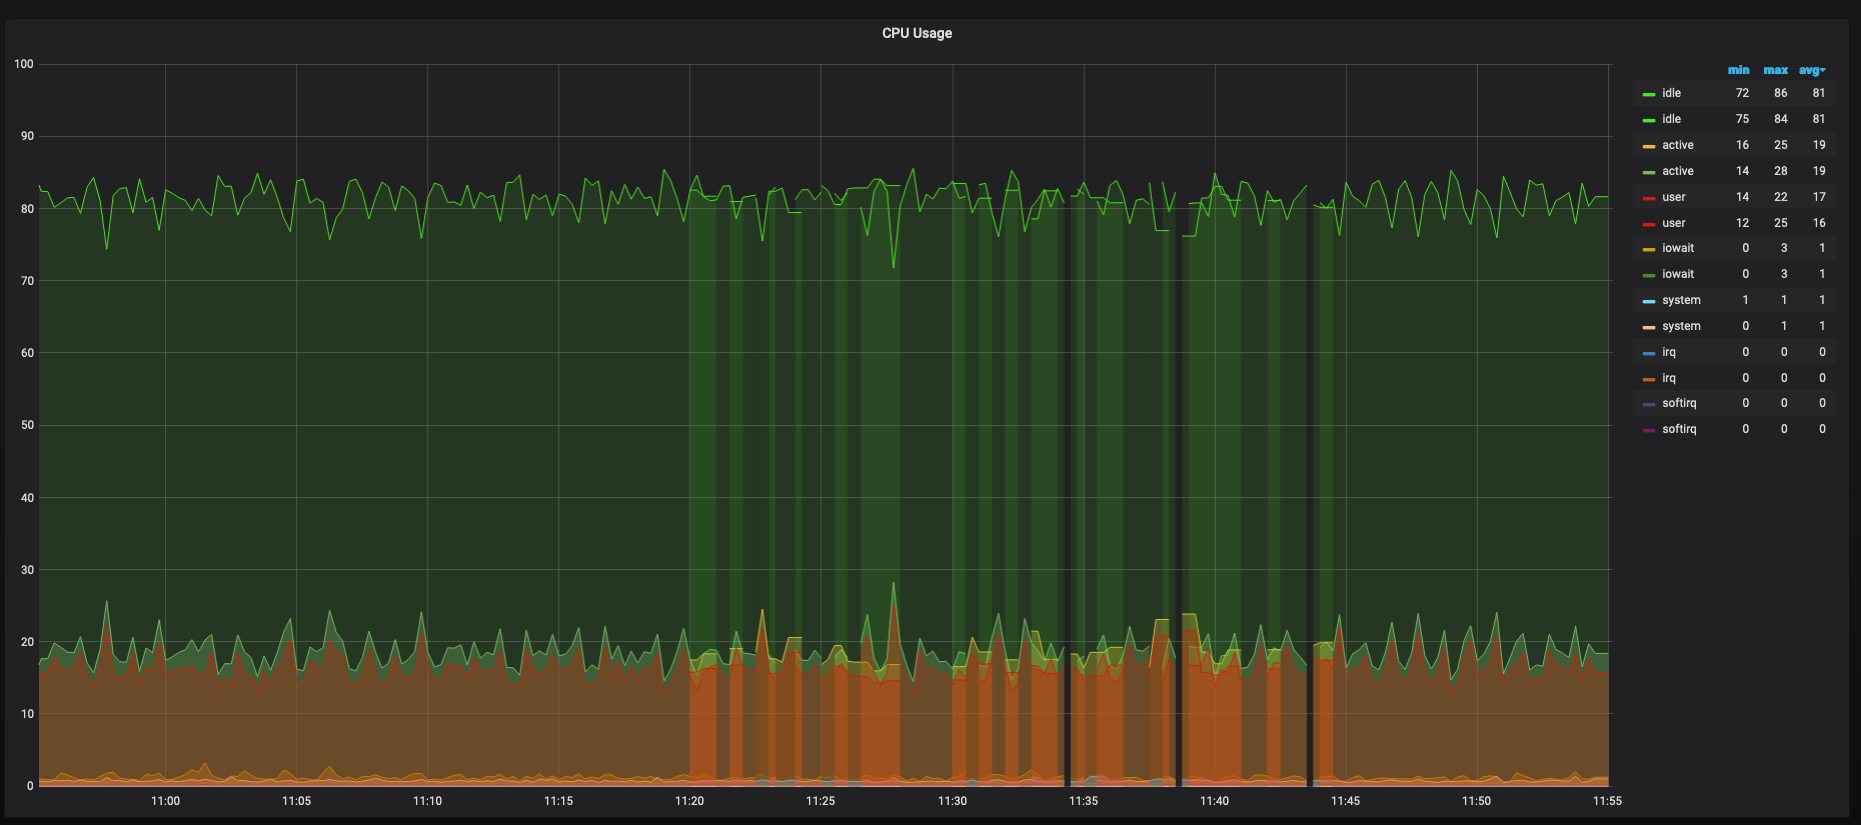
It looks like that version 1.39.1 works fine but only without the telegraf-hub.
posix
on 28 Jul 2020
Thanks for the update!
Could you look into logs for vmagent and VictoriaMetrics on the time range when the issue triggers?
It would be great also if you could share the query used for building the CPU Usage graph from the last screenshot.
valyala
on 28 Jul 2020
I made a new test with debug of telegraf and turned on logging of the vmagent and vmdb(commented ERROR).

Query:
sort_by_label(label_transform({__name__=~"cpu_usage_.*", host=~"$host", cpu="cpu-total"}, "__name__", "cpu_usage_", ""), "__name__")
@posix , could you remove {{__name__}} string from Legend field on the graph above and then check the difference in labels for metrics with duplicate names?
valyala
on 28 Jul 2020
It looks like labels drifts
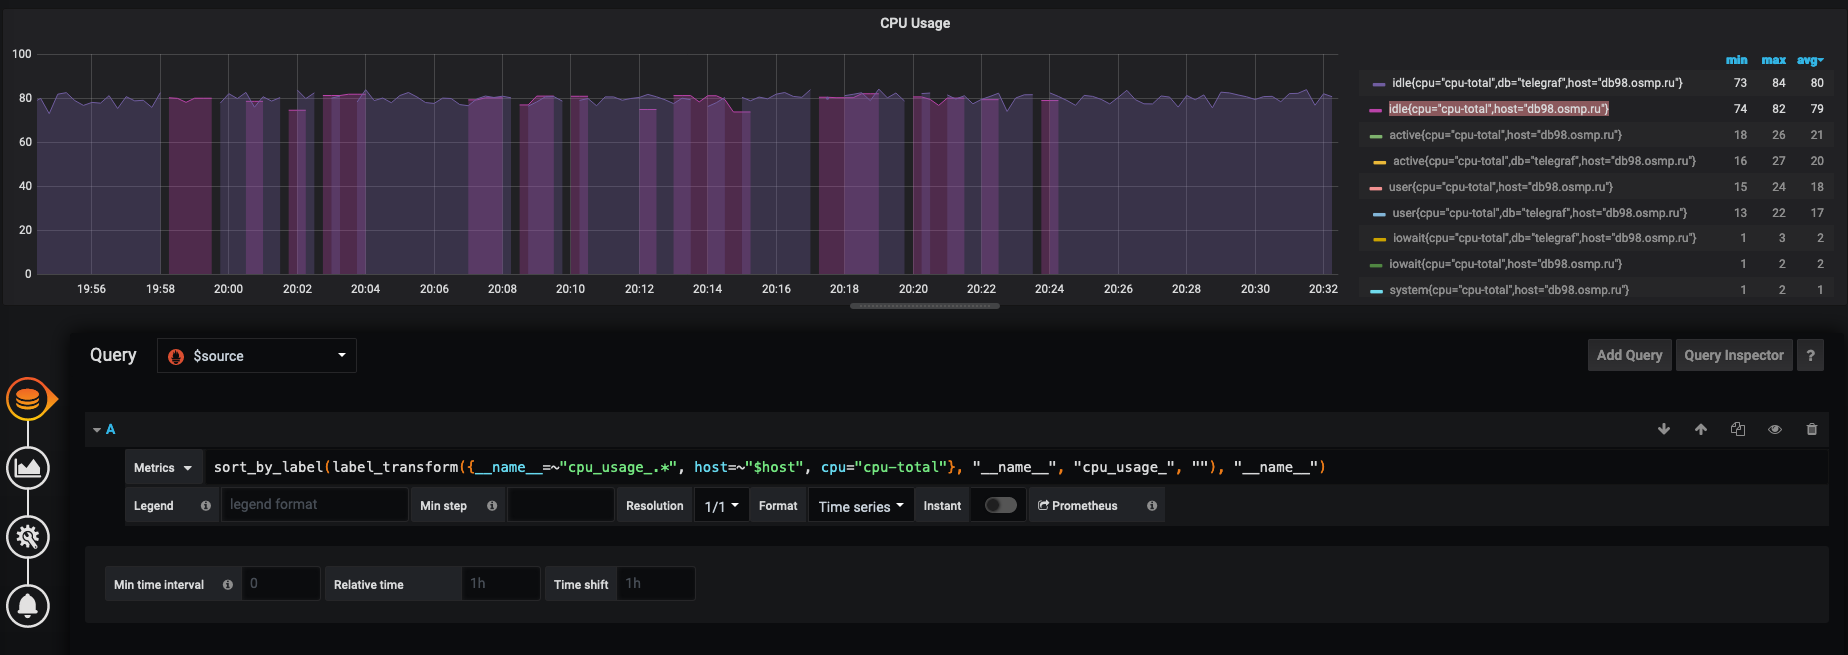
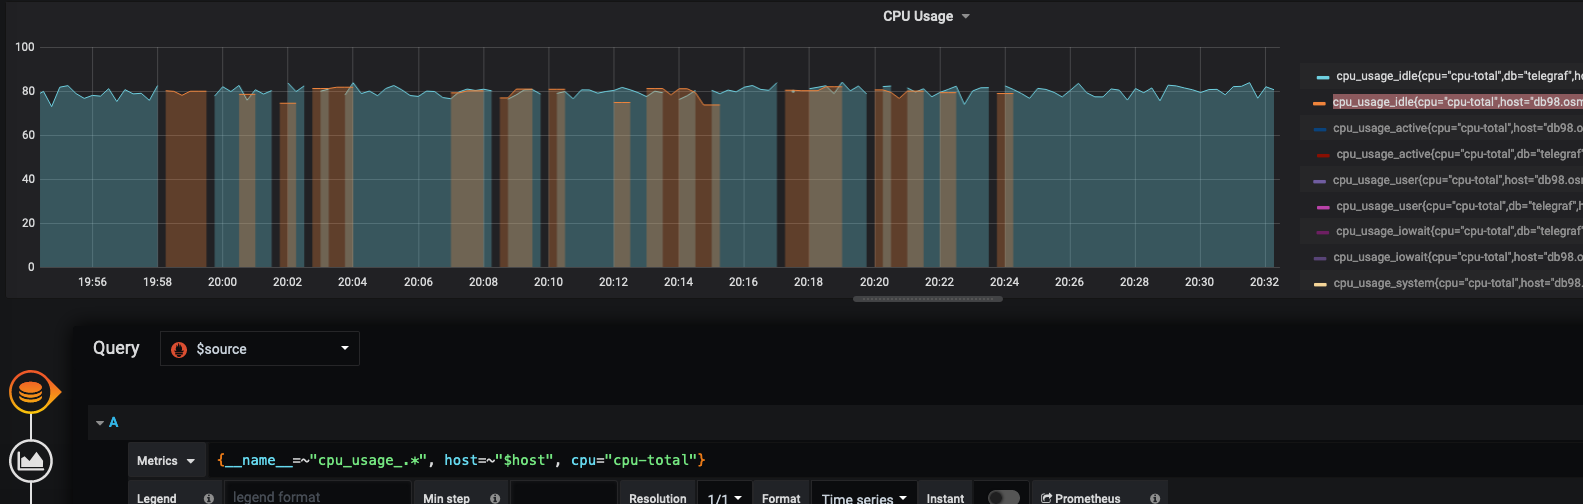
posix
on 28 Jul 2020
@posix , it looks like the root cause of the issue has been nailed down and fixed in the commit 0f63da369869177a4c5114d131f451494618cbce . Could you build vmagent from the commit 0f63da369869177a4c5114d131f451494618cbce and verify whether the issue is gone?
valyala
on 28 Jul 2020
It looks pretty good. I also checked other graphs and everything is fine there too.
Thank you very much!


posix
on 28 Jul 2020
@posix , thanks for the help in determining the root cause for the issue! The bugfix will be included in the next release.
valyala
on 28 Jul 2020
Nice! It was really fast! Thank you again!
posix
on 28 Jul 2020
FYI, vmagent versions v1.39.0 and v1.39.1 had a bug, which prevented from re-using http keep-alive connections between vmagent and remote storage systems. This could result in increased resource usage on both vmagent and remote storage. This has been fixed in v1.39.2.
valyala
on 30 Jul 2020
The bugfix that could lead to duplicate time series with and without db tag has been included in v1.39.2 too.
valyala
on 30 Jul 2020
Related issues
 EricAntoni
·
3Comments
EricAntoni
·
3Comments
 n4mine
·
3Comments
n4mine
·
3Comments
 v98765
·
3Comments
valyala
·
4Comments
v98765
·
3Comments
valyala
·
4Comments
 genericgithubuser
·
4Comments
genericgithubuser
·
4Comments
Most helpful comment
The bugfix that could lead to duplicate time series with and without
dbtag has been included in v1.39.2 too.