Victoriametrics: Unexpected query_range response in case of "sparse metrics"
query_range returns values when no metric data are presents.
VM Version: victoria-metrics-20200427-220723-tags-v1.35.0-0-g3bfa41a9
Consider the following simplified case where we have the metric MYMETRIC with 4 points at times:
- June 21, 2020 10:00:00 PM
- June 25, 2020 6:00:00 PM
- June 25, 2020 8:00:00 PM
- July 21, 2020 7:12:54 AM
    curl  'http://localhost:8428/api/v1/export' -d 'match=MYMETRIC'

    {"metric":{"__name__":"MYMETRIC","sn":"AC01"},
     "values":[123,123,300,123],"timestamps":[1592776800000,1593108000000,1593115200000,1595315574000]}
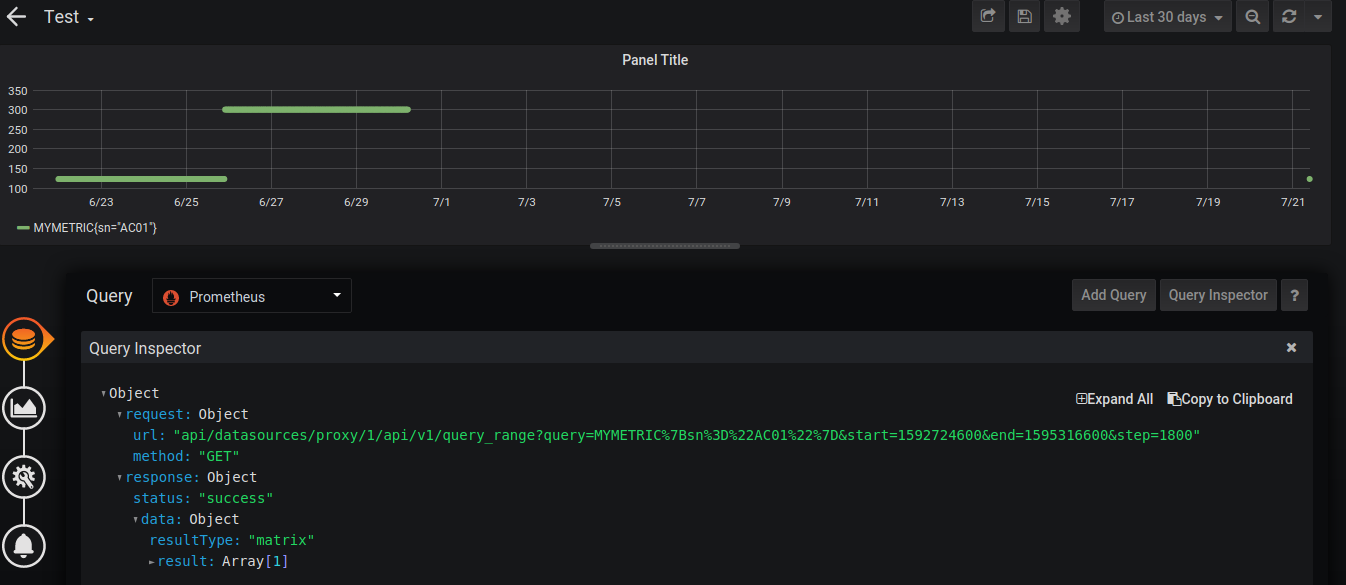
when executing a query range I get a lot of unexpected values:
curl 'http://localhost:8428/api/v1/query_range?start=1592724600&end=1595316600&step=1800' --data-urlencode
'query=MYMETRIC{sn="AC01"}'
{"status":"success","data":{"resultType":"matrix","result":[{"metric":{"__name__":"MYMETRIC","sn":"AC01"},"values":[[1592776800,"123"],[1592778600,"123"],[1592780400,"123"],[1592782200,"123"],[1592784000,"123"],[1592785800,"123"],[1592787600,"123"],[1592789400,"123"],[1592791200,"123"],[1592793000,"123"],[1592794800,"123"],[1592796600,"123"],[1592798400,"123"],[1592800200,"123"],[1592802000,"123"],[1592803800,"123"],[1592805600,"123"],[1592807400,"123"],[1592809200,"123"],[1592811000,"123"],[1592812800,"123"],[1592814600,"123"],[1592816400,"123"],[1592818200,"123"],[1592820000,"123"],[1592821800,"123"],[1592823600,"123"],[1592825400,"123"],[1592827200,"123"],[1592829000,"123"] ....
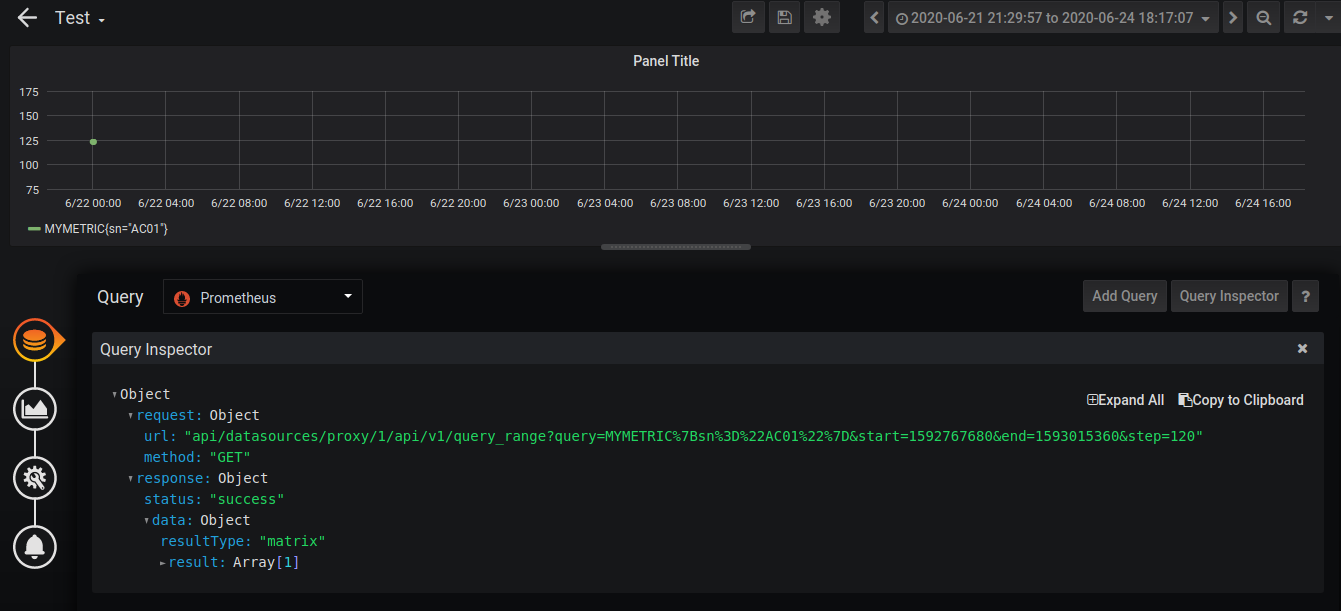
Please note that if the time interval [start,end] is restricted the unexpected repetitions disappear:
curl 'http://localhost:8428/api/v1/query_range?start=1592767680&end=1593015360&step=120' --data-urlencode 'query=MYMETRIC{sn="AC01"}'

{"status":"success","data":{"resultType":"matrix","result":[{"metric":{"__name__":"MYMETRIC","sn":"AC01"},"values":[[1592776800,"123"],[1592776920,"123"],[1592777040,"123"]]}]}}
 attdona
All 2 comments
This is expected behavior. The /api/v1/query_range operates with Prometheus data model, which assumes that:
- samples per each time series are scraped (collected) at regular interval
- time series are contiguous in time
So it fills gaps between real samples if the gap interval doesn't exceed two scrape intervals (aka two regular intervals between data points in a time series). This behavior can be overridden with -search.maxStalenessInterval command-line flag. You can see the help message for this flag when passing -help to VictoriaMetrics binary:
-search.maxStalenessInterval duration
The maximum interval for staleness calculations. By default it is automatically calculated from the median interval between samples. This flag could be useful for tuning Prometheus data model closer to Influx-style data model. See https://prometheus.io/docs/prometheus/latest/querying/basics/#staleness for details. See also '-search.maxLookback' flag, which has the same meanining due to historical reasons
Try setting low value to -search.maxStalenessInterval for your case. For example, -search.maxStalenessInterval=5m
 valyala
on 22 Jul 2020
valyala
on 22 Jul 2020
Many thanks for the explanation, configuring maxStalenessInterval works as expected.
attdona
on 22 Jul 2020
Related issues
 n4mine
·
3Comments
n4mine
·
3Comments
 jelmd
·
3Comments
jelmd
·
3Comments
 Serrvosky
·
3Comments
Serrvosky
·
3Comments
 isality
·
3Comments
isality
·
3Comments
 dima-vm
·
3Comments
dima-vm
·
3Comments