Victoriametrics: VM increase() does not provide same results as Prometheus
Describe the bug
We use VictoriaMetrics cluster version 1.37.1
VictoriaMetrics sometimes returns wrong result when we use increase() functions.
We have prometheus instance that scrapes metrics from our applications. These metrics are sent in VictoriaMetrics for longterm storage.
We use increase() fucntion to calculate the number of request for an application endpoint on a day per example
It works fine for all series when time range have all the data, but when data is missing, for example when we restart the prometheus instance, the result of increase() is wrong.
For example we did this request on VictoriaMetrics
query=sum(increase(http_server_requests_seconds_count{group=~"SI1",env=~"prod",stack_name=~"api1",service_name="gateway1",uri!="/prometheus",uri!="/health",uri=~"/api/contact/v2.*"}[86399s]))&time=1593554399
to obtain the total request for the day 2020/06/30 00:00:00 to 2020/06/30 23:59:59
--> the result is 3 307 328 requests
if we compare to directly prometheus result or to our APM (Dynatrace), the result is arround 2 300 000 requests
During this time range we had 2 prometheus restart (and so, no data during this period) from 17:41:15 to 17:42:30 and from 18:11:45 to 18:12:30
So if i cut my query for the different time range, i have this result :
from 00:00:00 to 17:41:15 --> 2 233 095 --> result ok
from 17:41:15 to 17:42:30 --> 488 033 --> interval corresponding of no data in VictoriaMetrics --> bad value
from 17:42:30 to 18:11:45 --> 56 934 --> result ok
from 18:11:45 to 18:12:30 --> 490 513 --> interval corresponding of no data in VictoriaMetrics --> bad value
from 18:12:30 to 23:59:59 --> 38 753 --> result ok
the total of all this victoria metrics request give same result as the first request on all the day : 3 307 328
if we count only the 3 interval ok (without the 2 interval with no data), the result is good : arround 2 328 782
i test add nocache=1 in the request but same result.
prometheus and dynatrace results are very closely, so i think there is a bug in victoria metrics increase() function result when there are some missing data in the time range
it seems victoria metrics consider missing data as a return to 0 counter.
the problem is visible with big counter (with a high number). For small counter increasing it's difficult to see this error
Hope my explanations are clear enough !
Can you help us ?
Thanks for help
Regards
Guillaume
 guliangsi
All 11 comments
@guliangsi , thanks for the detailed bug report!
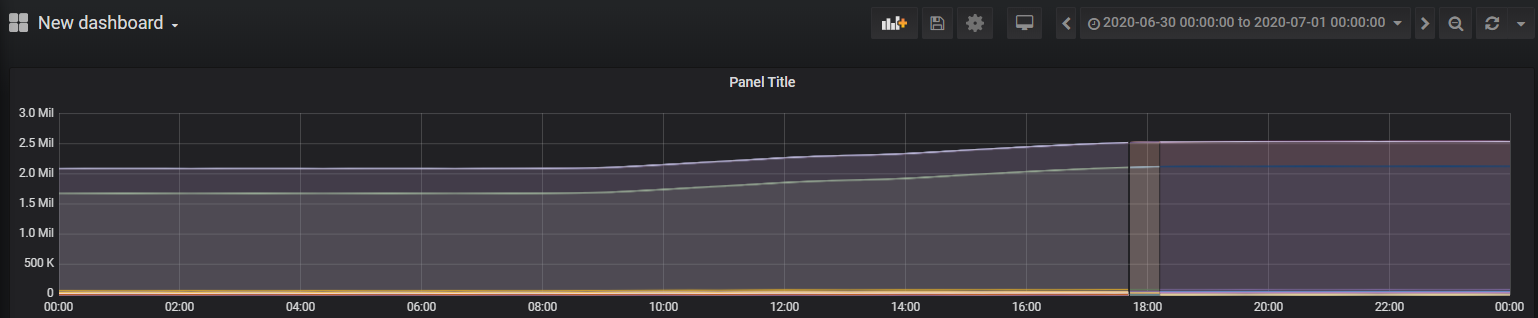
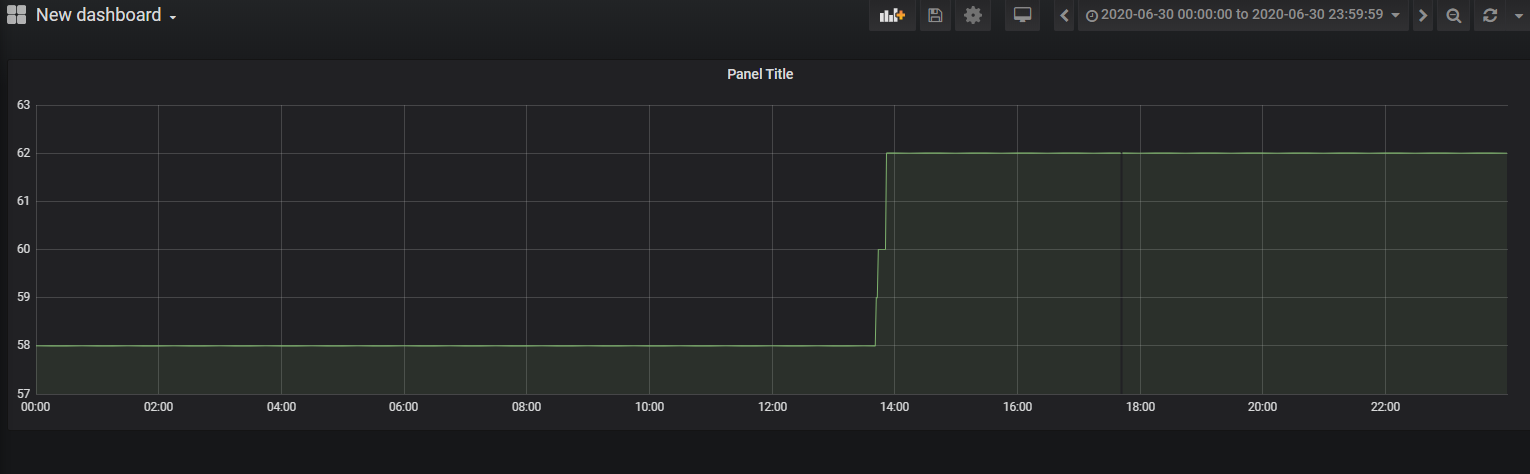
Could you share a screenshot for the query http_server_requests_seconds_count{group=~"SI1",env=~"prod",stack_name=~"api1",service_name="gateway1",uri!="/prometheus",uri!="/health",uri=~"/api/contact/v2.*"} on a time range from 2020/06/30 00:00:00 to 2020/07/01 00:00:00 ?
 valyala
on 3 Jul 2020
valyala
on 3 Jul 2020
@valyala of course, i attached the screenshot for the query on time range from 2020/06/30 00:00:00 to 2020/07/01 00:00:00
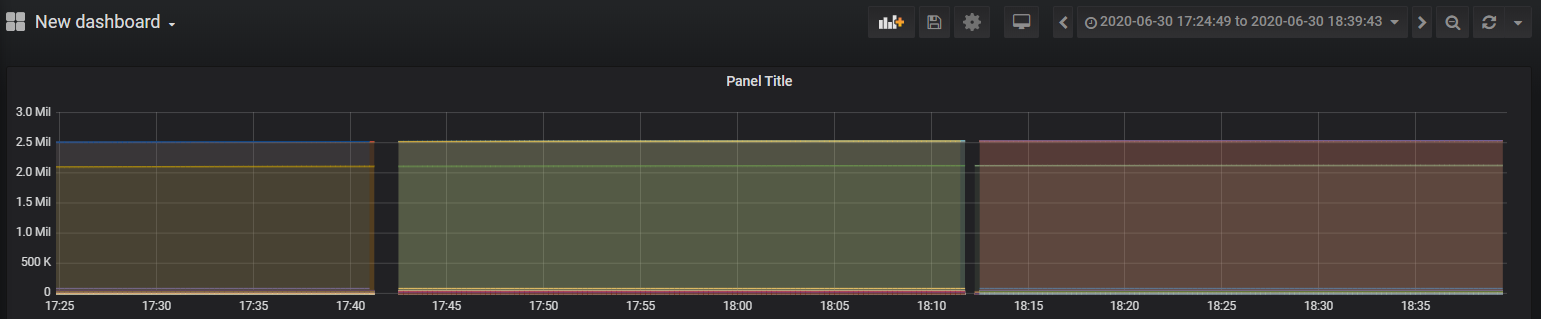
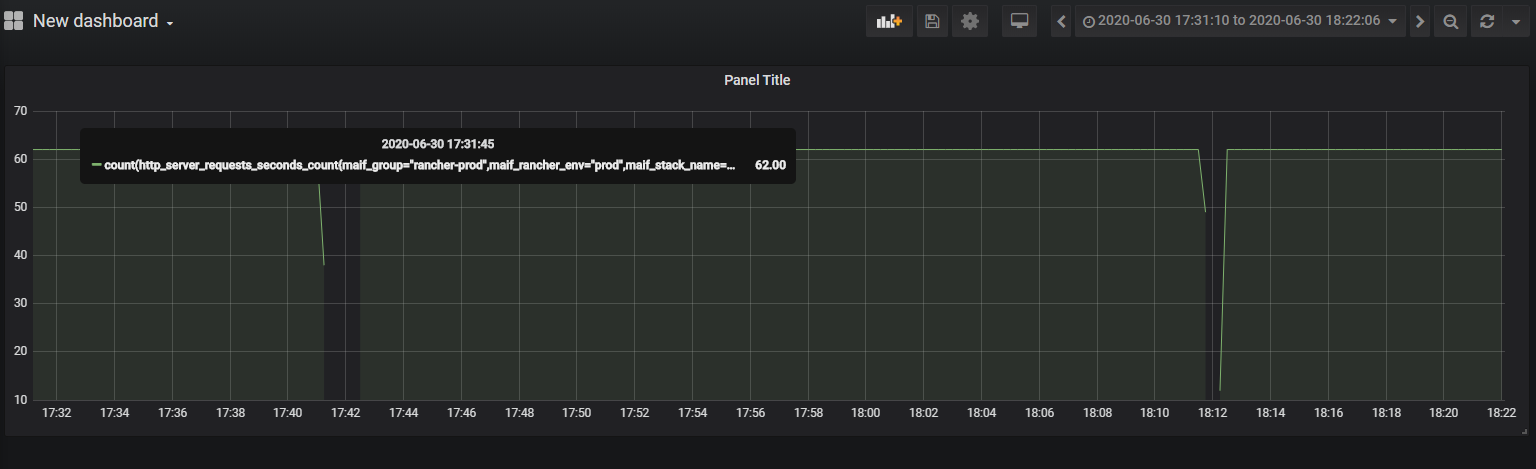
and a screenshot with a zoom on the 2 missing data periods
Thanks
guliangsi
on 3 Jul 2020
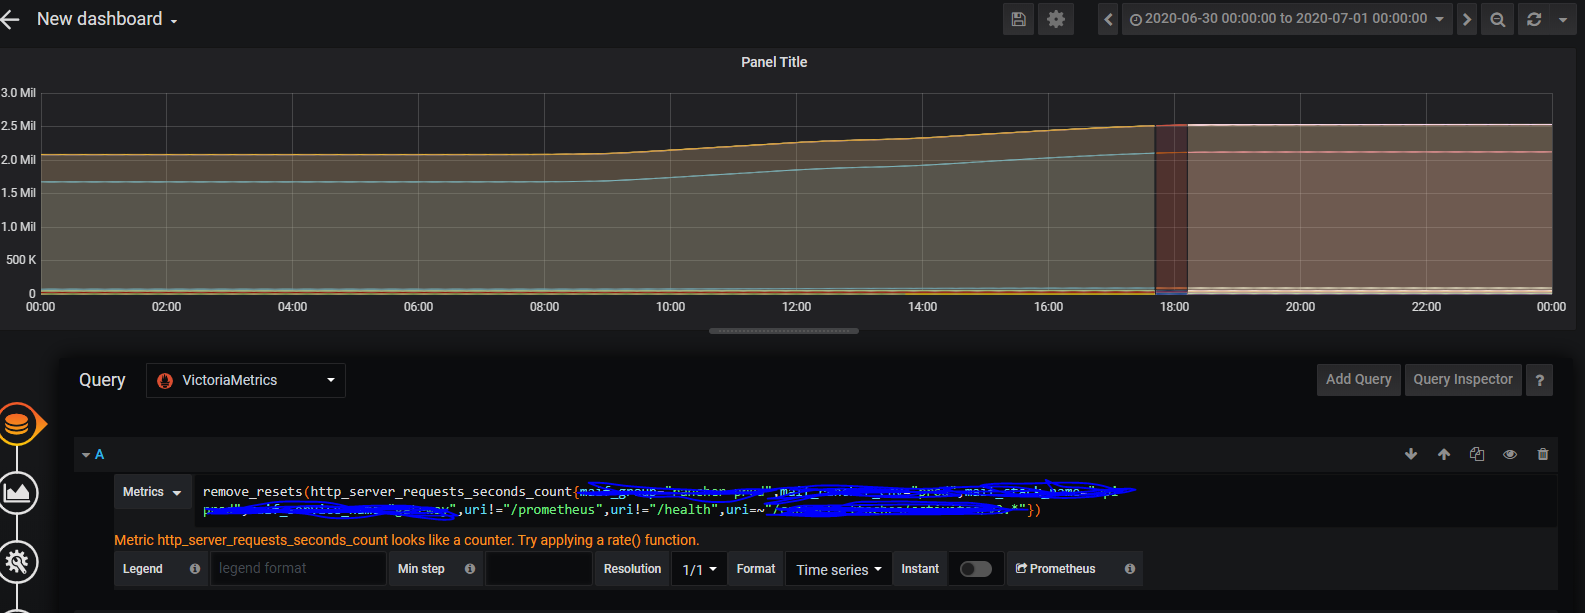
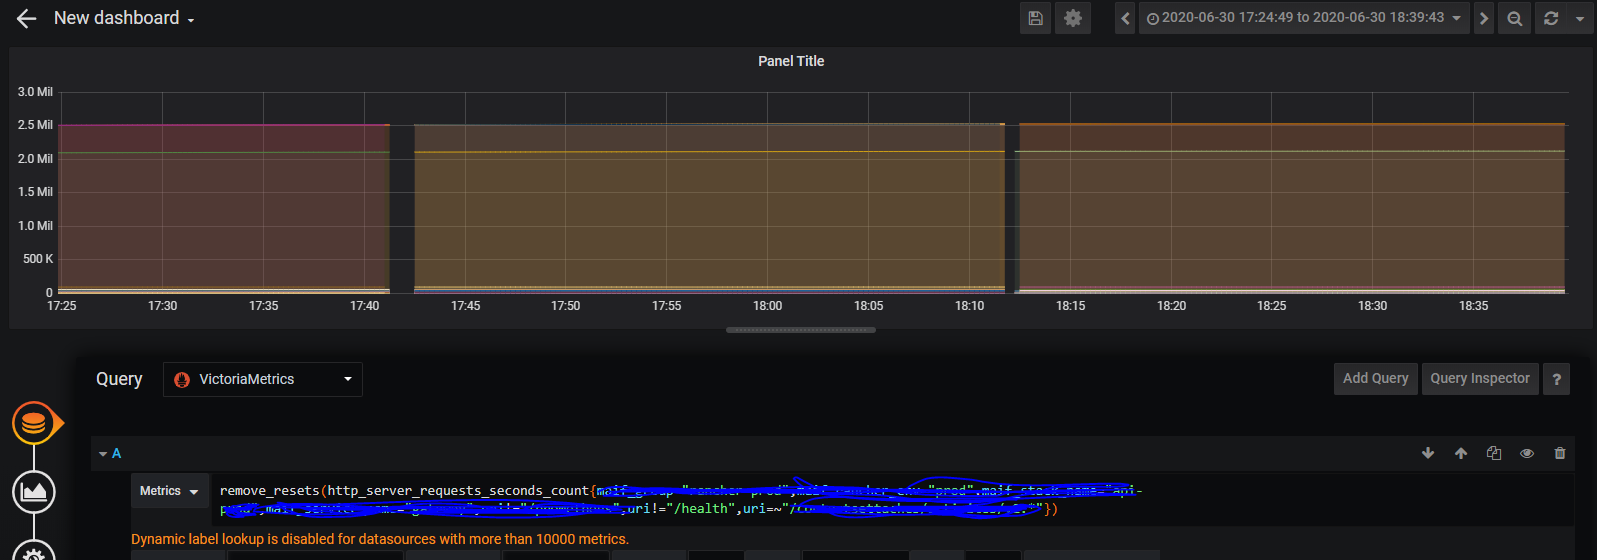
@guliangsi , could you wrap the previous query into remove_resets() function and share the resulting graph for both time ranges as above? The remove_resets() function removes counter resets in the same way as increase does behind the scenes.
valyala
on 3 Jul 2020
@valyala ok i attached the 2 graph with remove_resets(). It seems to be the same as above !
guliangsi
on 3 Jul 2020
Everything looks fine... Try sbustituting remove_resets with count and sharing the graphs. There is a possibility that certain time series started from non-zero value in the middle of the day. It is also possible to filter out the top 2 time series on the previous graph by adding < 1e6 to the query above. This will help identifying newly started time series.
Also the zoomed graph contains suspicious points at 2.5MB just before the gaps. Could you try filtering out lines with these points?
valyala
on 3 Jul 2020
except that the result of the increase () is wrong for this day ! the result is ok if we soustract the result of each missing data time range
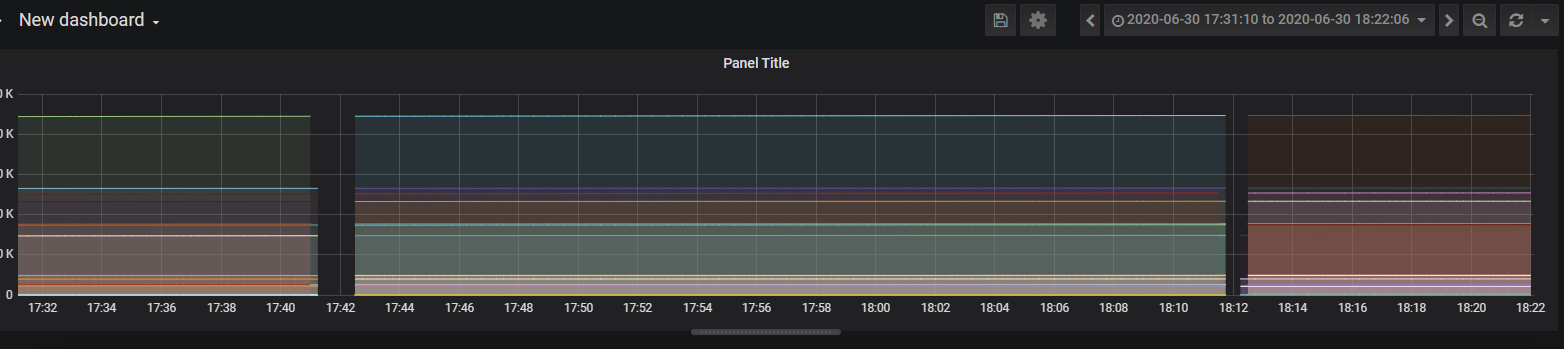
I substitute remove_resets with count, and share the graph :
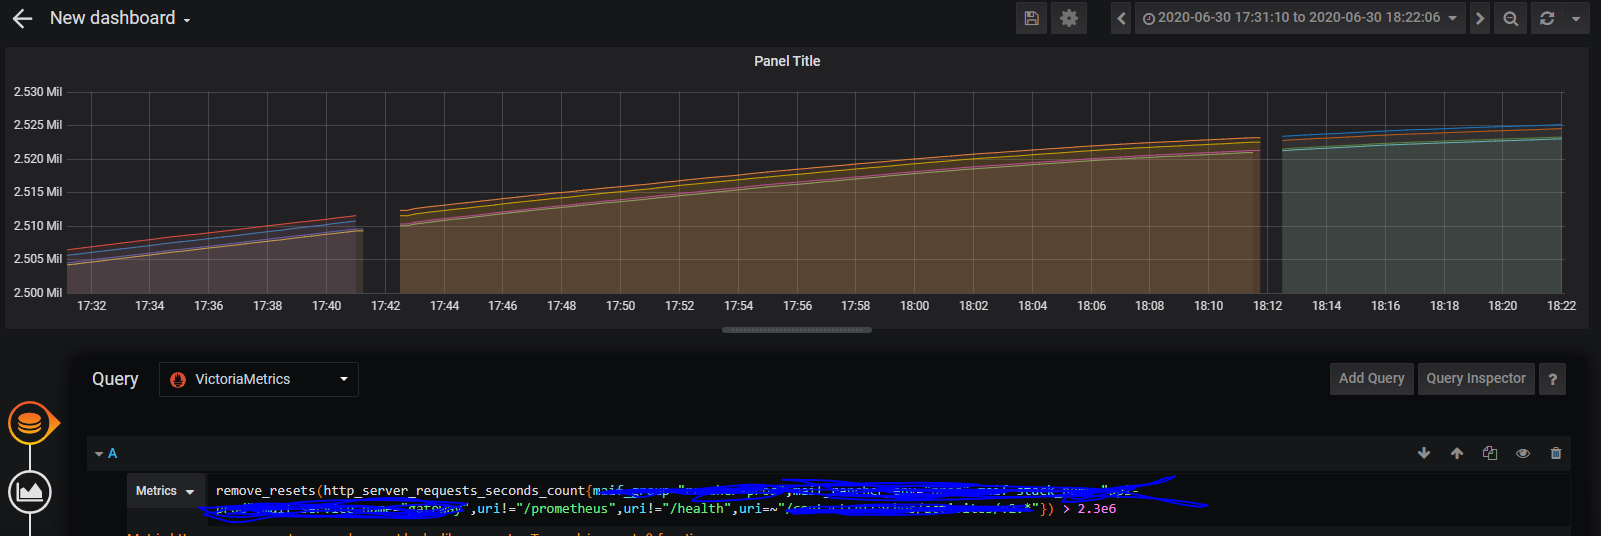
i also filter out the previous graph (remove_resets()) with < 1e6
and another graph with filter > 2.3e6 to visualize only the top series
i don't know where is the "problem", but the expected result for the query is wrong
Thanks
guliangsi
on 3 Jul 2020
@guliangsi , could you remove the outer sum from the original query in the initial bug report and compare graphs per each time series in Prometheus and VictoriaMetrics? The majority of time series should have almost identical values between VictoriaMetrics and Prometheus. The rest of time series may have different values. It is interesting to investigate these time series further.
VictoriaMetrics assumes that counter time series always start from 0 when calculating increase. So if it sees new time series that start from N, it assumes that the time series has been increased from 0 to N before the first scrape. Prometheus skips the first value for time series in this case. So the increase result for Prometheus would be smaller by N. It is likely there are 4 time series that appeared around 14:00 (see the count graph above), which may result in the discrepancy.
Prometheus also applies extrapolation when calculating increase - see https://github.com/prometheus/prometheus/issues/3746 . So it may subtract big values from the end result for the 4 time series that appeared around 14:00 when extrapolating their first data point at 00:00 .
valyala
on 3 Jul 2020
@valyala thanks for the response.
the data is no longer present in Prometheus for the time range of the issue (it's a short term instance!), so I can no longer compare between Prometheus and VictoriaMetrics.
But I can try to reproduce the problem on a test environment. Give me a few days !
guliangsi
on 6 Jul 2020
@valyala
A summary on the tests carried out, I instantiated a prometheus-test instance which scrapes only the http_server_requests_seconds_count timeseries of the
api1 and remore_wirte on a VictoriaMetrics test instance.... so, now we can play !
I left running 2 full days to get a complete dataset. On the 2nd day, i "simulate" 2 prometheus stops for about 5 minutes each.
If I compare the results of the 1st day between Prometheus and VictoriaMetrics, the results are very closesly: 2,369,605 vs 2,369,938
If we compare the results of the 2nd day (so with the 2 Prometheus stops) .... well! the results are very closesly too: 2,253,911 vs 2,253,583
Yet on the data graph, we can clearly see the "holes" in the Prometheus and VictoriaMetrics data!
So, you're right, there is no difference between Prometheus and VictoriaMetrics in most cases!
As you mention : new timeseries starting at N is the probable cause of our problem, so i took a closer look at the datasets mentioned in the issue and we can see that:
- on the series which starts at 5:46 pm (after the 1st restart), two labels are no longer present -> therefore new timeseries !
- on the series which starts at 6:15 pm (after the 2nd restart) we have a new label in addition -> therefore new timeseries !
So I understand better the difference in results that we observed, because if VictoriaMetrics sees new timeseries that start from N, it assumes that the time series has been increased from 0 to N before the first scrape
It is a bit confusing to observe different results between Prometheus and VicotriaMetrics in this case. It would be nice to have the possibility to choose between the increase() function native to Prometheus or that of VictoriaMetrics as both have their advantages / disadvantages. Maybe a feature request?
Thanks for your help, and your great job on VictoriaMetrics project !
guliangsi
on 10 Jul 2020
It would be nice to have the possibility to choose between the increase() function native to Prometheus or that of VictoriaMetrics as both have their advantages / disadvantages. Maybe a feature request?
Sounds good! Could you file a separate feature request for this?
valyala
on 10 Jul 2020
okay, i'm making a feature request for that
guliangsi
on 10 Jul 2020
Related issues
 prdatur
·
3Comments
prdatur
·
3Comments
 ozn0417
·
3Comments
ozn0417
·
3Comments
 abualy
·
3Comments
abualy
·
3Comments
 EricAntoni
·
3Comments
EricAntoni
·
3Comments
 sh0rez
·
3Comments
sh0rez
·
3Comments