Victoriametrics: Vmstorage/group-storage-optimization
Is your feature request related to a problem? Please describe.
The storage cluster we currently use contains about 100 instances, and the amount of new data added every day is about 150G.
As metrics monitoring data increases,query performance is becoming an issue that needs to be considered. Problems of low efficiency query will appear , such as querying data for the past 7 days, one month, or even a year, sometimes take a long time to respond. _These time-consuming queries will seriously degrade service performance._
Describe the solution you'd like
We use the following solutions to solve the above problems:
_Divide the data storage into different groups_, and each group has a step, which means that one metrics data point is saved in this group per step original points. The data in groups-storages is the extreme value of step original points. When the query time span is long, you can use the data in this group to query, which can effectively improve the query efficiency.
We have completed the development and testing of the relevant code, you can view the following merge request: https://github.com/VictoriaMetrics/VictoriaMetrics/pull/571
We have used this scheme of vmstorage about 2weeks.Our conclusion is this: by increasing the appropriate disk consumption, the query performance is significantly improved. So design of this solution is acceptable.
Now I will analysis of the performance of this scheme:
We used two sets of tests. First , step is taken as 4, 8. Second ,step is taken as 10, 50.
Storage use
step =4,8
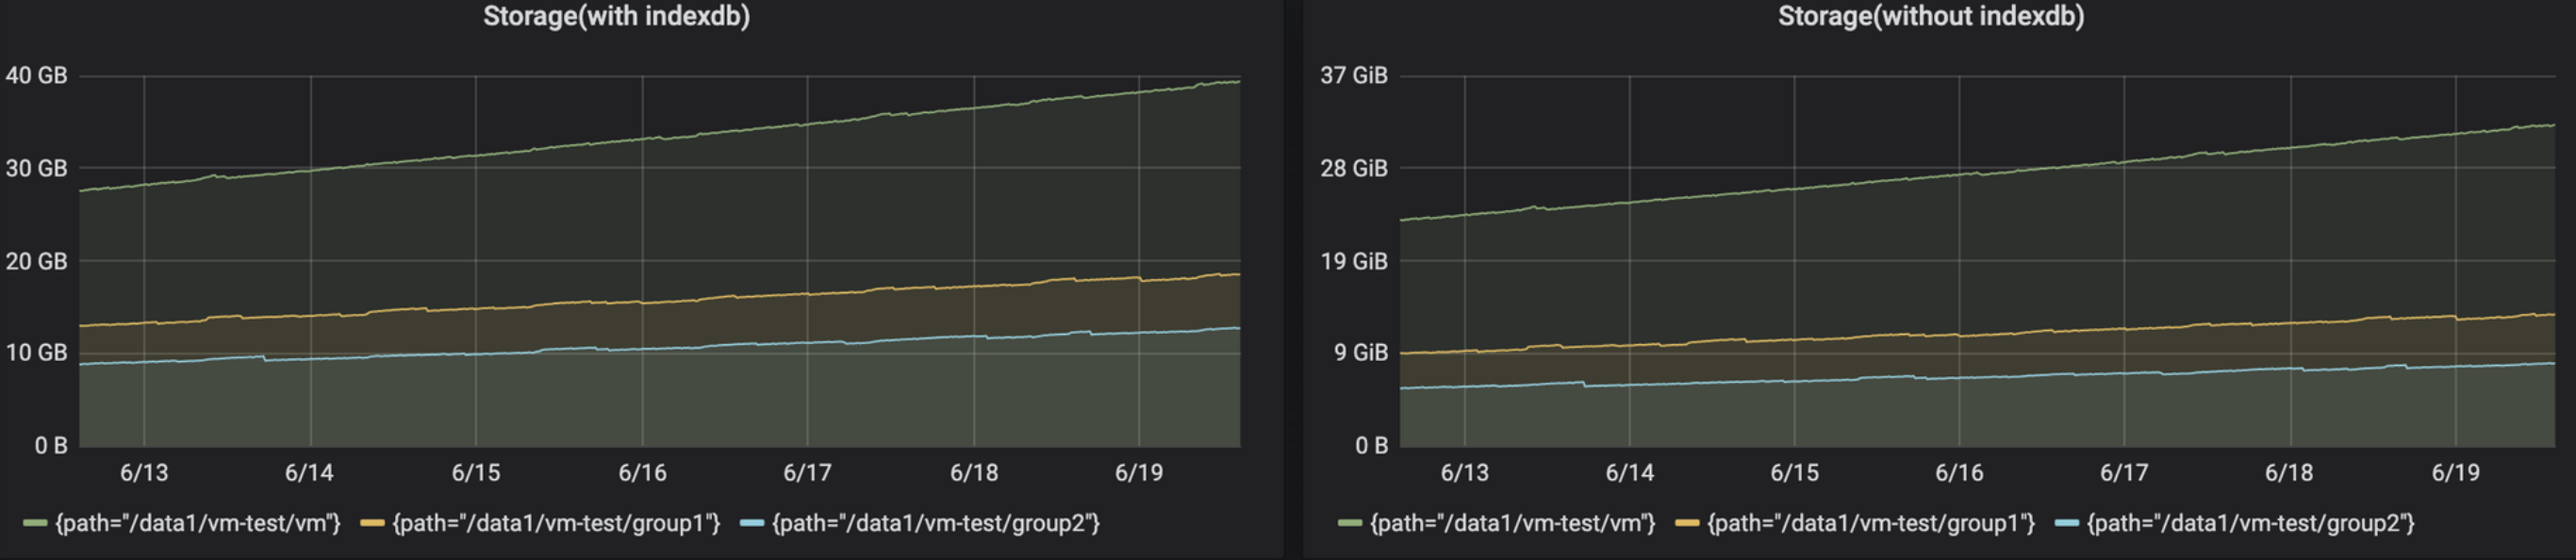
step=10,50
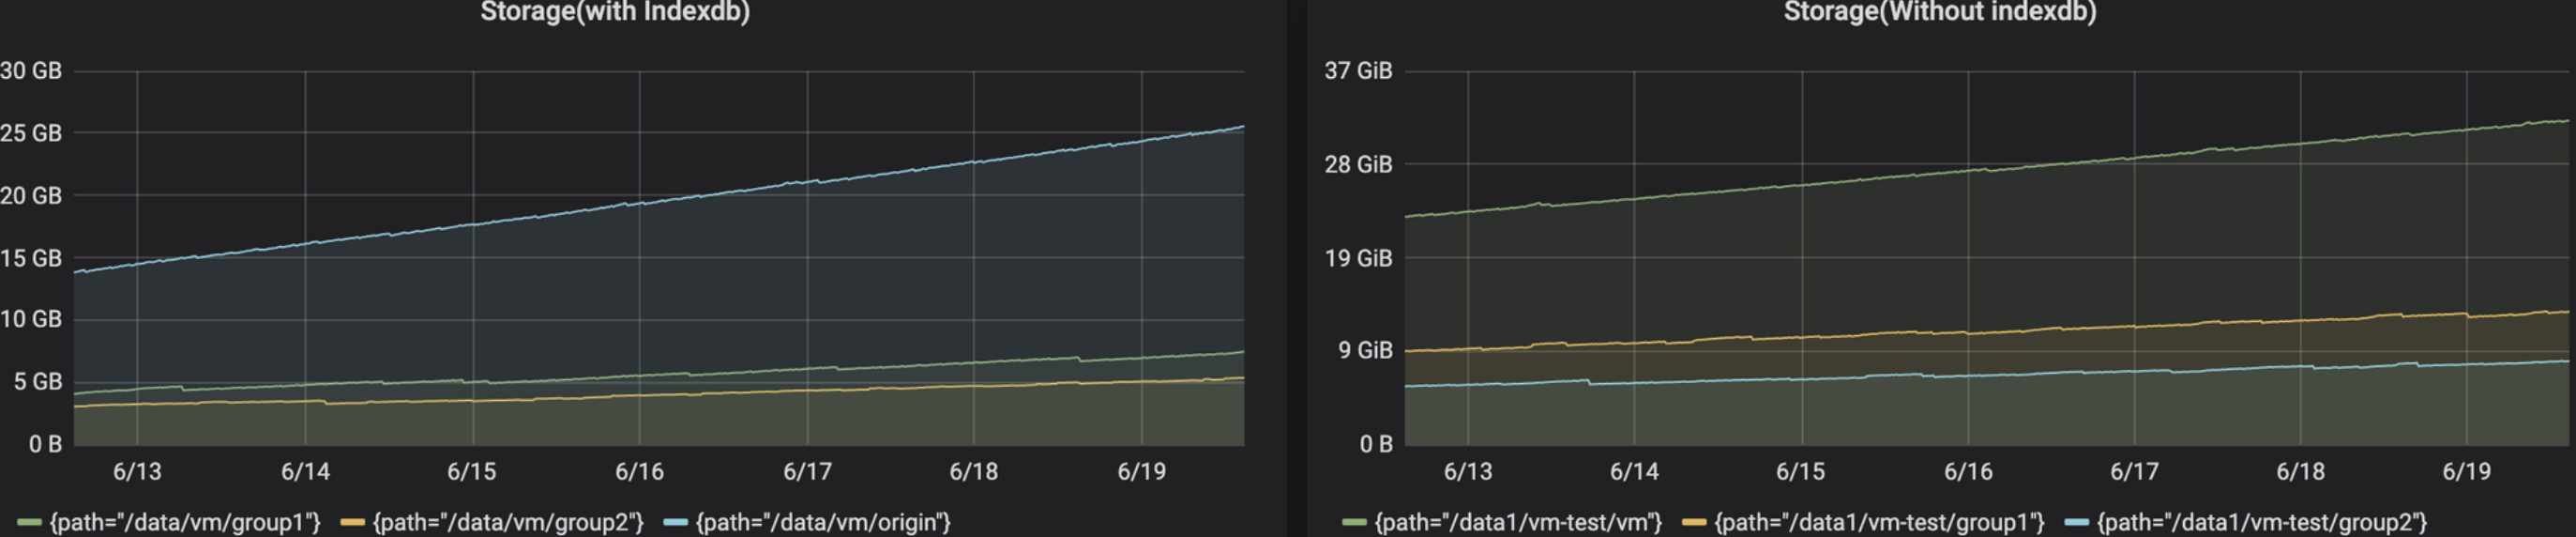
The trend of data disk occupancy will decrease with the increase of N, but the storage consumption will not decrease to 1/N of the original. However there will be a significant downward trend, and it is also within an acceptable range.
Query Optimization
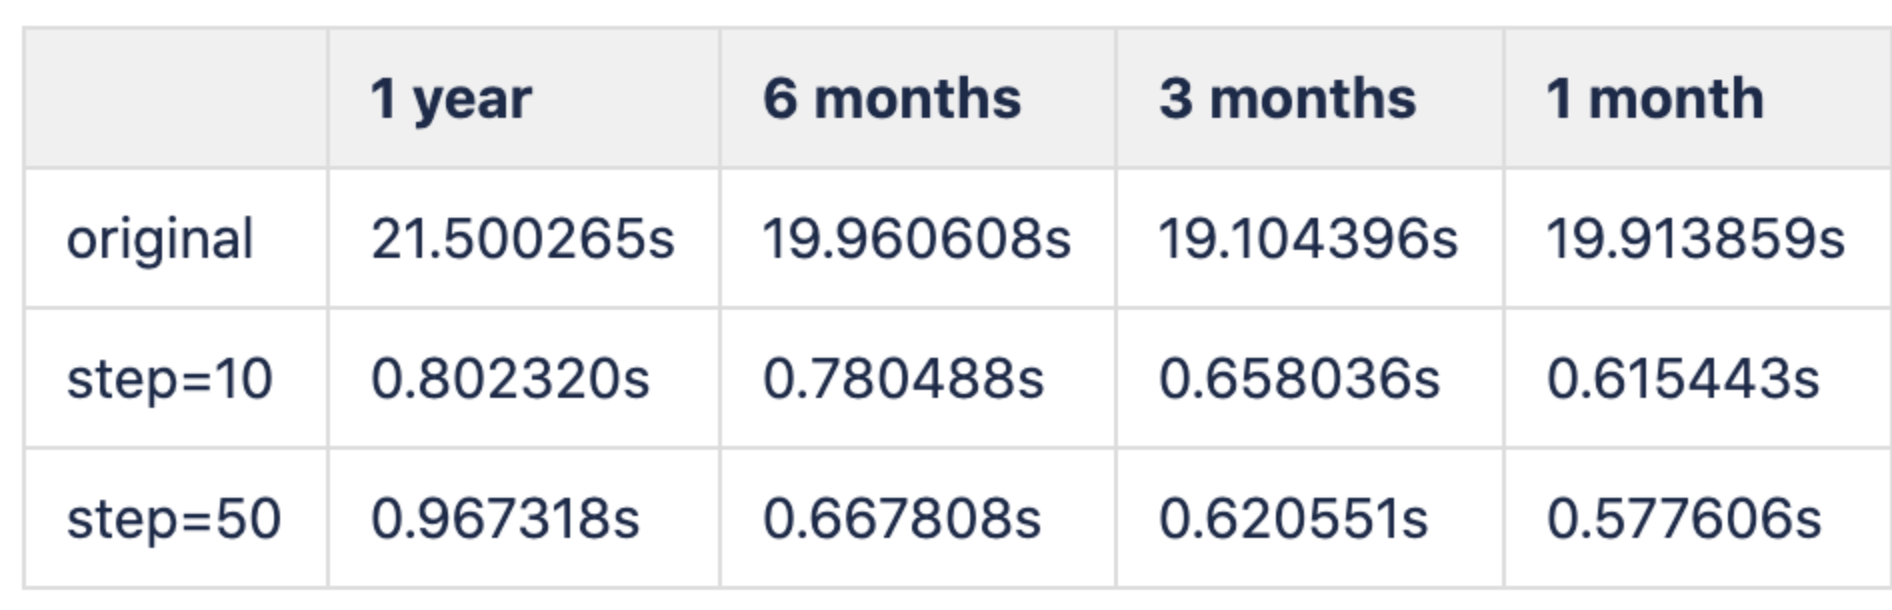
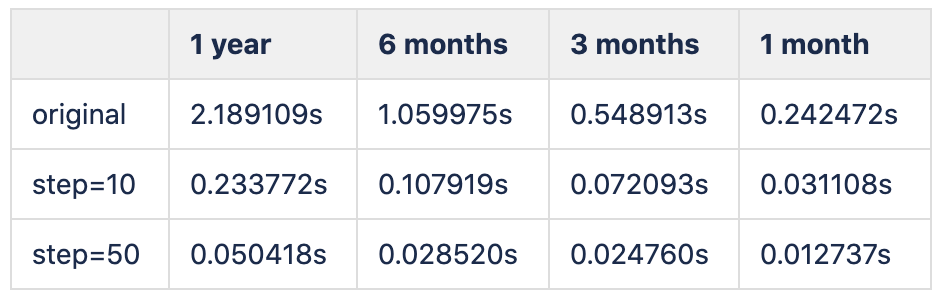
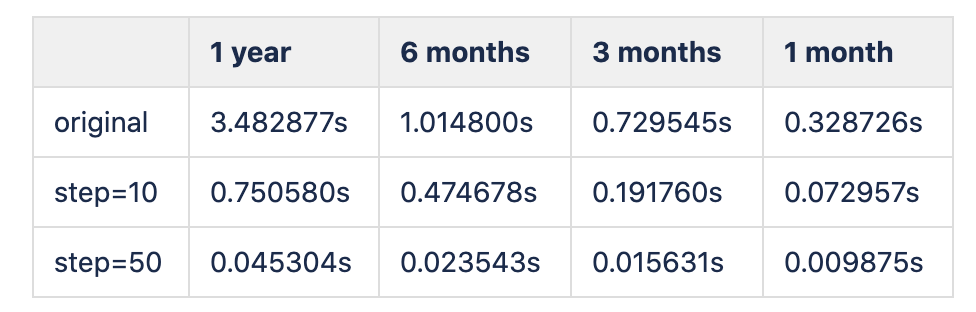
Insert 5 metrics information, the time interval of metrics is 1|2|3|4|5s, and the span of time is 1 year. Compare query time when step is 10,50 and original.
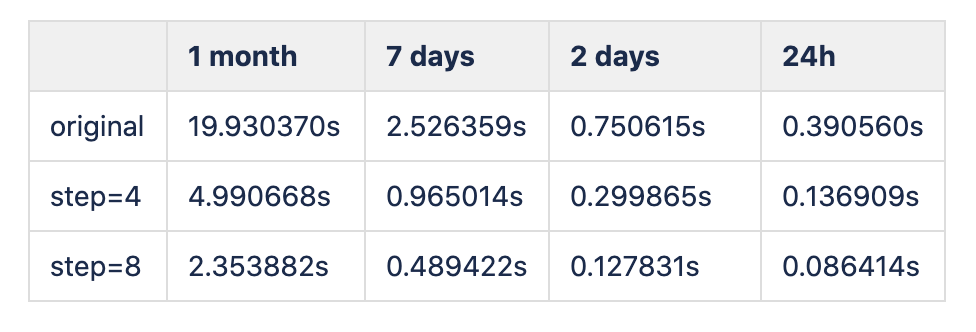
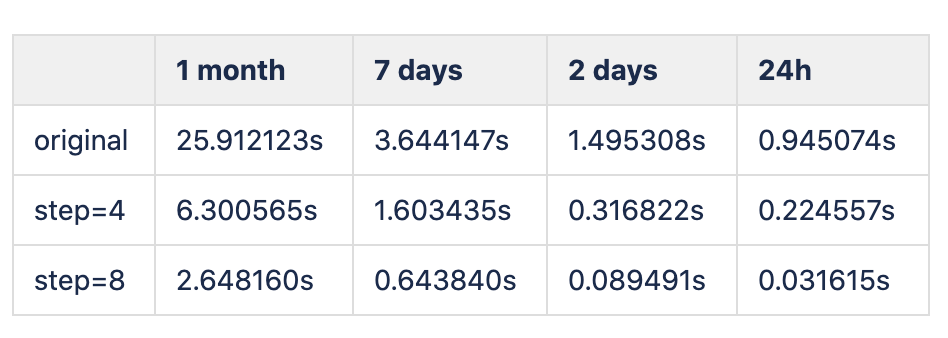
Insert 2 metrics information, the time interval of metrics is 10ms|50ms, and the span of time is 1 month. Compare query time when step is 4,8 and original.
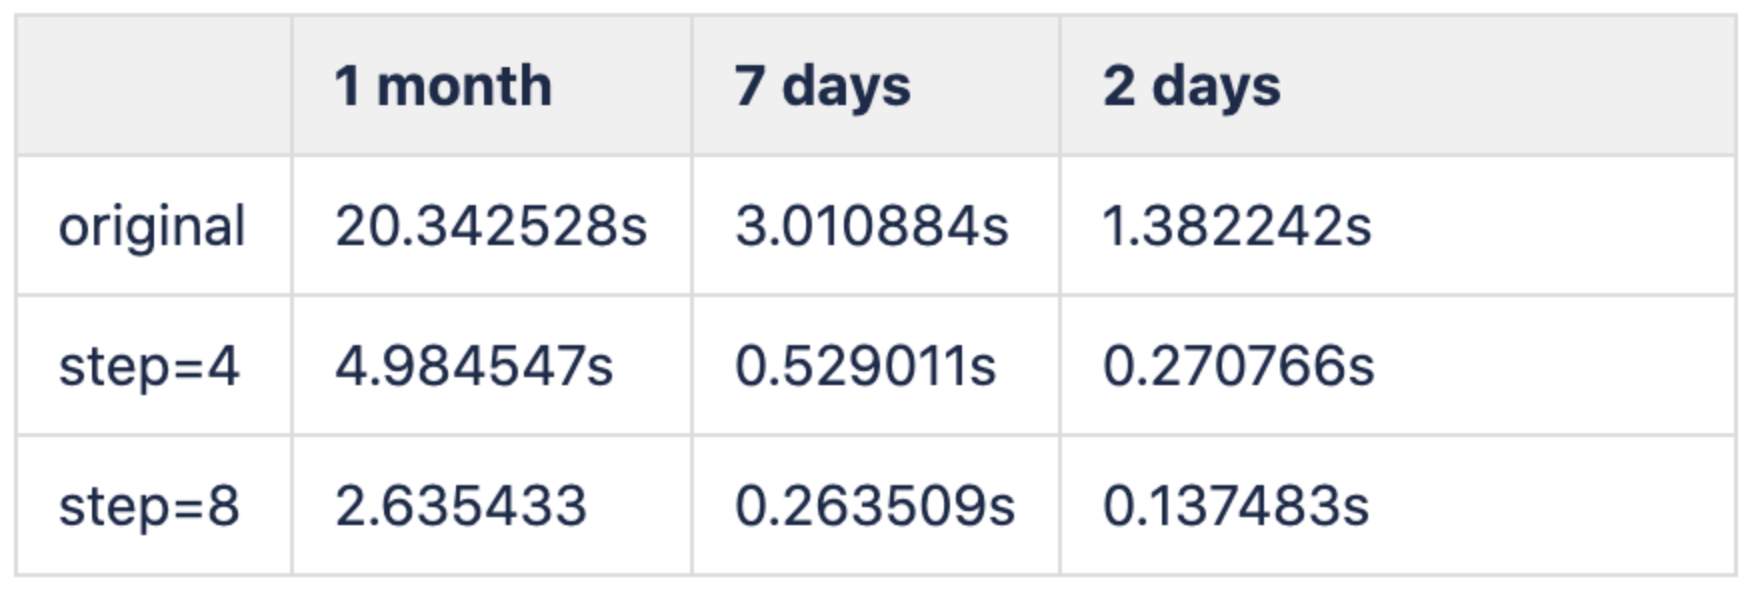
By comparing the time consumed of the query, we can draw a conclusion:
The query efficiency can be improved by at least N times
Describe alternatives you've considered
A clear and concise description of any alternative solutions or features you've considered.
Additional context
Add any other context or screenshots about the feature request here.
 IceRain00
All 9 comments
Wow, very impressive numbers, @IceRain00 ! I'll look into https://github.com/VictoriaMetrics/VictoriaMetrics/pull/571 soon. The overall design idea looks good.
Could you try passing -rpc.disableCompression command-line flag to all the vmstorage nodes of the original VictoriaMetrics and see how this improves the query performance?
 valyala
on 19 Jun 2020
valyala
on 19 Jun 2020
you mean set rpc.disableCompression=true to the vmstorage ,then compare query performance between original and groupStorage?
IceRain00
on 19 Jun 2020
you mean set rpc.disableCompression=true to the vmstorage ,then compare query performance between original and groupStorage?
Yes
valyala
on 19 Jun 2020
you mean set rpc.disableCompression=true to the vmstorage ,then compare query performance between original and groupStorage?
Yes
ok,I will do and give the result of query performance soon.
IceRain00
on 19 Jun 2020
very useful, not only for performance, if this works, we can set different store period for different storge group
ori data we can just store for 3 months, other data we can store for 1 year, 10 year...
faster query speed, and a little storage used, waiting for review!
 xbsura
on 21 Jun 2020
xbsura
on 21 Jun 2020
I compare the query performance when rpc.disableCompression=true and rpc.disableCompression=false. The performance is as follow:
rpc.disableCompression=true
insert 5 metrics, time span is 1|2|3|4|5s. Insert 1 year metrics data. original,step=10|50
insert 2 metrics, time span is 10|50ms. Insert 1 month metrics data. original,step=4|8
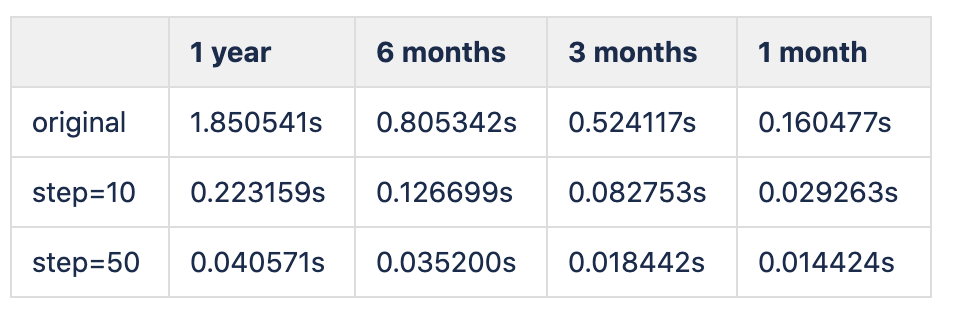
rpc.disableCompression=false
insert 5 metrics, time span is 1|2|3|4|5s. Insert 1 year metrics data. original,step=10|50
insert 2 metrics, time span is 10|50ms. Insert 1 month metrics data. original,step=4|8
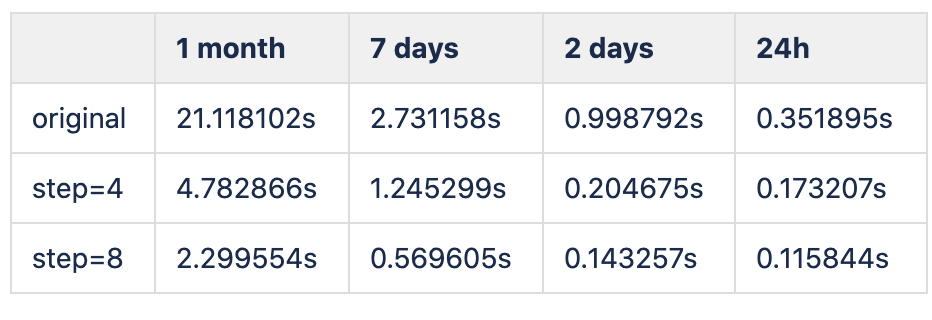
It seems that rpc.disableCompression has little influences on query performance.
IceRain00
on 21 Jun 2020
@IceRain00 , thanks for the results! It looks my original assumption about the bottleneck in data compression between vmstorage and vmselect isn't confirmed.
BTW, latencies from the table for 5 metrics, 1|2|3|4|5s for the original VM version in the last message look much better than the latencies from the same table in the first message, i.e. 2s vs 20s. Do you have any explanations for this?
There is yet another assumptions about the bottleneck in the limited concurrency when processing small number of time series with big number of data points in each time series. Could you try building VictoriaMetrics vmselect from the commit 0fdbe5de25dce248fbcd9206910fb79aa0b72424 and verify whether it provides improved performance for your case?
valyala
on 23 Jun 2020
0fdbe5d
oh,for your first question,this is my promblem.In result table for 5 metrics, 1|2|3|4|5s, I initially inserted some metrics information with the same metrics name as 5 metrics, 1|2|3|4|5s. However, the time interval is all in the ms level, which results in incorrect results for the first query. In the second query result, I re-inserted only these metrics in a new vmstorage.
So the second result is correct
ok , I will try build vmselect from the commit https://github.com/VictoriaMetrics/VictoriaMetrics/commit/0fdbe5de25dce248fbcd9206910fb79aa0b72424 ,then test query performance.
But I think vmselect has little influences. When metrics data is large,the main effect on query performance is vmstorage
IceRain00
on 24 Jun 2020
I build vmselect,from commit https://github.com/VictoriaMetrics/VictoriaMetrics/commit/0fdbe5de25dce248fbcd9206910fb79aa0b72424 .The query performance between original and groupStorage is as follow:
5 metrics, 1|2|3|4|5s
2 metrics, 10|50ms
Compare previous query result ,the query performance of vmselect from commit https://github.com/VictoriaMetrics/VictoriaMetrics/commit/0fdbe5de25dce248fbcd9206910fb79aa0b72424 looks like is worse.
for example,in 2 metrics, 10|50ms,1month,the query time is 25.912123s vs 19.930370s
IceRain00
on 24 Jun 2020
Related issues
 v98765
·
3Comments
v98765
·
3Comments
 EricAntoni
·
3Comments
EricAntoni
·
3Comments
 jelmd
·
3Comments
jelmd
·
3Comments
 dima-vm
·
3Comments
dima-vm
·
3Comments
 prdatur
·
3Comments
prdatur
·
3Comments
Most helpful comment
I build
vmselect,from commit https://github.com/VictoriaMetrics/VictoriaMetrics/commit/0fdbe5de25dce248fbcd9206910fb79aa0b72424 .The query performance between original and groupStorage is as follow:5 metrics, 1|2|3|4|5s
2 metrics, 10|50ms
Compare previous query result ,the query performance of
vmselectfrom commit https://github.com/VictoriaMetrics/VictoriaMetrics/commit/0fdbe5de25dce248fbcd9206910fb79aa0b72424 looks like is worse.for example,in
2 metrics, 10|50ms,1month,the query time is 25.912123s vs 19.930370s