Victoriametrics: performance issue at 00:00 per day
Describe the bug
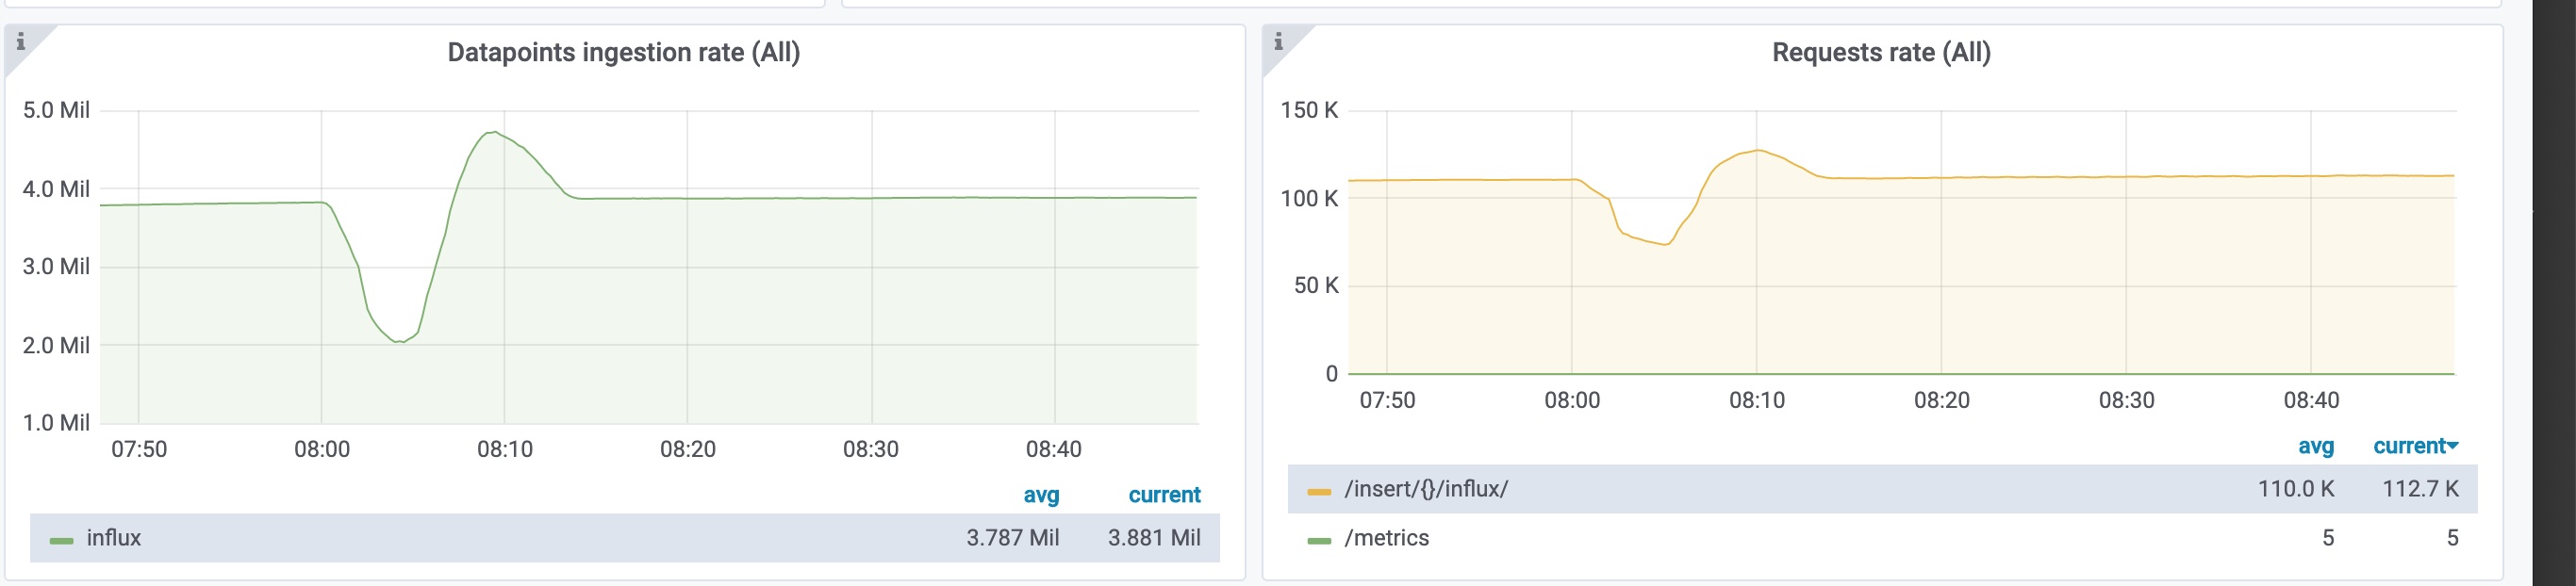
vminsert use more memory(8G) than usual(less than 1G), and then OOM(vminsert is running in container with 8g memory)
To Reproduce
at 00:00(utc) per day
Expected behavior
vminsert don't use too many memory at 00:00
Version
The line returned when passing --version command line flag to binary. For example:
$./vminsert-prod -version
vminsert-20200414-050628-heads-cluster-0-g755f649c-dirty-a3885c59

./vmstorage-prod -version
vmstorage-20200414-062705-heads-cluster-0-g755f649c-dirty-a3885c59
dirty because i remove "-s -w" build flag in makefile
Used command-line flags
default, except
vmstorage: -retentionPeriod 6
vminsert: -influxSkipSingleField
Additional context
cluster
we have vminsert * 30(with 8core 8g memory container)
and vmstorage * 6(40 core 128g memory physical machine)
vminsert logs
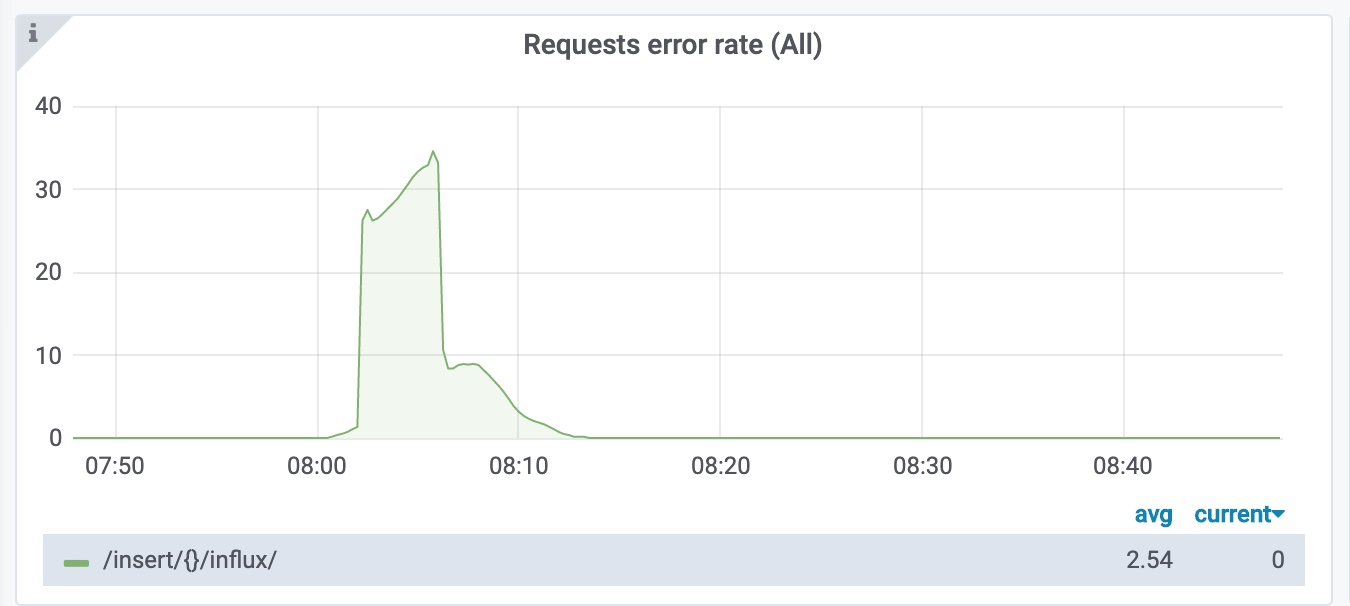
2020-04-22T00:01:45.292Z    error   VictoriaMetrics/app/vminsert/main.go:177    error in "/insert/0/influx/write": cannot read influx line protocol data: unexpected EOF
2020-04-22T00:01:45.293Z    error   VictoriaMetrics/app/vminsert/main.go:177    error in "/insert/0/influx/write": cannot read influx line protocol data: unexpected EOF
2020-04-22T00:01:45.344Z    error   VictoriaMetrics/app/vminsert/main.go:177    error in "/insert/0/influx/write": cannot read influx line protocol data: unexpected EOF
2020-04-22T00:01:45.365Z    error   VictoriaMetrics/app/vminsert/main.go:177    error in "/insert/0/influx/write": cannot read influx line protocol data: unexpected EOF
2020-04-22T00:01:45.381Z    error   VictoriaMetrics/app/vminsert/main.go:177    error in "/insert/0/influx/write": cannot read influx line protocol data: unexpected EOF
2020-04-22T00:01:45.408Z    error   VictoriaMetrics/app/vminsert/main.go:177    error in "/insert/0/influx/write": cannot read influx line protocol data: unexpected EOF
2020-04-22T00:01:46.189Z    error   VictoriaMetrics/app/vminsert/main.go:177    error in "/insert/0/influx/write": cannot read influx line protocol data: unexpected EOF
2020-04-22T00:01:46.209Z    error   VictoriaMetrics/app/vminsert/main.go:177    error in "/insert/0/influx/write": cannot read influx line protocol data: unexpected EOF
2020-04-22T00:01:46.481Z    error   VictoriaMetrics/app/vminsert/main.go:177    error in "/insert/0/influx/write": cannot read influx line protocol data: unexpected EOF
2020-04-22T00:01:46.565Z    error   VictoriaMetrics/app/vminsert/main.go:177    error in "/insert/0/influx/write": cannot read influx line protocol data: unexpected EOF
2020-04-22T00:02:03.486Z    error   VictoriaMetrics/app/vminsert/main.go:177    error in "/insert/0/influx/write": cannot handle more than 32 concurrent inserts during 1m0s; possible solutions: increase `-insert.maxQueueDuration`, increase `-maxConcurrentInserts`, increase server capacity
2020-04-22T00:02:03.486Z    error   VictoriaMetrics/app/vminsert/main.go:177    error in "/insert/0/influx/write": cannot handle more than 32 concurrent inserts during 1m0s; possible solutions: increase `-insert.maxQueueDuration`, increase `-maxConcurrentInserts`, increase server capacity
2020-04-22T00:02:03.486Z    error   VictoriaMetrics/app/vminsert/main.go:177    error in "/insert/0/influx/write": cannot handle more than 32 concurrent inserts during 1m0s; possible solutions: increase `-insert.maxQueueDuration`, increase `-maxConcurrentInserts`, increase server capacity
2020-04-22T00:02:03.487Z    error   VictoriaMetrics/app/vminsert/main.go:177    error in "/insert/0/influx/write": cannot handle more than 32 concurrent inserts during 1m0s; possible solutions: increase `-insert.maxQueueDuration`, increase `-maxConcurrentInserts`, increase server capacity
2020-04-22T00:02:03.487Z    error   VictoriaMetrics/app/vminsert/main.go:177    error in "/insert/0/influx/write": cannot handle more than 32 concurrent inserts during 1m0s; possible solutions: increase `-insert.maxQueueDuration`, increase `-maxConcurrentInserts`, increase server capacity
2020-04-22T00:02:03.487Z    error   VictoriaMetrics/app/vminsert/main.go:177    error in "/insert/0/influx/write": cannot handle more than 32 concurrent inserts during 1m0s; possible solutions: increase `-insert.maxQueueDuration`, increase `-maxConcurrentInserts`, increase server capacity
2020-04-22T00:02:03.489Z    error   VictoriaMetrics/app/vminsert/main.go:177    error in "/insert/0/influx/write": cannot handle more than 32 concurrent inserts during 1m0s; possible solutions: increase `-insert.maxQueueDuration`, increase `-maxConcurrentInserts`, increase server capacity
2020-04-22T00:02:03.489Z    error   VictoriaMetrics/app/vminsert/main.go:177    error in "/insert/0/influx/write": cannot handle more than 32 concurrent inserts during 1m0s; possible solutions: increase `-insert.maxQueueDuration`, increase `-maxConcurrentInserts`, increase server capacity
2020-04-22T00:02:03.489Z    error   VictoriaMetrics/app/vminsert/main.go:177    error in "/insert/0/influx/write": cannot handle more than 32 concurrent inserts during 1m0s; possible solutions: increase `-insert.maxQueueDuration`, increase `-maxConcurrentInserts`, increase server capacity
2020-04-22T00:02:03.489Z    error   VictoriaMetrics/app/vminsert/main.go:177    error in "/insert/0/influx/write": cannot handle more than 32 concurrent inserts during 1m0s; possible solutions: increase `-insert.maxQueueDuration`, increase `-maxConcurrentInserts`, increase server capacity
2020-04-22T00:02:11.254Z    info    VictoriaMetrics/lib/logger/flag.go:11   build version: vminsert-20200414-050628-heads-cluster-0-g755f649c-dirty-a3885c59
2020-04-22T00:02:11.254Z    info    VictoriaMetrics/lib/logger/flag.go:12   command line flags
2020-04-22T00:02:11.254Z    info    VictoriaMetrics/lib/logger/flag.go:20   flag "csvTrimTimestamp" = "1ms"
2020-04-22T00:02:11.254Z    info    VictoriaMetrics/lib/logger/flag.go:20   flag "enableTCP6" = "false"
2020-04-22T00:02:11.254Z    info    VictoriaMetrics/lib/logger/flag.go:20   flag "envflag.enable" = "false"
2020-04-22T00:02:11.254Z    info    VictoriaMetrics/lib/logger/flag.go:20   flag "envflag.prefix" = ""
2020-04-22T00:02:11.254Z    info    VictoriaMetrics/lib/logger/flag.go:20   flag "fs.disableMmap" = "false"
2020-04-22T00:02:11.254Z    info    VictoriaMetrics/lib/logger/flag.go:20   flag "graphiteListenAddr" = ""
2020-04-22T00:02:11.254Z    info    VictoriaMetrics/lib/logger/flag.go:20   flag "graphiteTrimTimestamp" = "1s"
2020-04-22T00:02:11.254Z    info    VictoriaMetrics/lib/logger/flag.go:20   flag "http.disableResponseCompression" = "false"
2020-04-22T00:02:11.254Z    info    VictoriaMetrics/lib/logger/flag.go:20   flag "http.maxGracefulShutdownDuration" = "7s"
2020-04-22T00:02:11.254Z    info    VictoriaMetrics/lib/logger/flag.go:20   flag "httpListenAddr" = ":8480"
2020-04-22T00:02:11.254Z    info    VictoriaMetrics/lib/logger/flag.go:20   flag "import.maxLineLen" = "104857600"
2020-04-22T00:02:11.254Z    info    VictoriaMetrics/lib/logger/flag.go:20   flag "influxListenAddr" = ""
2020-04-22T00:02:11.254Z    info    VictoriaMetrics/lib/logger/flag.go:20   flag "influxMeasurementFieldSeparator" = "_"
2020-04-22T00:02:11.254Z    info    VictoriaMetrics/lib/logger/flag.go:20   flag "influxSkipSingleField" = "true"
2020-04-22T00:02:11.254Z    info    VictoriaMetrics/lib/logger/flag.go:20   flag "influxTrimTimestamp" = "1ms"
2020-04-22T00:02:11.254Z    info    VictoriaMetrics/lib/logger/flag.go:20   flag "insert.maxQueueDuration" = "1m0s"
2020-04-22T00:02:11.254Z    info    VictoriaMetrics/lib/logger/flag.go:20   flag "loggerFormat" = "default"
2020-04-22T00:02:11.254Z    info    VictoriaMetrics/lib/logger/flag.go:20   flag "loggerLevel" = "INFO"
2020-04-22T00:02:11.254Z    info    VictoriaMetrics/lib/logger/flag.go:20   flag "loggerOutput" = "stderr"
2020-04-22T00:02:11.254Z    info    VictoriaMetrics/lib/logger/flag.go:20   flag "maxConcurrentInserts" = "32"
2020-04-22T00:02:11.254Z    info    VictoriaMetrics/lib/logger/flag.go:20   flag "maxInsertRequestSize" = "33554432"
2020-04-22T00:02:11.254Z    info    VictoriaMetrics/lib/logger/flag.go:20   flag "maxLabelsPerTimeseries" = "30"
2020-04-22T00:02:11.254Z    info    VictoriaMetrics/lib/logger/flag.go:20   flag "memory.allowedPercent" = "60"
2020-04-22T00:02:11.254Z    info    VictoriaMetrics/lib/logger/flag.go:20   flag "opentsdbHTTPListenAddr" = ""
2020-04-22T00:02:11.254Z    info    VictoriaMetrics/lib/logger/flag.go:20   flag "opentsdbListenAddr" = ""
2020-04-22T00:02:11.254Z    info    VictoriaMetrics/lib/logger/flag.go:20   flag "opentsdbTrimTimestamp" = "1s"
2020-04-22T00:02:11.254Z    info    VictoriaMetrics/lib/logger/flag.go:20   flag "opentsdbhttp.maxInsertRequestSize" = "33554432"
2020-04-22T00:02:11.254Z    info    VictoriaMetrics/lib/logger/flag.go:20   flag "opentsdbhttpTrimTimestamp" = "1ms"
2020-04-22T00:02:11.254Z    info    VictoriaMetrics/lib/logger/flag.go:20   flag "rpc.disableCompression" = "false"
2020-04-22T00:02:11.254Z    info    VictoriaMetrics/lib/logger/flag.go:20   flag "storageNode" = "10.90.81.34:8400,10.90.67.34:8400,10.90.62.63:8400,10.90.58.59:8400,10.90.58.63:8400,10.90.59.26:8400"
2020-04-22T00:02:11.254Z    info    VictoriaMetrics/lib/logger/flag.go:20   flag "version" = "false"
2020-04-22T00:02:11.254Z    info    VictoriaMetrics/app/vminsert/main.go:59 initializing netstorage for storageNodes [10.90.81.34:8400 10.90.67.34:8400 10.90.62.63:8400 10.90.58.59:8400 10.90.58.63:8400 10.90.59.26:8400]...
2020-04-22T00:02:11.255Z    info    VictoriaMetrics/lib/memory/memory.go:35 limiting caches to 5153960755 bytes, leaving 3435973837 bytes to the OS according to -memory.allowedPercent=60
2020-04-22T00:02:11.255Z    info    VictoriaMetrics/app/vminsert/main.go:65 successfully initialized netstorage in 0.001 seconds
2020-04-22T00:02:11.255Z    info    VictoriaMetrics/lib/httpserver/httpserver.go:50 starting http server at http://:8480/
2020-04-22T00:02:11.255Z    info    VictoriaMetrics/lib/httpserver/httpserver.go:51 pprof handlers are exposed at http://:8480/debug/pprof/
2020-04-22T00:02:39.384Z    error   VictoriaMetrics/app/vminsert/main.go:177    error in "/insert/0/influx/write": cannot read influx line protocol data: unexpected EOF
2020-04-22T00:02:39.398Z    error   VictoriaMetrics/app/vminsert/main.go:177    error in "/insert/0/influx/write": cannot read influx line protocol data: unexpected EOF
2020-04-22T00:02:39.438Z    error   VictoriaMetrics/app/vminsert/main.go:177    error in "/insert/0/influx/write": cannot read influx line protocol data: unexpected EOF
2020-04-22T00:02:39.442Z    error   VictoriaMetrics/app/vminsert/main.go:177    error in "/insert/0/influx/write": cannot read influx line protocol data: unexpected EOF
2020-04-22T00:02:39.487Z    error   VictoriaMetrics/app/vminsert/main.go:177    error in "/insert/0/influx/write": cannot read influx line protocol data: unexpected EOF
dashboard
 n4mine
All 17 comments
i have same problem
 yincongcyincong
on 22 Apr 2020
yincongcyincong
on 22 Apr 2020
pprof every 10s
while : ; do curl -s vminsert:8480/debug/pprof/heap > vminsert_$(date +%s) ; sleep 10; done
one of pprof(zip) file
mem.pprof.zip
and show top N
for i in vminsert* ; do go tool pprof -top $i | head -15 ;read ; done
result
File: vminsert-prod
Build ID: 1440fb7cc2c5bdc6c38b14bbe22cb0ef59f1cd53
Type: inuse_space
Time: Apr 23, 2020 at 8:00am (CST)
Showing nodes accounting for 626.45MB, 97.37% of 643.36MB total
Dropped 76 nodes (cum <= 3.22MB)
      flat  flat%   sum%        cum   cum%
  310.45MB 48.26% 48.26%   310.45MB 48.26%  github.com/VictoriaMetrics/VictoriaMetrics/app/vminsert/netstorage.(*storageNode).push
  178.66MB 27.77% 76.02%   178.66MB 27.77%  bufio.NewWriterSize (inline)
   81.34MB 12.64% 88.67%    81.34MB 12.64%  bufio.NewReaderSize (inline)
   29.01MB  4.51% 93.18%    29.01MB  4.51%  runtime.malg
    6.10MB  0.95% 94.12%     6.10MB  0.95%  github.com/VictoriaMetrics/VictoriaMetrics/lib/encoding.MarshalBytes
       6MB  0.93% 95.06%        6MB  0.93%  time.NewTimer
    5.81MB   0.9% 95.96%     5.81MB   0.9%  github.com/VictoriaMetrics/VictoriaMetrics/lib/protoparser/influx.unmarshalTags
       4MB  0.62% 96.58%        4MB  0.62%  net/textproto.(*Reader).ReadMIMEHeader

File: vminsert-prod
Build ID: 1440fb7cc2c5bdc6c38b14bbe22cb0ef59f1cd53
Type: inuse_space
Time: Apr 23, 2020 at 8:01am (CST)
Showing nodes accounting for 1178.03MB, 95.49% of 1233.68MB total
Dropped 90 nodes (cum <= 6.17MB)
      flat  flat%   sum%        cum   cum%
  635.98MB 51.55% 51.55%   635.98MB 51.55%  bufio.NewWriterSize (inline)
  310.45MB 25.16% 76.72%   310.45MB 25.16%  github.com/VictoriaMetrics/VictoriaMetrics/app/vminsert/netstorage.(*storageNode).push
  117.98MB  9.56% 86.28%   117.98MB  9.56%  bufio.NewReaderSize (inline)
   33.02MB  2.68% 88.96%    33.52MB  2.72%  net/textproto.(*Reader).ReadMIMEHeader
   29.01MB  2.35% 91.31%    29.01MB  2.35%  runtime.malg
   11.50MB  0.93% 92.24%    11.50MB  0.93%  net/textproto.MIMEHeader.Set (inline)
      11MB  0.89% 93.13%   132.14MB 10.71%  net/http.(*conn).readRequest
       7MB  0.57% 93.70%    50.52MB  4.10%  net/http.readRequest

File: vminsert-prod
Build ID: 1440fb7cc2c5bdc6c38b14bbe22cb0ef59f1cd53
Type: inuse_space
Time: Apr 23, 2020 at 8:01am (CST)
Showing nodes accounting for 1816.22MB, 95.61% of 1899.62MB total
Dropped 98 nodes (cum <= 9.50MB)
      flat  flat%   sum%        cum   cum%
 1127.42MB 59.35% 59.35%  1127.42MB 59.35%  bufio.NewWriterSize (inline)
  310.45MB 16.34% 75.69%   310.45MB 16.34%  github.com/VictoriaMetrics/VictoriaMetrics/app/vminsert/netstorage.(*storageNode).push
  200.30MB 10.54% 86.24%   200.30MB 10.54%  bufio.NewReaderSize (inline)
   55.02MB  2.90% 89.13%    55.52MB  2.92%  net/textproto.(*Reader).ReadMIMEHeader
   29.01MB  1.53% 90.66%    29.01MB  1.53%  runtime.malg
   20.50MB  1.08% 91.74%   223.24MB 11.75%  net/http.(*conn).readRequest
      17MB   0.9% 92.63%       17MB   0.9%  net/textproto.MIMEHeader.Set (inline)
      11MB  0.58% 93.21%       11MB  0.58%  time.NewTimer
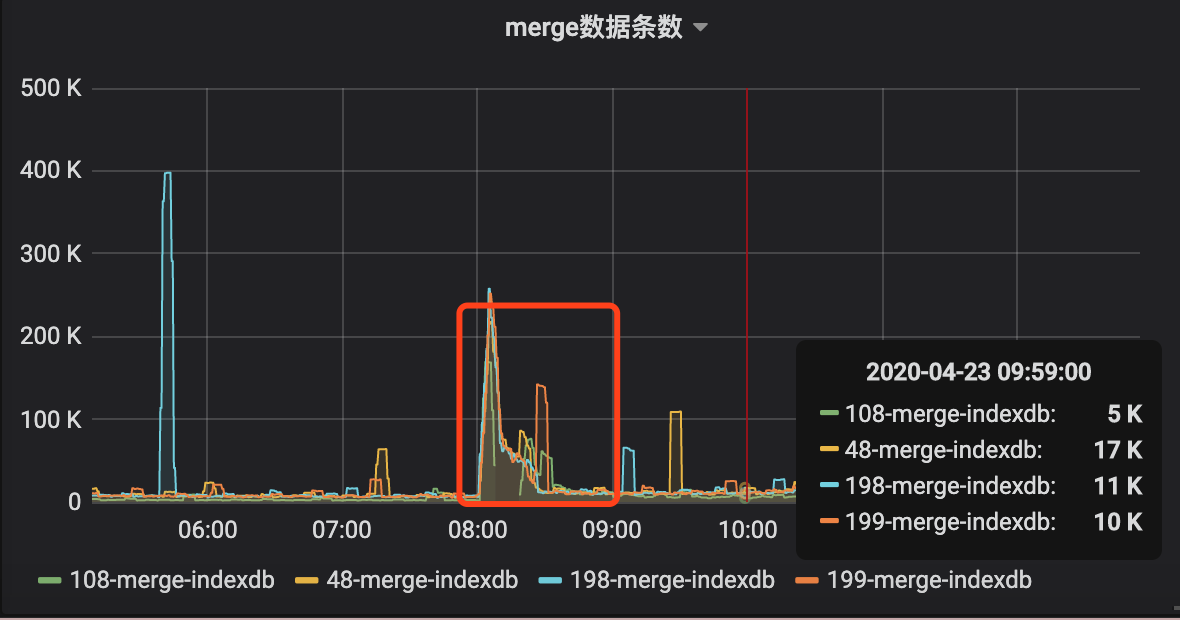
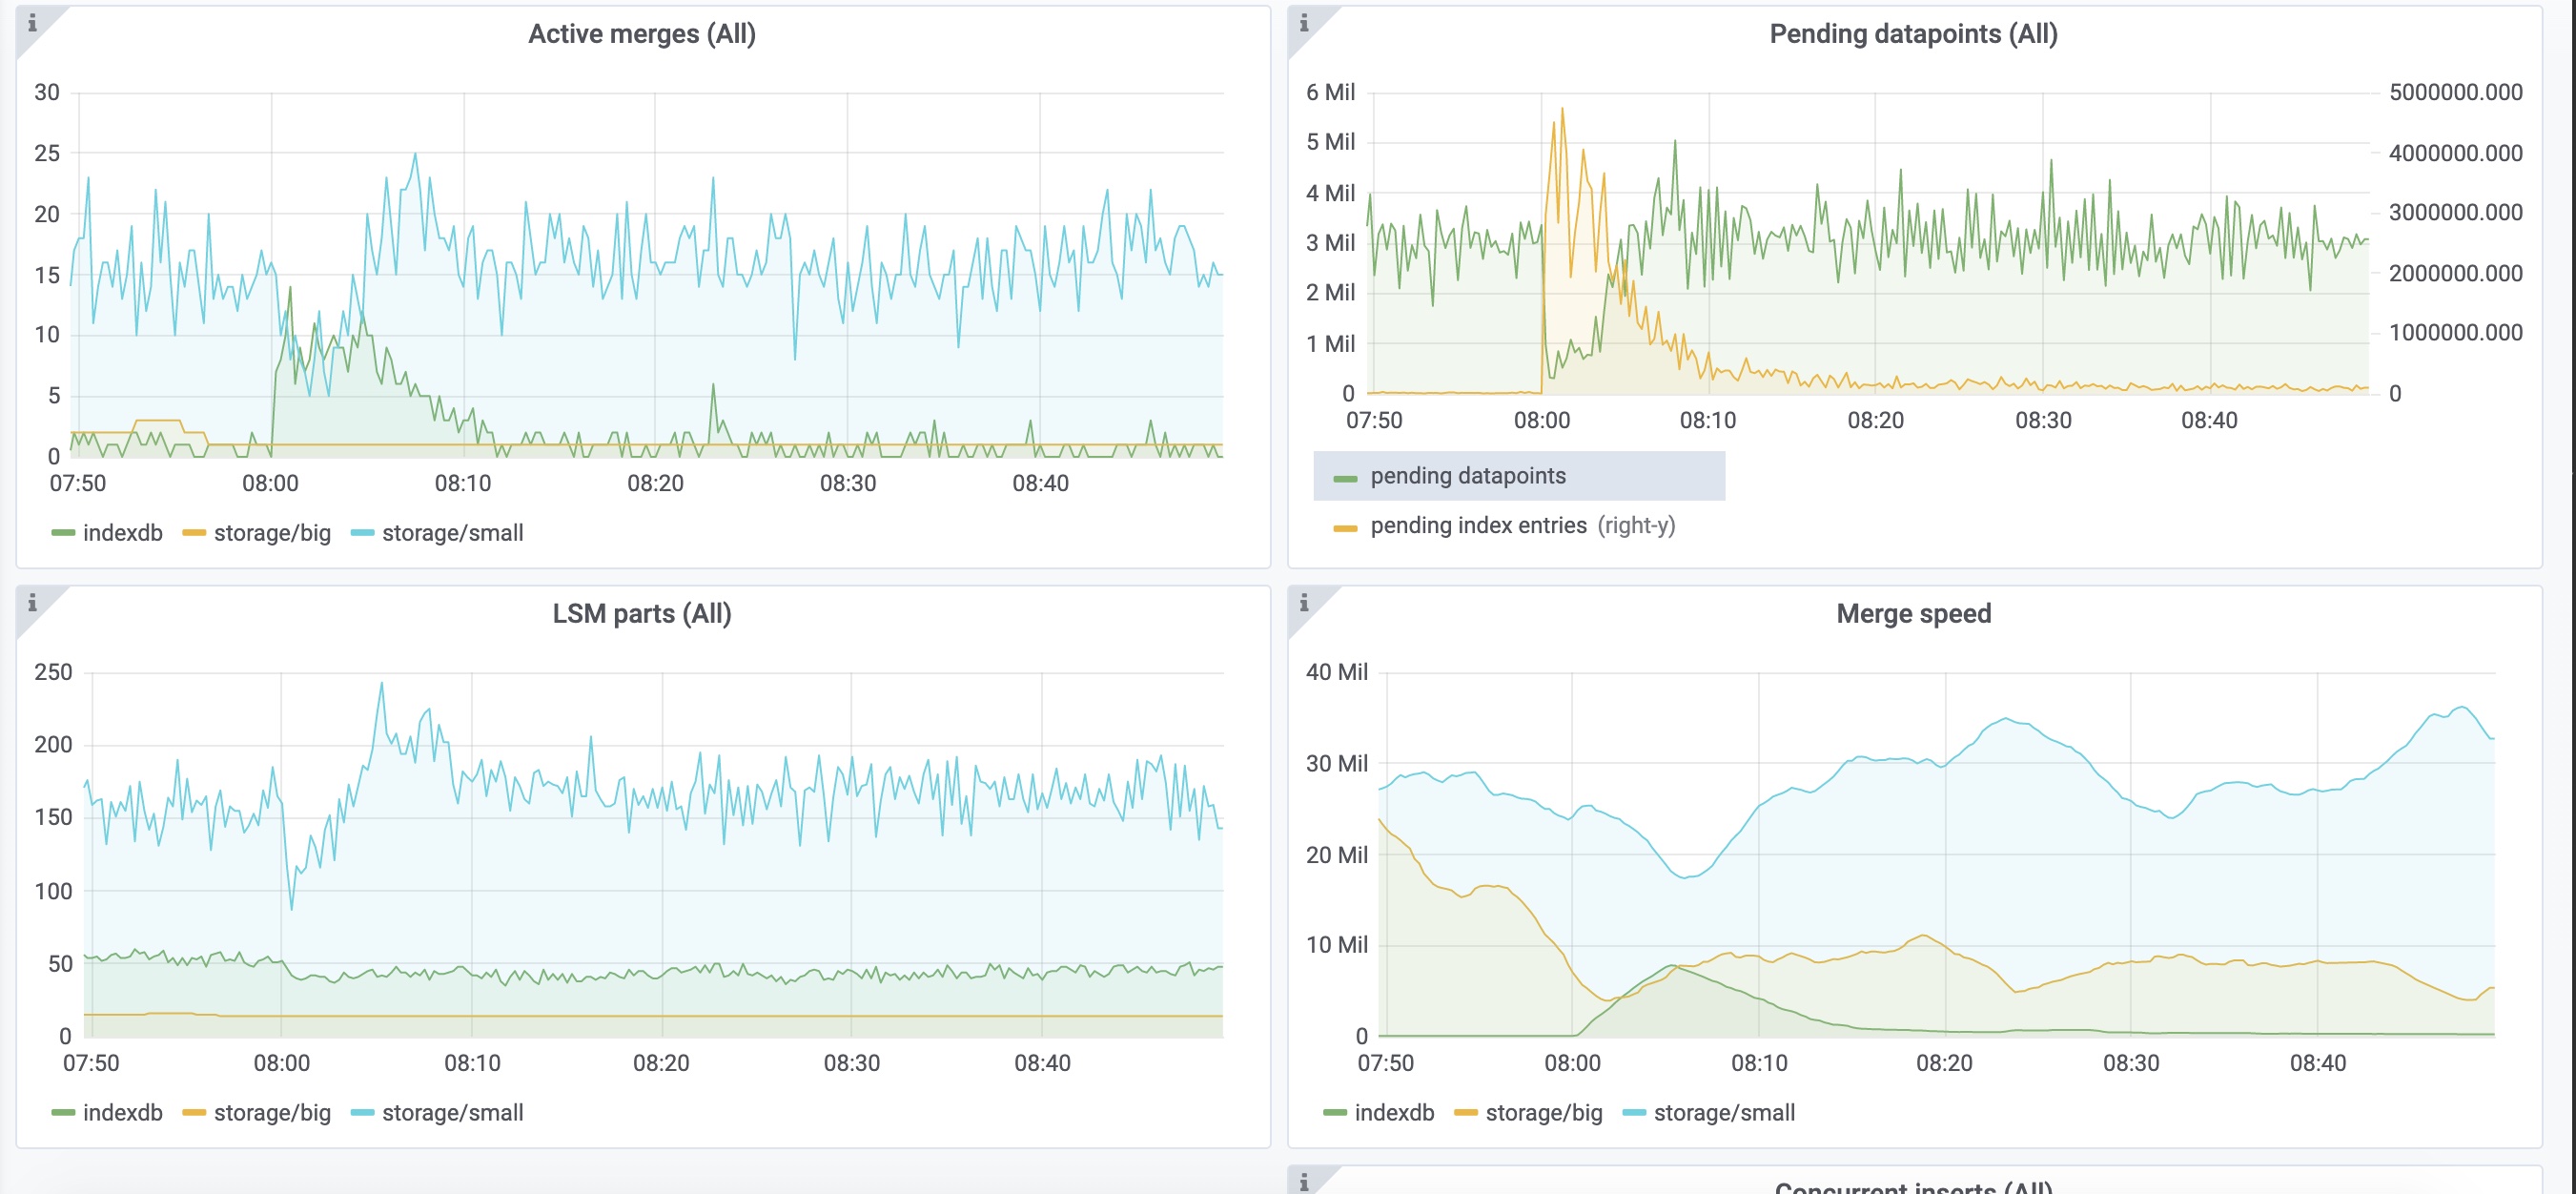
indexdb merge is very high at 00:00. Is that the reason
yincongcyincong
on 23 Apr 2020
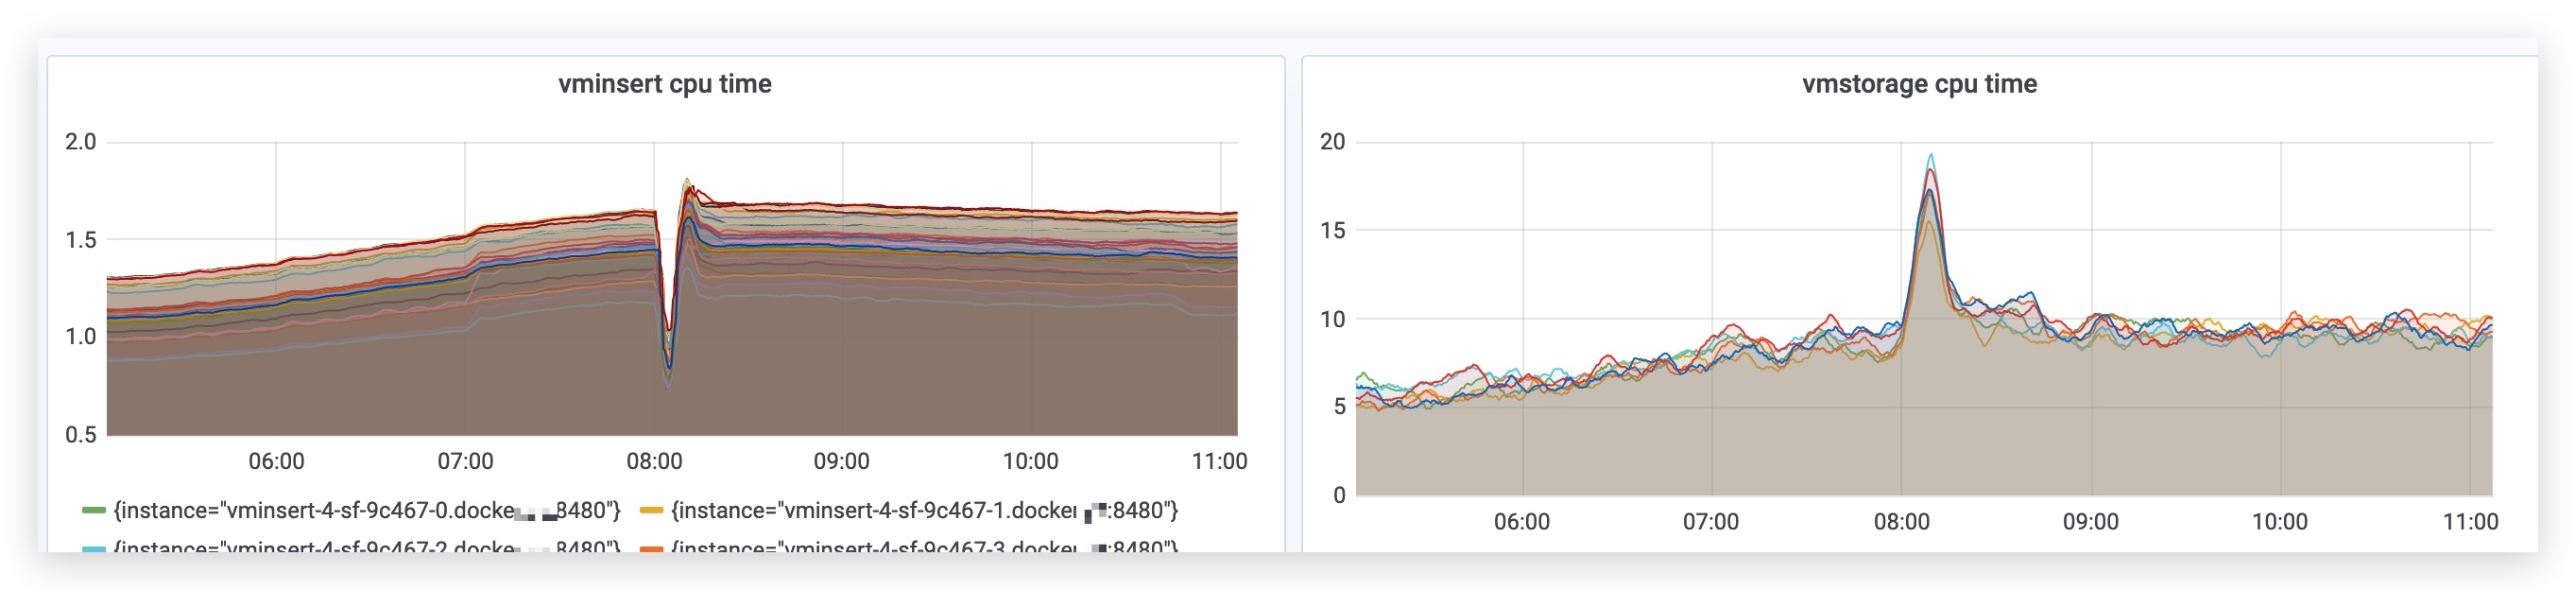
vmstorage has high cpu time spent, i think there's some expensive job at 0 clock per day.
and vminsert can't finish it's job that push to vmstorage at that time, so vminsert cache many points until eat all memory
n4mine
on 23 Apr 2020
@n4mine and @yincongcyincong , thanks for these details!
It is likely the root cause of increased memory usage at 00:00 UTC is in per-day inverted index for time series labels. Every day at 00:00 UTC vmstorage starts building new per-day inverted index for new day as it sees new time series for this day (all time series from the previous day become new for the new day). The duration of this process is proportional to the number of active time series and the number of labels per time series. Usually this process takes up to a few minutes, so it is unnoticed by the majority of users. It can take longer if the number of active time series is high. Typically VictoriaMetrics can create up to 50K per-label entries per second per CPU core in inverted index. The following formula could be used for estimation of the time required for creating per-day inverted index for N active time series with L labels per each time series when nCPUs cores are available to vmstorage nodes in summary:
Tsec = (N * L) / (50K * nCPUs)
For instance, if N=10M, L=10, nCPUs=64, then Tsec=(10M*10)/(50K*64)=32 seconds.
During this process vmstorage slow down accepting new samples from vminsert, so vminsert nodes start buffering pending data in memory. This increases memory usage on vminsert nodes. The maximum memory usage on vminsert nodes may be limited by setting lower value for -memory.allowedPercent command-line flag.
It is possible spreading the load of per-day inverted index creation among longer periods of time. For instance, the index population for the next day can be started before the next day begins. I need to think more about possible solutions for this issue.
 valyala
on 23 Apr 2020
valyala
on 23 Apr 2020
@valyala Could next version solve this problem?
yincongcyincong
on 28 Apr 2020
Our system has a router to dispatch sample to a few system like {rrdtools, kafka for flink, vm, etc..}
For avoid affect our system.
I have to reduce the timeout from my client to vm.
And adjust the -insert.maxQueueDuration to 10s.
So there was a lot of timeout error logs on our client in follow situations:
- at 0 clock per day
- some
vmstorageunreachable - every time i deploy
vminsert
n4mine
on 28 Apr 2020
@n4mine I add 6 vmstorages, which can reduce the duration of this situation,But it's not a good solution
yincongcyincong
on 28 Apr 2020
update
I have one cluster with 5 vmstorage(40core + 128G memory), and ingest points rate is less than 3M points/s.
but i had to expand the vmstorage to 7 nodes to against the 0 clock issue.
today after one vmstorge node dead, the total cluster is crash with lots of vminsert OOM(from 00:00 to 03:00).
i found there is a different in pprof result
File: vminsert-prod
Build ID: 7e920735d78bfe46cf427d62158b4d9a25d75105
Type: inuse_space
Time: May 4, 2020 at 11:39am (CST)
Entering interactive mode (type "help" for commands, "o" for options)
(pprof) top
Showing nodes accounting for 76442.52MB, 98.03% of 77975.68MB total
Dropped 145 nodes (cum <= 389.88MB)
Showing top 10 nodes out of 28
      flat  flat%   sum%        cum   cum%
40517.09MB 51.96% 51.96% 40517.09MB 51.96%  github.com/klauspost/compress/flate.(*fastGen).addBlock (inline)
16904.53MB 21.68% 73.64% 29792.23MB 38.21%  github.com/klauspost/compress/flate.NewWriter
 8586.26MB 11.01% 84.65%  8586.26MB 11.01%  github.com/klauspost/compress/flate.newFastEnc (inline)
 4846.70MB  6.22% 90.87%  4846.70MB  6.22%  bufio.NewWriterSize (inline)
 4044.57MB  5.19% 96.05% 12887.70MB 16.53%  github.com/klauspost/compress/flate.(*compressor).init
 1013.44MB  1.30% 97.35%  1013.44MB  1.30%  bufio.NewReaderSize (inline)
  413.91MB  0.53% 97.89%   414.41MB  0.53%  github.com/VictoriaMetrics/VictoriaMetrics/app/vminsert/netstorage.(*storageNode).push
   96.02MB  0.12% 98.01%   994.55MB  1.28%  net/http.(*conn).readRequest
      11MB 0.014% 98.02% 77334.06MB 99.18%  net/http.(*conn).serve
       9MB 0.012% 98.03%  3470.44MB  4.45%  github.com/VictoriaMetrics/VictoriaMetrics/lib/httpserver.maybeGzipResponseWriter
so now i expand the vmstorage to 10 and upgrade vmstorge and vminsert to lastest version 6606dff58dc8fca380af01be9ff6bc44ef581035
hope this will be solve ASAP.
n4mine
on 4 May 2020
Thanks for the update! I'm still thinking on how to properly fix the issue... Temporary workaround is to increase the number of vmstorage nodes. This should increase cluster's overall ingestion throughput at 00:00 UTC.
valyala
on 6 May 2020
The following commits should address the issue:
- For
vmstoragefrom cluster version - f7753b1469147ea20d836f55bb7bee415245a074 - For single-node version - dbd0c552d5ffa7f96dba1665c01dd095afff2ec7
With these commits VictoriaMetrics should start gradually populating inverted index for the next day during the current day, so the index for the next day should be fully populated before 00:00 UTC.
Note that the initial start of the patched vmstorage or single-node VictoriaMetrics may result in CPU usage spike and temporary slowdown due to pre-population of inverted index for the next day. The CPU usage spike should drop after the inverted index for the next day is complete. After that it shouldn't be repeated at any time, including 00:00 UTC. It may be repeated only when big number of new time series are created at once.
valyala
on 12 May 2020
@n4mine , @yincongcyincong , could you build VictoriaMetrics cluster from the commit https://github.com/VictoriaMetrics/VictoriaMetrics/commit/f7753b1469147ea20d836f55bb7bee415245a074 and verify whether the commit fixes the issue at 00:00 UTC? See instructions on how to build cluster components from sources.
valyala
on 12 May 2020
@valyala
thanks for your work.
I will deploy later, and give feedback ASAP.
n4mine
on 12 May 2020
FYI, the fix has been included in v1.35.4, which has been just released.
valyala
on 12 May 2020
@valyala
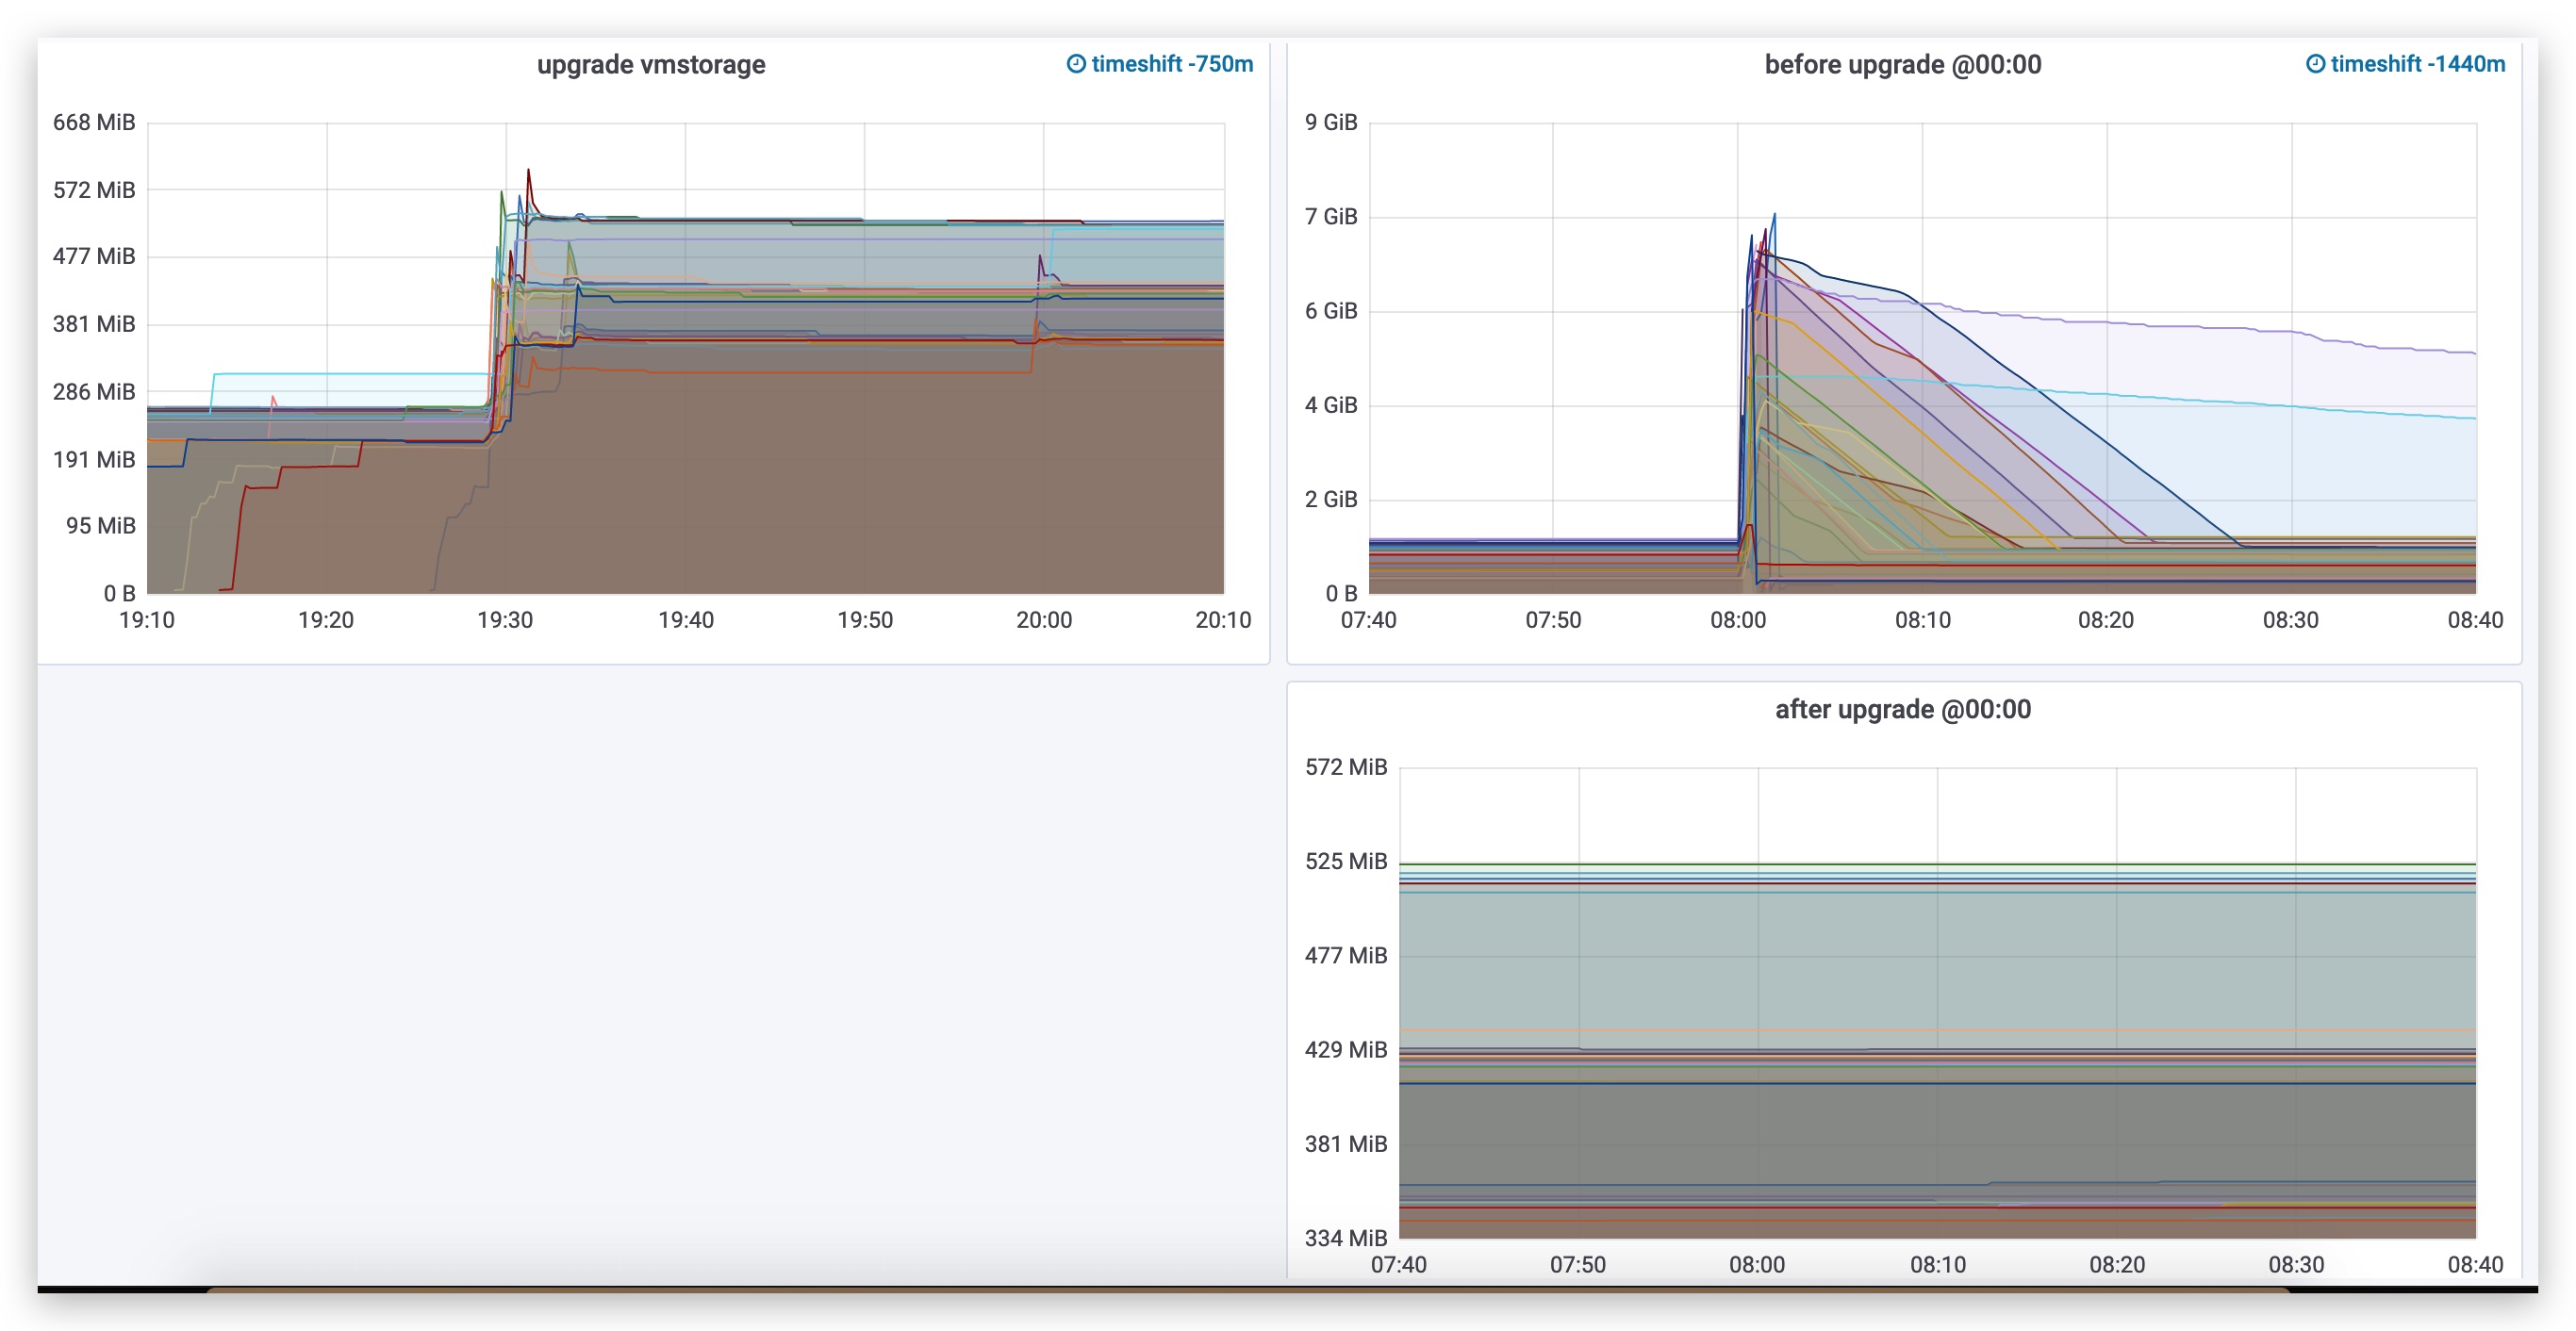
i deploy the vmstorage, and the result seems fine.
and more questions/status:
what
vm_cache_entries{type="storage/next_day_metric_ids"}mean, have any relationship with this and total unique series?the memory of
vminsertused whenvmstoragestart was increased, from280Mto540M, but it's fine for me :)Note that the initial start of the patched vmstorage or single-node VictoriaMetrics may result in CPU usage spike and temporary slowdown due to pre-population of inverted index for the next day.
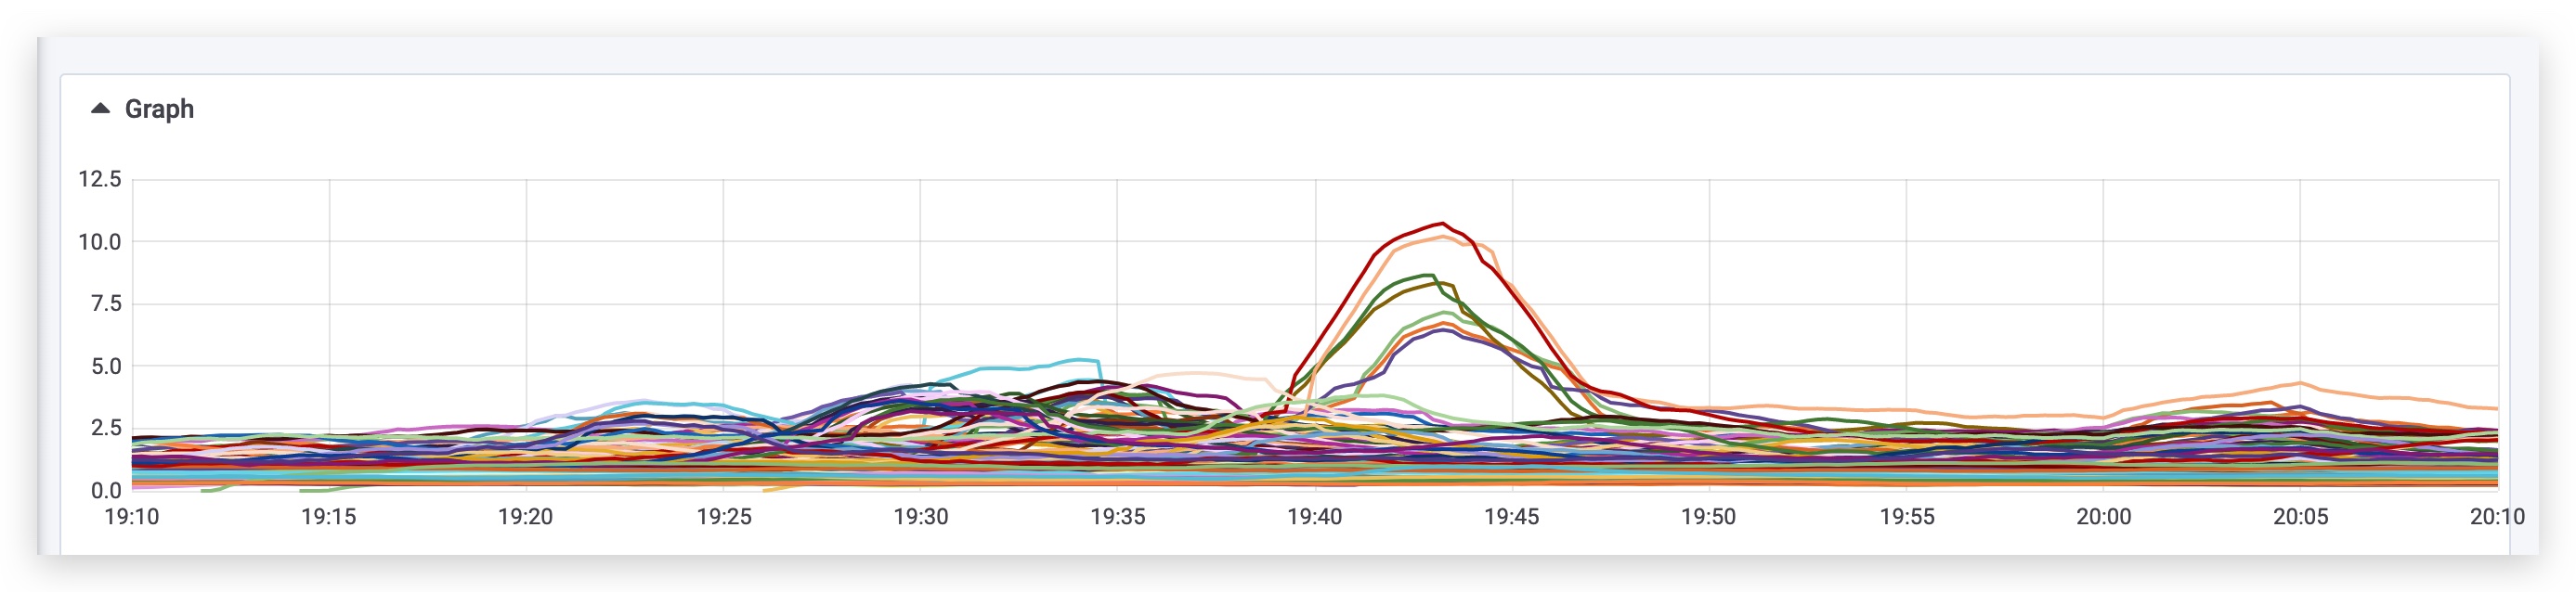
a cluster which have 7 vmstorage instances and ingest rate 1.196 Mil point/s, the cpu usage from 3 climb to 11, it's fine for me now.
n4mine
on 13 May 2020
@n4mine , thanks for the update!
valyala
on 20 May 2020
what vm_cache_entries{type="storage/next_day_metric_ids"} mean, have any relationship with this and total unique series?
This cache populates metric_ids for time series added to inverted index for the next day. The size of the vm_cache_entries{type="storage/next_day_metric_ids"} resets at 00:00 UTC and must grow gradually until 00:00 UTC on the next day. The value at the end of the day represents the total number of time series seen during the day.
the memory of vminsert used when vmstorage start was increased, from 280M to 540M, but it's fine for me :)
vminsert buffers pending data in memory if vmstorage is unavailable for short periods of time. This may lead to higher memory usage for vminsert. If vmstorage is unavailable for extended periods of time, then vminsert starts dropping incoming data in order to prevent from consuming unbounded amounts of RAM.
valyala
on 20 May 2020
Related issues
 jelmd
·
3Comments
n4mine
·
3Comments
jelmd
·
3Comments
n4mine
·
3Comments
 prdatur
·
3Comments
prdatur
·
3Comments
 pmitra43
·
3Comments
pmitra43
·
3Comments
 EricAntoni
·
3Comments
EricAntoni
·
3Comments
Most helpful comment
This cache populates metric_ids for time series added to inverted index for the next day. The size of the
vm_cache_entries{type="storage/next_day_metric_ids"}resets at 00:00 UTC and must grow gradually until 00:00 UTC on the next day. The value at the end of the day represents the total number of time series seen during the day.vminsertbuffers pending data in memory ifvmstorageis unavailable for short periods of time. This may lead to higher memory usage forvminsert. Ifvmstorageis unavailable for extended periods of time, thenvminsertstarts dropping incoming data in order to prevent from consuming unbounded amounts of RAM.