Victoriametrics: Data can only be queried for big time ranges (>=12 hours) starting from 1.34.5
Describe the bug
All of my grafana dashboards break when upgrading to 1.34.5 or higher, because queries no longer return proper results when the timeframe is less than 12 hours
I also tried removing the cache/ directory without success
To Reproduce
- Go to grafana -> Explore
- Query anything with a time range of less than 12 hours
- no result
- Change time range to 12 hours or more
- see results
Expected behavior
I'd expect victoria-metrics to always deliver the correct responses independent of the selected timeframe (it did this correctly in 1.34.5)
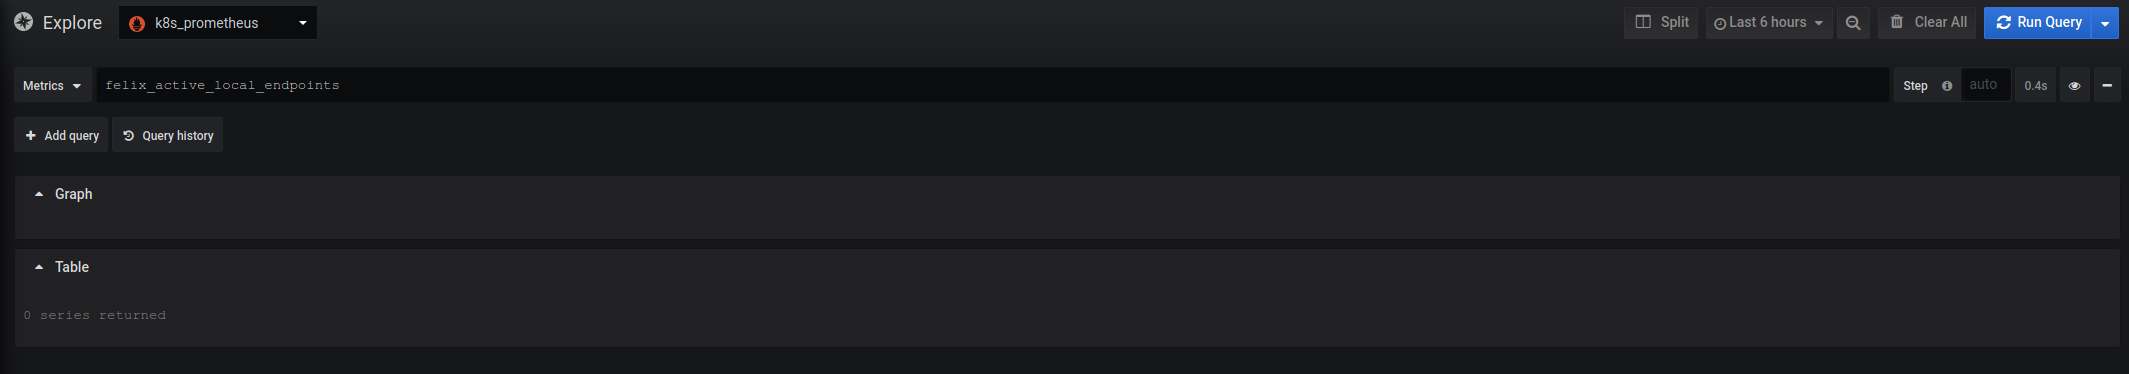
Screenshots
Not working because selection is < 12 hours
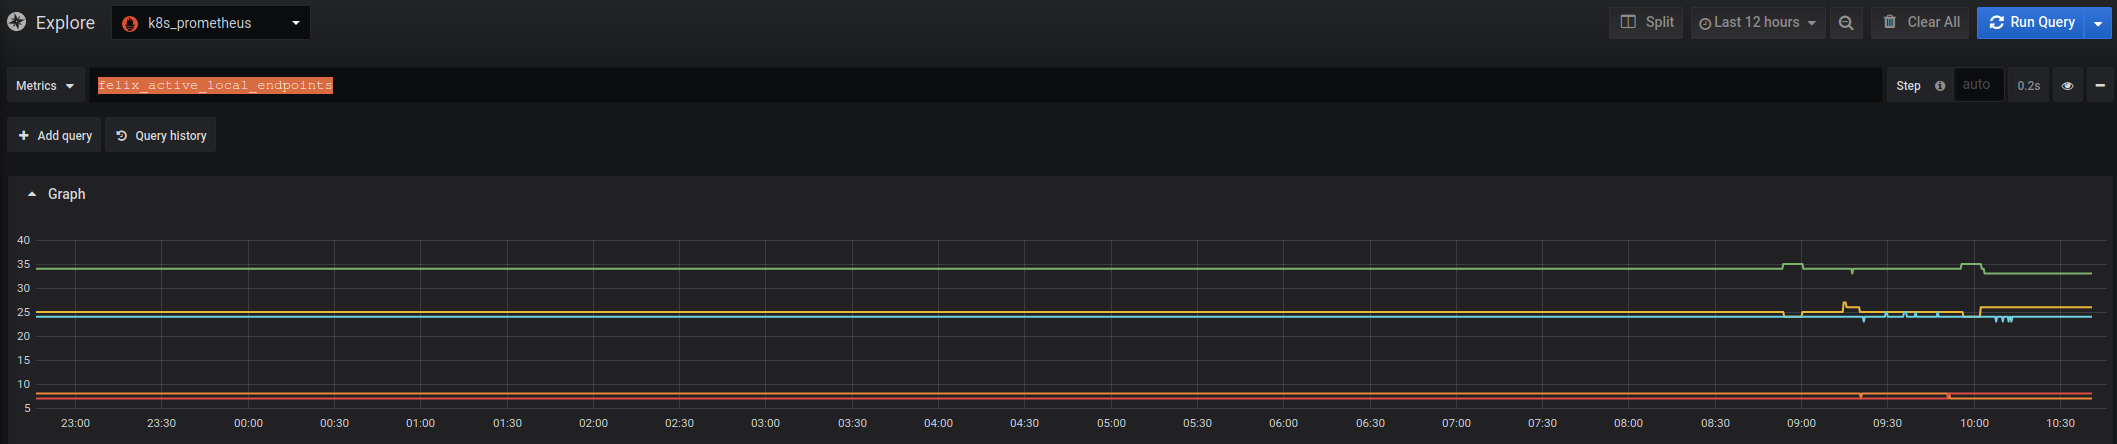
Working because selection > 12 hours
Version
Correctly working Docker Image: victoriametrics/victoria-metrics:v1.34.4
Not working Docker Images: victoriametrics/victoria-metrics:v1.34.5 , victoriametrics/victoria-metrics:v1.34.6 , victoriametrics/victoria-metrics:v1.34.7
Used command-line flags
--storageDataPath=/data --httpListenAddr=:8428
 Bobonium
All 4 comments
@Bobonium , thanks for the detailed bug report! It can be related to the following optimization added in v1.34.5:
optimize per-day inverted index search for tag filters matching big number of time series
Unfortunately I cannot reproduce this issue locally, so more help is needed from your side in order to identify the root cause of the issue. Could you provide the following additional details when running v1.34.7?
- Could you check whether the issue is reproduced when querying any time series or only specific ones?
- Could you check whether the issue is reproduced on any time range smaller than 12 hours from the current time? Try zooming in / zooming out the graph and note zoom levels where the issue is reproduced.
- Could you confirm that the minimum query, which reproduces the issue, contains only a metric name like
felix_active_local_endpointswithout any additional label filters? - Could you verify whether the issue is reproduced when adding label filters to the query (i.e.
felix_active_local_endpoints{some_label="foobar"}? - Could you check whether the issue is reproduced on time ranges from the past or only on time ranges ending at the current time?
- Could you check whether the issue is reproduced on a time range covering only a single day according to UTC time? What about time ranges covering two days according to UTC time, i.e. from 9pm UTC on one day to 3am UTC on the next day?
 valyala
on 8 Apr 2020
valyala
on 8 Apr 2020
Additionally, it would be great if you could provide archived contents of -storageDataPath directory for the minimum amounts of data where this issue is reproduced. You can publish this archive on s3 or any other file sharing service and send access credentials for this archive to my email [email protected] .
valyala
on 8 Apr 2020
Well the good news is, I just solved the issue and it's working on 1.34.5, 1.34.6 and 1.34.7.
The bad news is I don't know why, I just now upgraded again to get you the data you asked for but it's working flawlessly today.
I tested it yesterday multiple times without success, so I've no idea what changed between then.
I also don't have a backup of the state of the data from yesterday so there's no way for me to reproduce it currently either. I should've made a backup right away, sorry for that.
As a side note, I also deleted the cache directory and the pod several times yesterday, so I'd expect that the problem is not within the cache but the data storage itself.
In case this ever happens again I'll prepare a reproducible backup for you immediately.
Feel free to either close the issue or keep it open for others to see, I'd simply open another one if it's closed and I'm able to reproduce it in the future.
Lastly I'd just like to thank you for your quick and detailed response and for all the work you do on this project.I started using it roughly a year ago, and I'm really happy with it so far. My kubernetes Cluster generates ~25gb in VictoriaMetrics data and everything's running smoothly. And I've never lost a single second of data by simply deploying a single VictoriaMetrics instance with persistence, together with a single prometheus instance (scheduled on different nodes) without persistence.
Bobonium
on 8 Apr 2020
@Bobonium , thanks for the warm response :)
I guess the issue was related to response cache, which cached incomplete results somehow (probably due to writing historical data to it - see these docs for details on how to deal properly with historical data). You said that you deleted the cache dir, but, probably, VictoriaMetrics re-created this dir on graceful shutdown. Note tat the cache dir must be removed when VictoriaMetrics is stopped. If you remove it while VictoriaMetrics is running, then it will be re-created on shutdown.
Note also that VictoriaMetrics gained support for resetting response cache via /internal/resetRollupResultCache handler, so there is no need in deleting <-storageDataPath>/cache dir now in order to clean cached data.
I'm going to close this issue. Feel free re-opening this one or creating new one if you encounter the same issue again.
valyala
on 9 Apr 2020
Related issues
 EricAntoni
·
3Comments
EricAntoni
·
3Comments
 pmitra43
·
3Comments
pmitra43
·
3Comments
 oOHenry
·
4Comments
oOHenry
·
4Comments
 n4mine
·
3Comments
valyala
·
4Comments
n4mine
·
3Comments
valyala
·
4Comments
Most helpful comment
Well the good news is, I just solved the issue and it's working on 1.34.5, 1.34.6 and 1.34.7.
The bad news is I don't know why, I just now upgraded again to get you the data you asked for but it's working flawlessly today.
I tested it yesterday multiple times without success, so I've no idea what changed between then.
I also don't have a backup of the state of the data from yesterday so there's no way for me to reproduce it currently either. I should've made a backup right away, sorry for that.
As a side note, I also deleted the cache directory and the pod several times yesterday, so I'd expect that the problem is not within the cache but the data storage itself.
In case this ever happens again I'll prepare a reproducible backup for you immediately.
Feel free to either close the issue or keep it open for others to see, I'd simply open another one if it's closed and I'm able to reproduce it in the future.
Lastly I'd just like to thank you for your quick and detailed response and for all the work you do on this project.I started using it roughly a year ago, and I'm really happy with it so far. My kubernetes Cluster generates ~25gb in VictoriaMetrics data and everything's running smoothly. And I've never lost a single second of data by simply deploying a single VictoriaMetrics instance with persistence, together with a single prometheus instance (scheduled on different nodes) without persistence.