Victoriametrics: Query occasionally returns incorrect empty response
Describe the bug
I am using promxy to do alerting from victoriaMetrics. Occasionally, my promxy alerts incorrectly toggle from firing to resolved, because victoriaMetrics incorrectly returns an empty response to the promxy query.
To Reproduce
I used mitmproxy to catch these errors. They occur quite infrequently, however this is the POST request.
Endpoint:
http://my_vm_host:28401/api/v1/query?nocache=1
Body:
nocache: 1
query:   cvpdnSystemSessionTotal{category="l2tp",device_id=~"3662|1601",instance="l2tp"}
time:    1585039226.312
Expected behavior
Here is the expected response:
 {
  "status":"success","data": {
    "resultType":"vector","result":[ {
      "metric": {
        "__name__":"cvpdnSystemSessionTotal","category":"l2tp","device_id":"1601","instance":"l2tp"
      }
      ,"value":[1585039226.312,"0"]
    }
    , {
      "metric": {
        "__name__":"cvpdnSystemSessionTotal","category":"l2tp","device_id":"3662","instance":"l2tp"
      }
      ,"value":[1585039226.312,"1"]
    }
    ]
  }
}
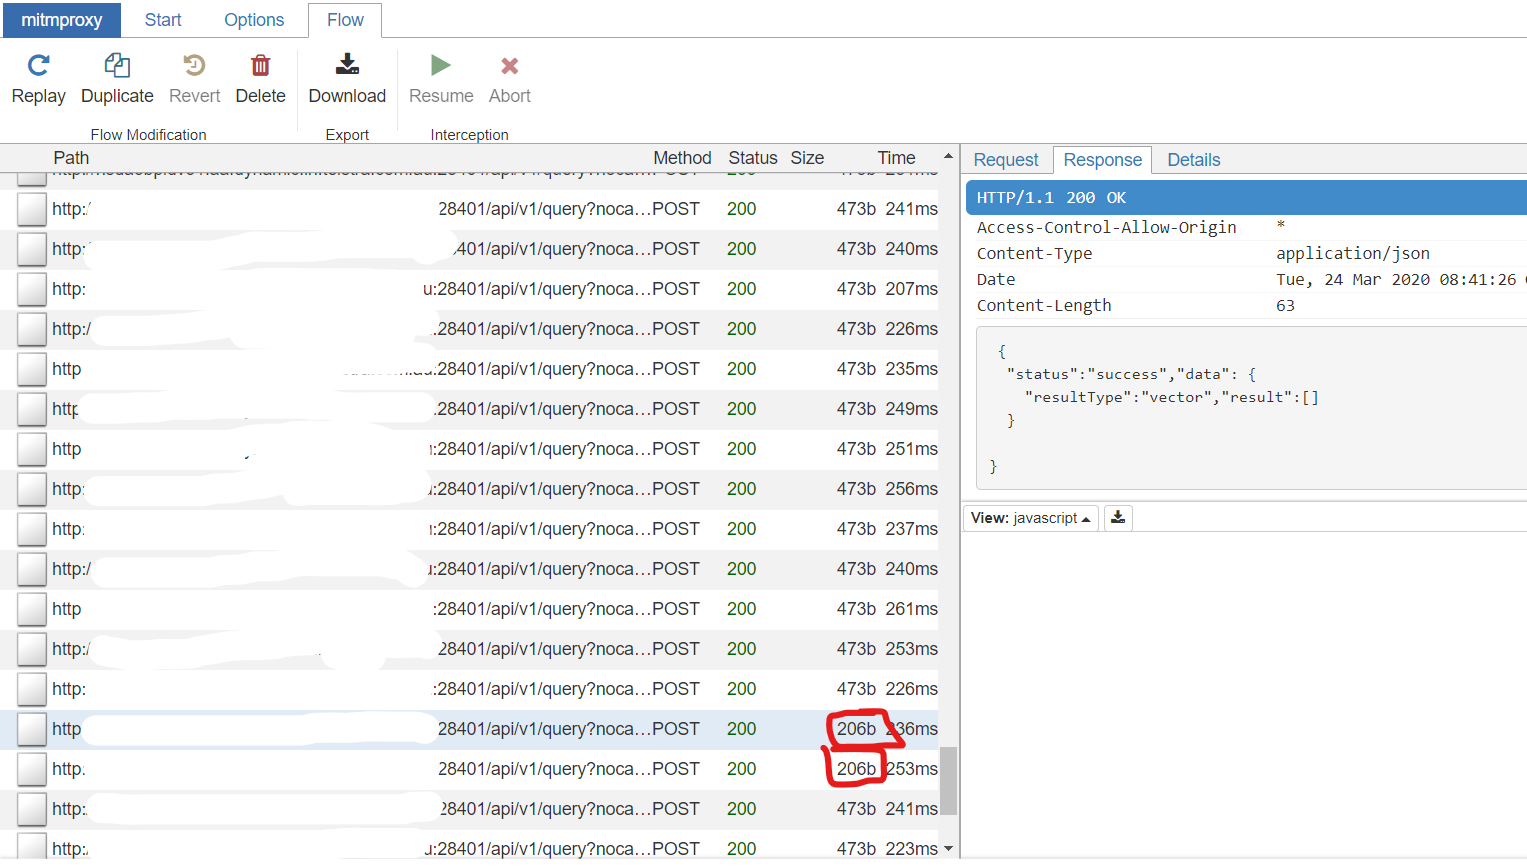
and here is the occasional, incorrect response:
 {
  "status":"success","data": {
    "resultType":"vector","result":[]
  }
}
It still returns a 200 OK, and there are no errors generated in the logs.
Screenshots
Here is a screenshot of the mitmproxy logs. The two erroneous responses are circled in red.
Version
victoria-metrics-20200311-020925-tags-v1.34.3-0-gcdf70b79
Used command-line flags
flag{name="bigMergeConcurrency", value="0"} 1
flag{name="dedup.minScrapeInterval", value="0s"} 1
flag{name="deleteAuthKey", value="secret"} 1
flag{name="enableTCP6", value="false"} 1
flag{name="envflag.enable", value="false"} 1
flag{name="fs.disableMmap", value="false"} 1
flag{name="graphiteListenAddr", value=""} 1
flag{name="http.disableResponseCompression", value="false"} 1
flag{name="httpAuth.password", value="secret"} 1
flag{name="httpAuth.username", value=""} 1
flag{name="httpListenAddr", value=":8428"} 1
flag{name="import.maxLineLen", value="104857600"} 1
flag{name="influxListenAddr", value=""} 1
flag{name="influxMeasurementFieldSeparator", value="_"} 1
flag{name="influxSkipSingleField", value="true"} 1
flag{name="insert.maxQueueDuration", value="1m0s"} 1
flag{name="loggerFormat", value="default"} 1
flag{name="loggerLevel", value="INFO"} 1
flag{name="loggerOutput", value="stderr"} 1
flag{name="maxConcurrentInserts", value="96"} 1
flag{name="maxInsertRequestSize", value="33554432"} 1
flag{name="maxLabelsPerTimeseries", value="30"} 1
flag{name="memory.allowedPercent", value="100"} 1
flag{name="metricsAuthKey", value="secret"} 1
flag{name="opentsdbHTTPListenAddr", value=""} 1
flag{name="opentsdbListenAddr", value=""} 1
flag{name="opentsdbhttp.maxInsertRequestSize", value="33554432"} 1
flag{name="pprofAuthKey", value="secret"} 1
flag{name="precisionBits", value="64"} 1
flag{name="promscrape.config", value=""} 1
flag{name="promscrape.disableCompression", value="false"} 1
flag{name="promscrape.fileSDCheckInterval", value="1m0s"} 1
flag{name="promscrape.maxScrapeSize", value="16777216"} 1
flag{name="search.cacheTimestampOffset", value="5m0s"} 1
flag{name="search.disableCache", value="false"} 1
flag{name="search.latencyOffset", value="30s"} 1
flag{name="search.logSlowQueryDuration", value="5s"} 1
flag{name="search.maxConcurrentRequests", value="16"} 1
flag{name="search.maxExportDuration", value="720h0m0s"} 1
flag{name="search.maxLookback", value="0s"} 1
flag{name="search.maxPointsPerTimeseries", value="30000"} 1
flag{name="search.maxQueryDuration", value="2m0s"} 1
flag{name="search.maxQueryLen", value="16384"} 1
flag{name="search.maxQueueDuration", value="10s"} 1
flag{name="search.maxTagKeys", value="secret"} 1
flag{name="search.maxTagValues", value="100000"} 1
flag{name="search.maxUniqueTimeseries", value="1000000"} 1
flag{name="search.resetCacheAuthKey", value="secret"} 1
flag{name="selfScrapeInterval", value="0s"} 1
flag{name="smallMergeConcurrency", value="0"} 1
flag{name="snapshotAuthKey", value="secret"} 1
flag{name="storageDataPath", value="victoria-metrics-data"} 1
flag{name="tls", value="false"} 1
flag{name="tlsCertFile", value=""} 1
flag{name="tlsKeyFile", value="secret"} 1
flag{name="version", value="false"} 1
 gseddon
All 11 comments
Update: I have tried this with an older version, with a custom build of the latest master commit (25f585ecf2d085bd8d39a9046aba9d6ef68aa223), and also tried setting search.maxStalenessInterval to be greater than any possible interval our data could be separated by.
I have also found that the issue occurs at quite specific times. It seems to be once every 5 minutes, for an interval of about 1 minute. e.g. between 3:45:20-3:46:30, then 3:50:30-3:51:30. Could this have something to do with the nocache=1 query parameter?
gseddon
on 24 Mar 2020
This can be related to #360 , which should be fixed in v1.34.4. @gseddon , could you try v1.34.4?
Also what value for -search.maxStalenessInterval comand-line flag do you use? There may be up to a few seconds delay between data ingestion into VictoriaMetrics and the data visibility in queries. So too small value for -search.maxStalenessInterval may result in missing data in responses.
 valyala
on 27 Mar 2020
valyala
on 27 Mar 2020
Hi all, Thanks for the feedback.
@gseddon has handed this task over and I will be following this up from here on out.
We'll validate this new version and your stalenessInterval suggestions.
Much appreciate the quick response :)
 loadx
on 31 Mar 2020
loadx
on 31 Mar 2020
@valyala So we've now validated your suggestions.
Unfortunately changing the version had no impact. :'(
Changing the search.maxStalenessInterval value results in all responses being empty lists.
We tried values > 60 seconds and < 10 seconds, all have the same effect.
When resetting search.maxStalenessInterval back to 0 using version v1.34.4 the behavior reverts to the same as mentioned above by @gseddon
Cheers
loadx
on 3 Apr 2020
Try removing nocache=1 arg from the /api/v1/query and playing with -search.latencyOffset command-line flag:
  -search.latencyOffset duration
        The time when data points become visible in query results after the collection. Too small value can result in incomplete last points for query results (default 30s)
BTW, what is the interval between data points in the queried time series? Probably, sometimes VictoriaMetrics doesn't receive the last data point in timely manner, so it returns empty results.
Also try the latest release - v1.34.7. It contains a fix for /api/v1/query handling at 2ebf7d86ff85f33683708965cf2317ade6471afb .
valyala
on 6 Apr 2020
After trying these suggestions we are doing some further validation before concluding our results.
I believe that the problem might have also coincided with something we overlooked.
I'll let you know how this goes. Once again apologies for the monster delay... world is a bit crazy right now.
As an aside what is the standard behavior of 'nocache'? if its enabled does this imply that the value retrieved will be whatever the 'last' calculated value is without re-calculating this in victoriaMetrics or am i misinterpreting this?
loadx
on 15 Apr 2020
As an aside what is the standard behavior of 'nocache'?
The nocache=1 arg passed to /api/v1/query shifts query evaluation time from now to now - <-search.latencyOffset>, where -search.latencyOffset is the corresponding command-line flag, which is set to 30 seconds by default. The nocache=1 arg is needed mainly for Promxy, which expects that timestamps in the response always equal to time query arg. See https://github.com/VictoriaMetrics/VictoriaMetrics/issues/241 for details.
VictoriaMetrics doesn't cache responses for queries to /api/v1/query. It only caches response for queries to /api/v1/query_range. So nocache=1 passed to /api/v1/query_range disables the response cache.
valyala
on 15 Apr 2020
Ok after some deep investigation. The problem does not lie in VictoriaMetric's itself, it's actually Promxy that is the issue here. It appears that it's not applying the LookbackDelta that is specified query.lookup-delta.
I'm going to open a new issue for it as I can't seem to track down what is causing the bug.
...sigh, our tests were wrong.
So it appears that when setting the max_lookback parameter directly in victoria metrics api that it's ignored. Im doing some deeper investigation to figure out where in the code this occurs, hopefully will have some more detail soon.
loadx
on 20 Apr 2020
FYI, it has been appeared that -search.maxLookback command-line flag and lookback_delta query arg have the same meaning as -search.maxStalenessInterval. See https://github.com/VictoriaMetrics/VictoriaMetrics/issues/426 for details. I think you need newly added -search.minStalenessInterval command-line flag, which has been added into master branch. See 9ebc9376859565013451a3e9511f8954ae1f0f4a . See the end of comment https://github.com/VictoriaMetrics/VictoriaMetrics/issues/426#issuecomment-616677745 for details and additional workarounds (adding [d] in the end of metrics selector, where d exceeds scrape interval).
valyala
on 20 Apr 2020
I wanted to put everyone out of their misery. After several days of testing i believe we have a winner! minStalenessInterval was indeed the solution to all of our problems.
I appreciate all of your help @valyala and the linked issue #426 was amazingly helpful. 🥇
loadx
on 28 Apr 2020
Then closing the issue.
valyala
on 6 May 2020
Related issues
 dima-vm
·
3Comments
dima-vm
·
3Comments
 oOHenry
·
4Comments
valyala
·
4Comments
oOHenry
·
4Comments
valyala
·
4Comments
 jelmd
·
3Comments
jelmd
·
3Comments
 EricAntoni
·
3Comments
EricAntoni
·
3Comments
Most helpful comment
I wanted to put everyone out of their misery. After several days of testing i believe we have a winner!
minStalenessIntervalwas indeed the solution to all of our problems.I appreciate all of your help @valyala and the linked issue #426 was amazingly helpful. 🥇